
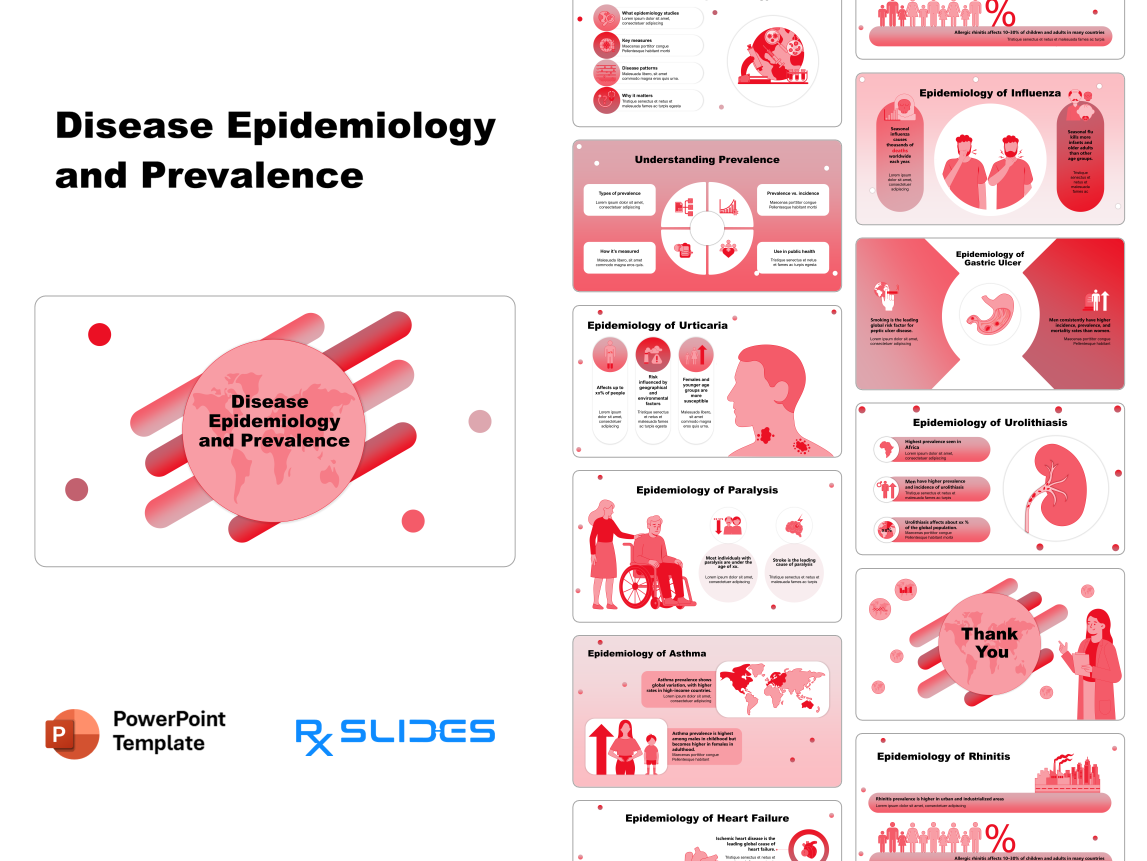
Disease Epidemiology and Prevalence Infographics Template Free Download
Collection of PowerPoint templates for everyone working in the medical field
Download this free template
Master the visual representation of public health data with our Disease Epidemiology & Prevalence Infographic Template. This deck is an essential tool for epidemiologists, medical researchers, and health policy experts to communicate disease patterns, key measures, and the global burden of various conditions. With a professional red-toned clinical theme, these slides help simplify complex data like incidence vs. prevalence and demographic susceptibility.
Key Features & Benefits
- Foundational Epidemiological Frameworks: Pre-structured slides to explain what epidemiology studies, why it matters, and how to measure public health impact.
- Comparative Metric Visuals: Dedicated sections to distinguish between Prevalence and Incidence and to map types of prevalence (Point, Period, etc.).
- Global & Environmental Mapping: Professional world map layouts to illustrate geographical variations in conditions like Asthma and Urolithiasis.
- Demographic Deep Dives: Specialized icons for age-group susceptibility, gender-based prevalence, and urbanization factors.
- Condition-Specific Data Sets: Includes specialized epidemiological deep dives for:
- Cardiovascular: Global causes of heart failure in aging populations.
- Respiratory: Urban vs. industrialized prevalence of Rhinitis and global variation in Asthma.
- Gastrointestinal: Gender-based incidence of Gastric Ulcers and the role of smoking as a leading risk factor.
What’s Inside the Infographics?
This slide collection provides a comprehensive look at the following clinical data sets:
- Epidemiology Basics: Visualizing disease patterns and public health decision support.
- Urticaria (Hives): Geographical and environmental risk factors.
- Paralysis: Data focusing on stroke as the leading cause and age-specific prevalence.
- Influenza: Global mortality patterns, specifically highlighting risk for infants and older adults.
- Urolithiasis (Kidney Stones): Global prevalence with a focus on regional data from Africa and male susceptibility.