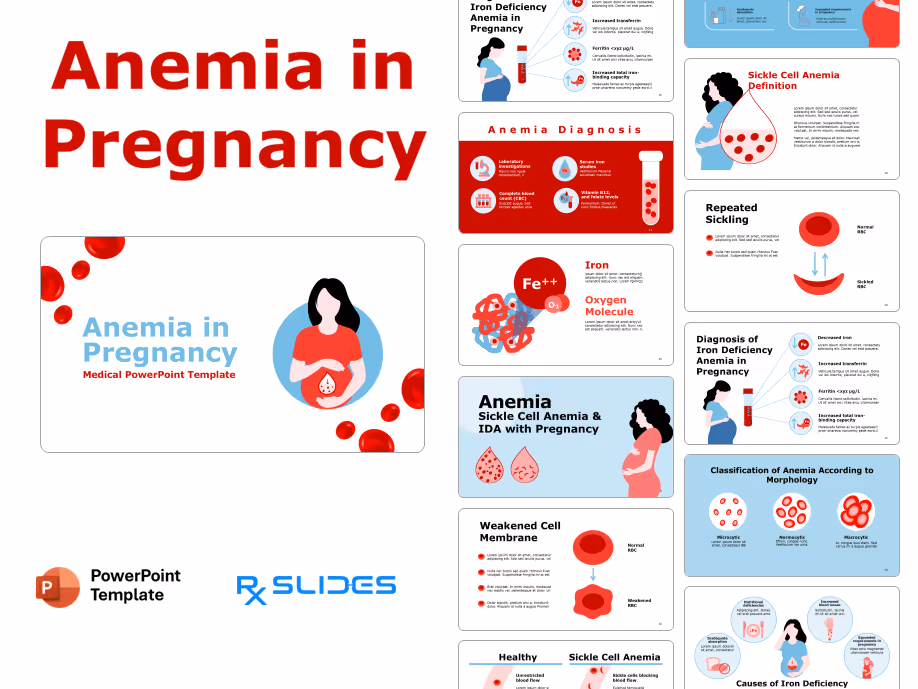
COPD PowerPoint Template


Chronic obstructive pulmonary disease (COPD): Animated Medical PowerPoint Slides
- COPD PPT (Chronic Obstructive Pulmonary Disease) animated template is a dynamic medical PowerPoint template that will help you explore the full potential of your presentation.
- RxSlides templates provide medical animations and infographics to attract your audience.
- Our Animated Respiratory System PPT Templates are designed to impress. They'll attract the interest of your audience and simplify even the most complex procedures with attractive visuals and animations.
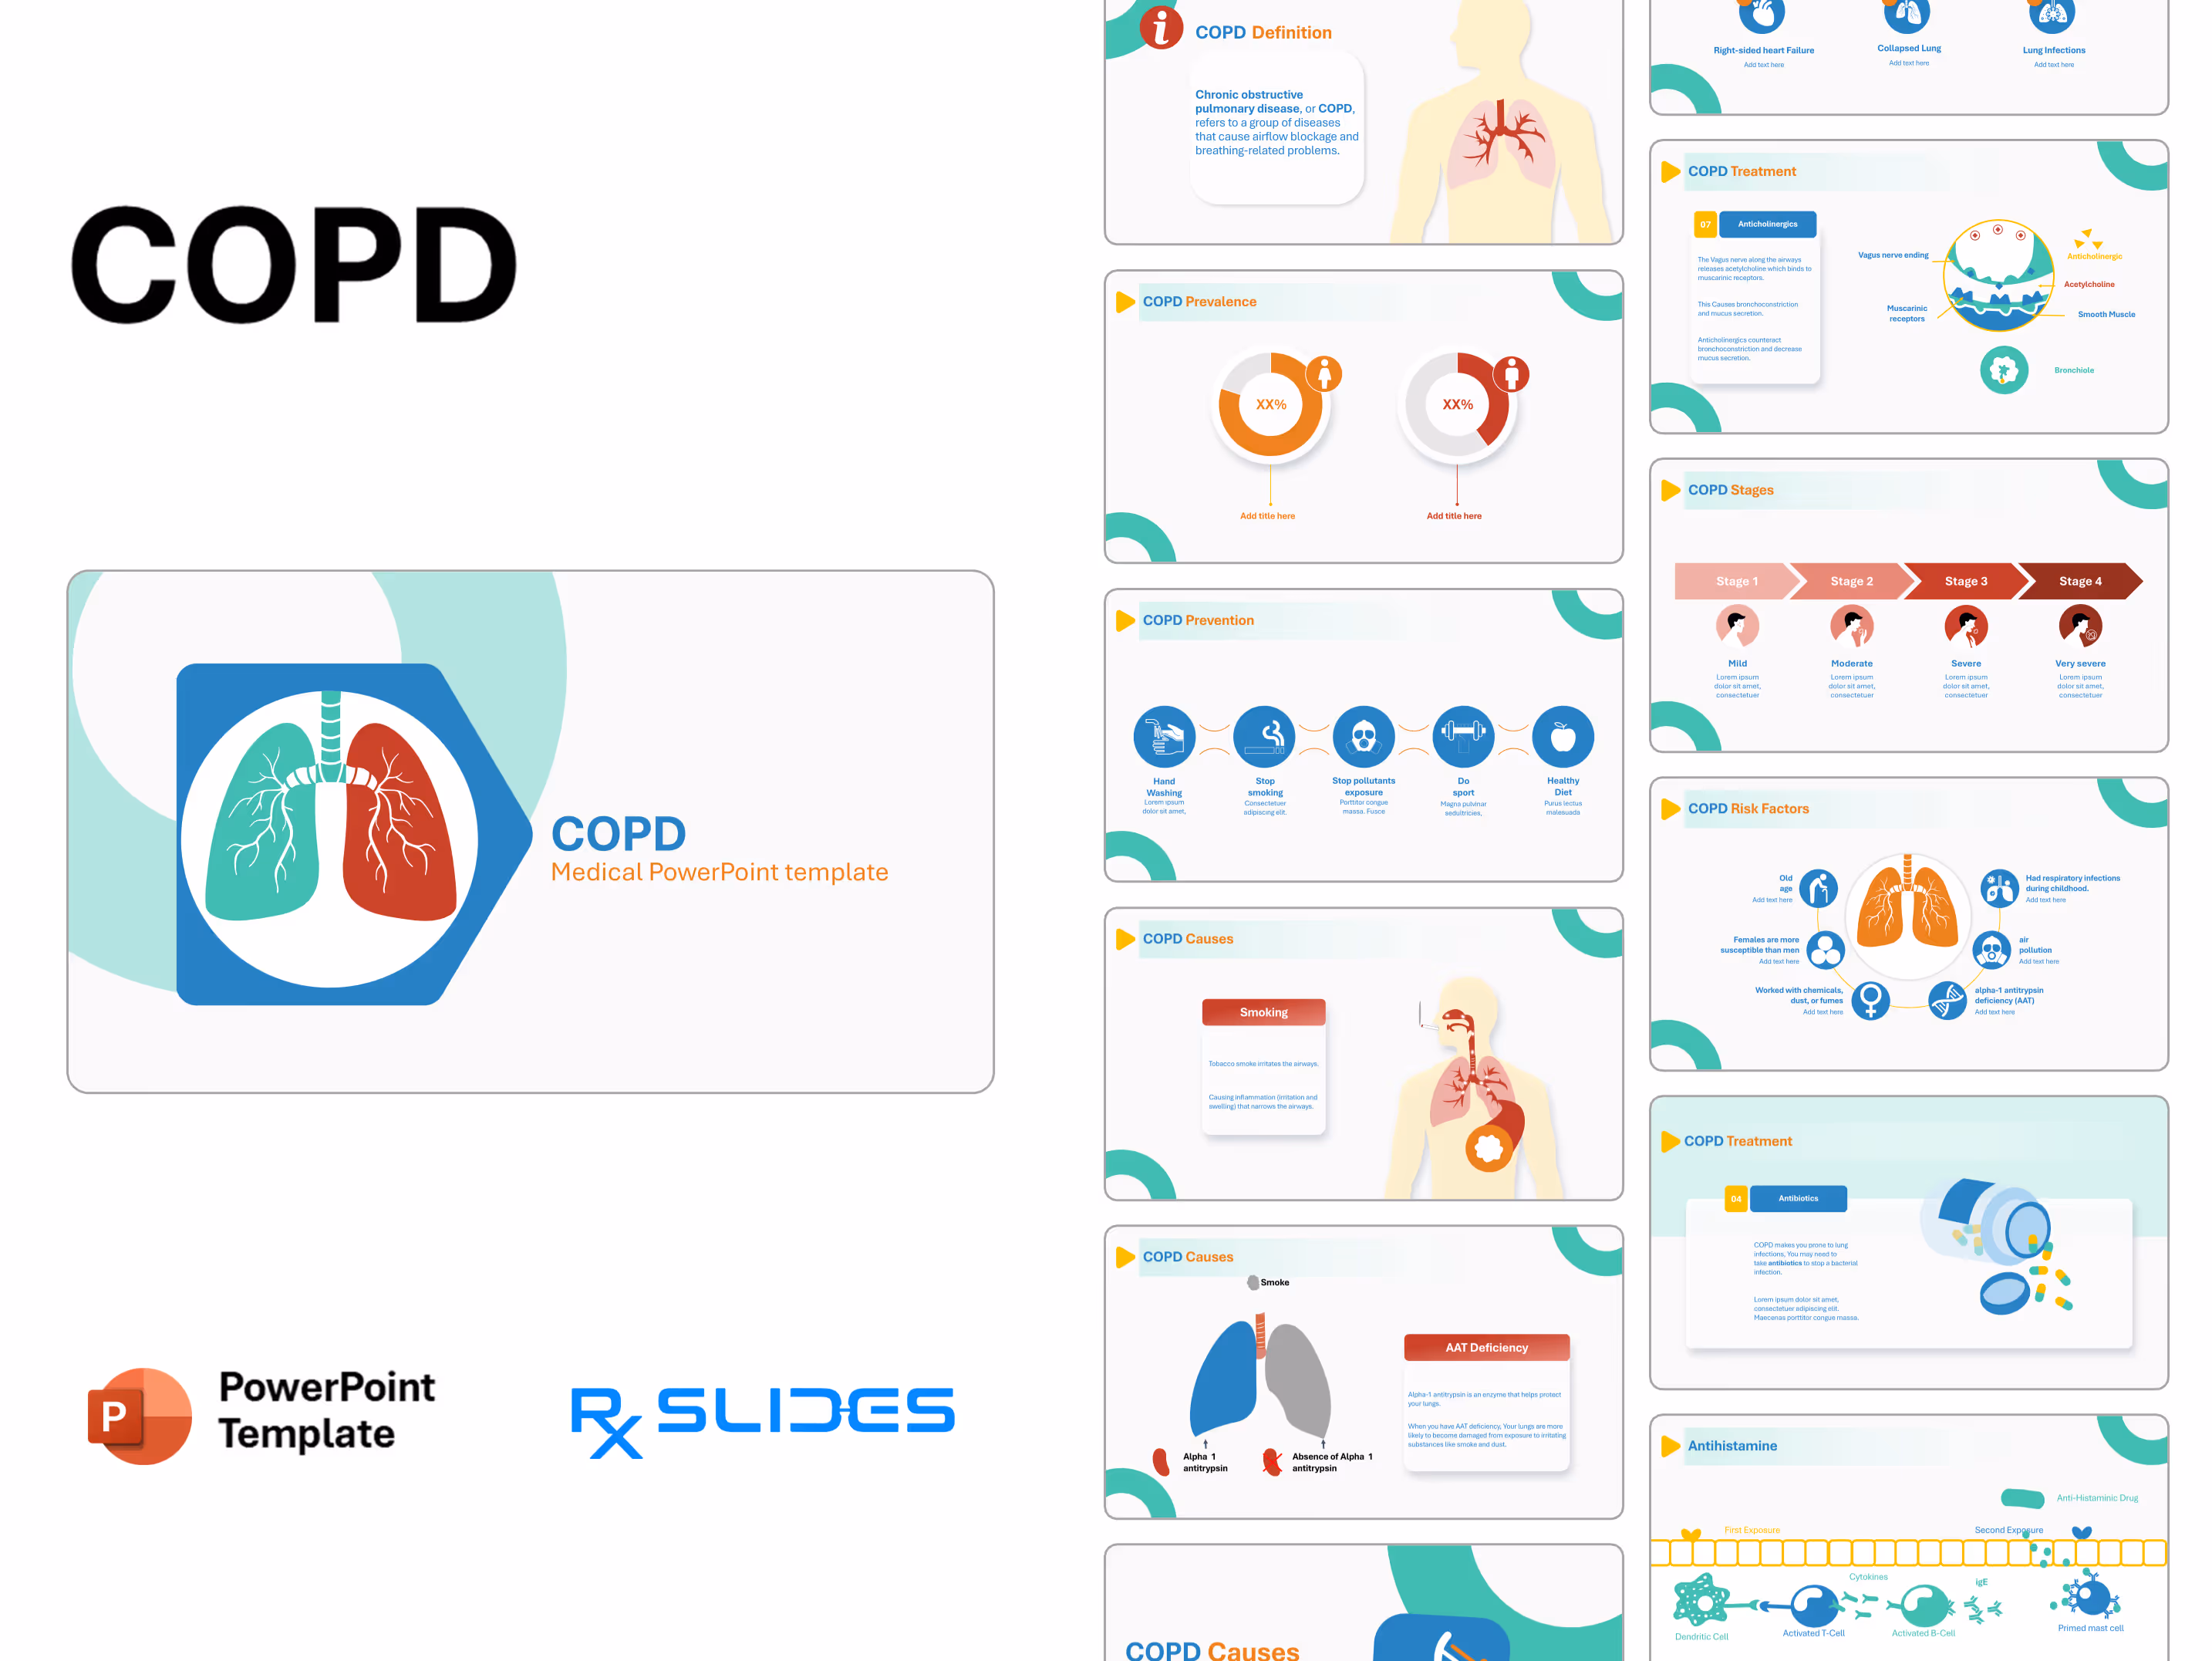
COPD PowerPoint Animated Template Preview
COPD PowerPoint Animated Template Content
Slide 1 - COPD (Title Slide)
.avif)
- Title slide featuring the abbreviation "COPD" prominently alongside a large, stylized illustration of the human lungs and trachea.
- The lungs are colored green and red, set within a hexagonal shape, immediately establishing the topic as a detailed respiratory or pulmonary medicine presentation.
Slide 2 - COPD (Agenda)
.avif)
- A clean, four-point agenda slide. The title "COPD Agenda" is centrally placed within a prominent teal/green circle on the left.
- On the right, there are four numbered (1, 2, 3, and 4) editable text boxes, allowing the presenter to clearly outline the main sections of the respiratory presentation (likely covering Definition, Causes, Symptoms, Diagnosis, or Treatment).
Slide 3 - COPD Definition
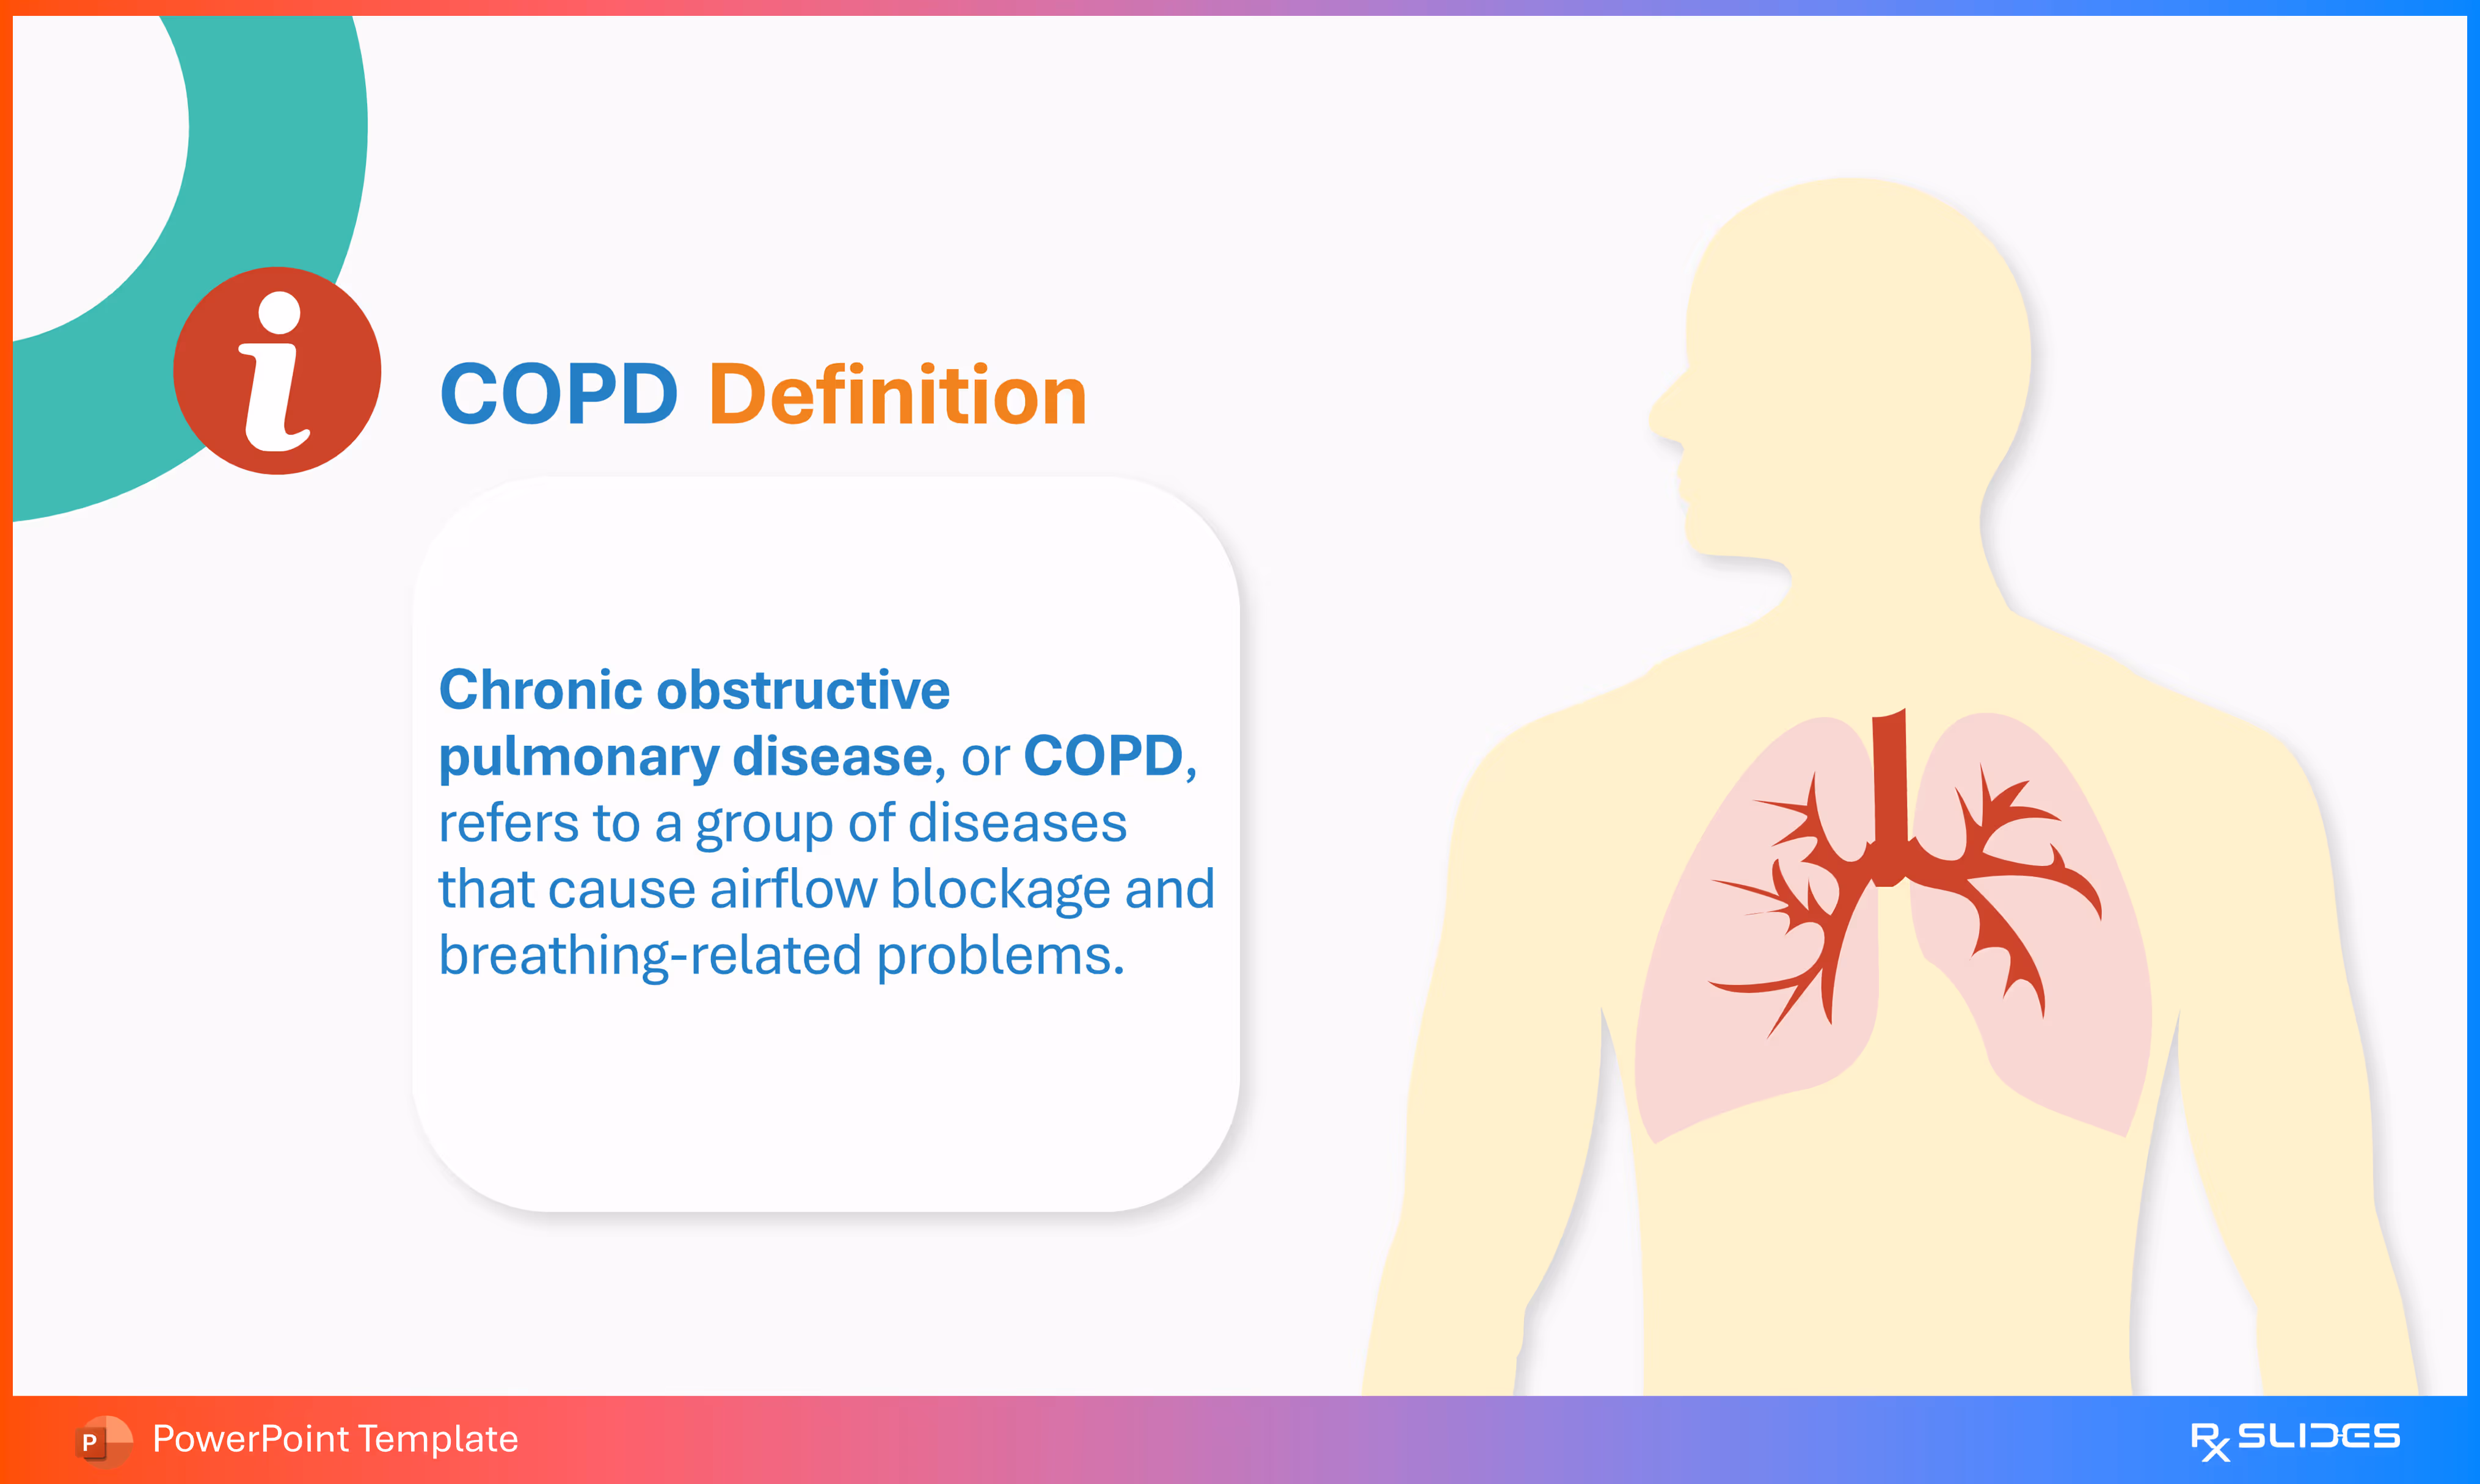
- Introductory slide defining the respiratory condition. Features a large, stylized diagram of a human silhouette with the lungs and respiratory tree highlighted in red.
- On the left, a text box begins with a medical information 'i' icon and states the definition: "Chronic obstructive pulmonary disease, or COPD, refers to a group of diseases that cause airflow blockage and breathing-related problems."
Slide 4 - COPD Prevalence (Section Divider)
.avif)
- Transitional slide introducing the Prevalence section, indicating a focus on statistics, epidemiology, or global burden of the disease.
- Features a prominent, large blue icon with a bar chart and an upward-trending arrow, visually representing growth or statistical data.
Slide 5 - COPD Prevalence (Gender Comparison)
.avif)
Comparative data slide illustrating the prevalence of COPD across genders using two distinct, colored doughnut charts:
- Female Prevalence: Shown in orange, with a pie chart indicating a percentage (XX%) next to a female icon.
- Male Prevalence: Shown in red, with a pie chart indicating a percentage (XX%) next to a male icon.
This slide is designed to highlight the epidemiological difference in COPD burden between male and female populations.
Slide 6 - COPD Prevalence (Infographic Data)
.avif)
A comparative infographic using icon charts to represent two key statistical points related to COPD prevalence (e.g., smoking status, severity level, or different demographic groups).
- Top Row (Green): Features an icon representing the lungs and trachea flowing into a sequence of six person icons for a specific group.
- Bottom Row (Orange): Features an icon of the respiratory tree with damaged/enlarged alveoli flowing into a sequence of person icons
Each row includes a placeholder for a title and descriptive text, making this slide ideal for presenting a clear, visual comparison of data.
Slide 7 - COPD Forms (Chronic Bronchitis & Emphysema)
.avif)
A comparative slide illustrating the two primary diseases that constitute COPD.
- Chronic Bronchitis: Featured on the left in orange and teal. The icon shows the lungs and bronchial tubes, with associated inflammation/damage icons (gears/cogs) to indicate chronic irritation of the airways.
- Emphysema: Featured on the right in red and teal. The icon shows the terminal end of the respiratory tree—the bronchioles and alveoli—with some alveoli appearing damaged (red/irregular) to illustrate the destruction of the air sacs.
This slide provides a clear visual differentiation between the two key pathological components of the disease.
Slide 8 - COPD Normal Mechanism of Lung
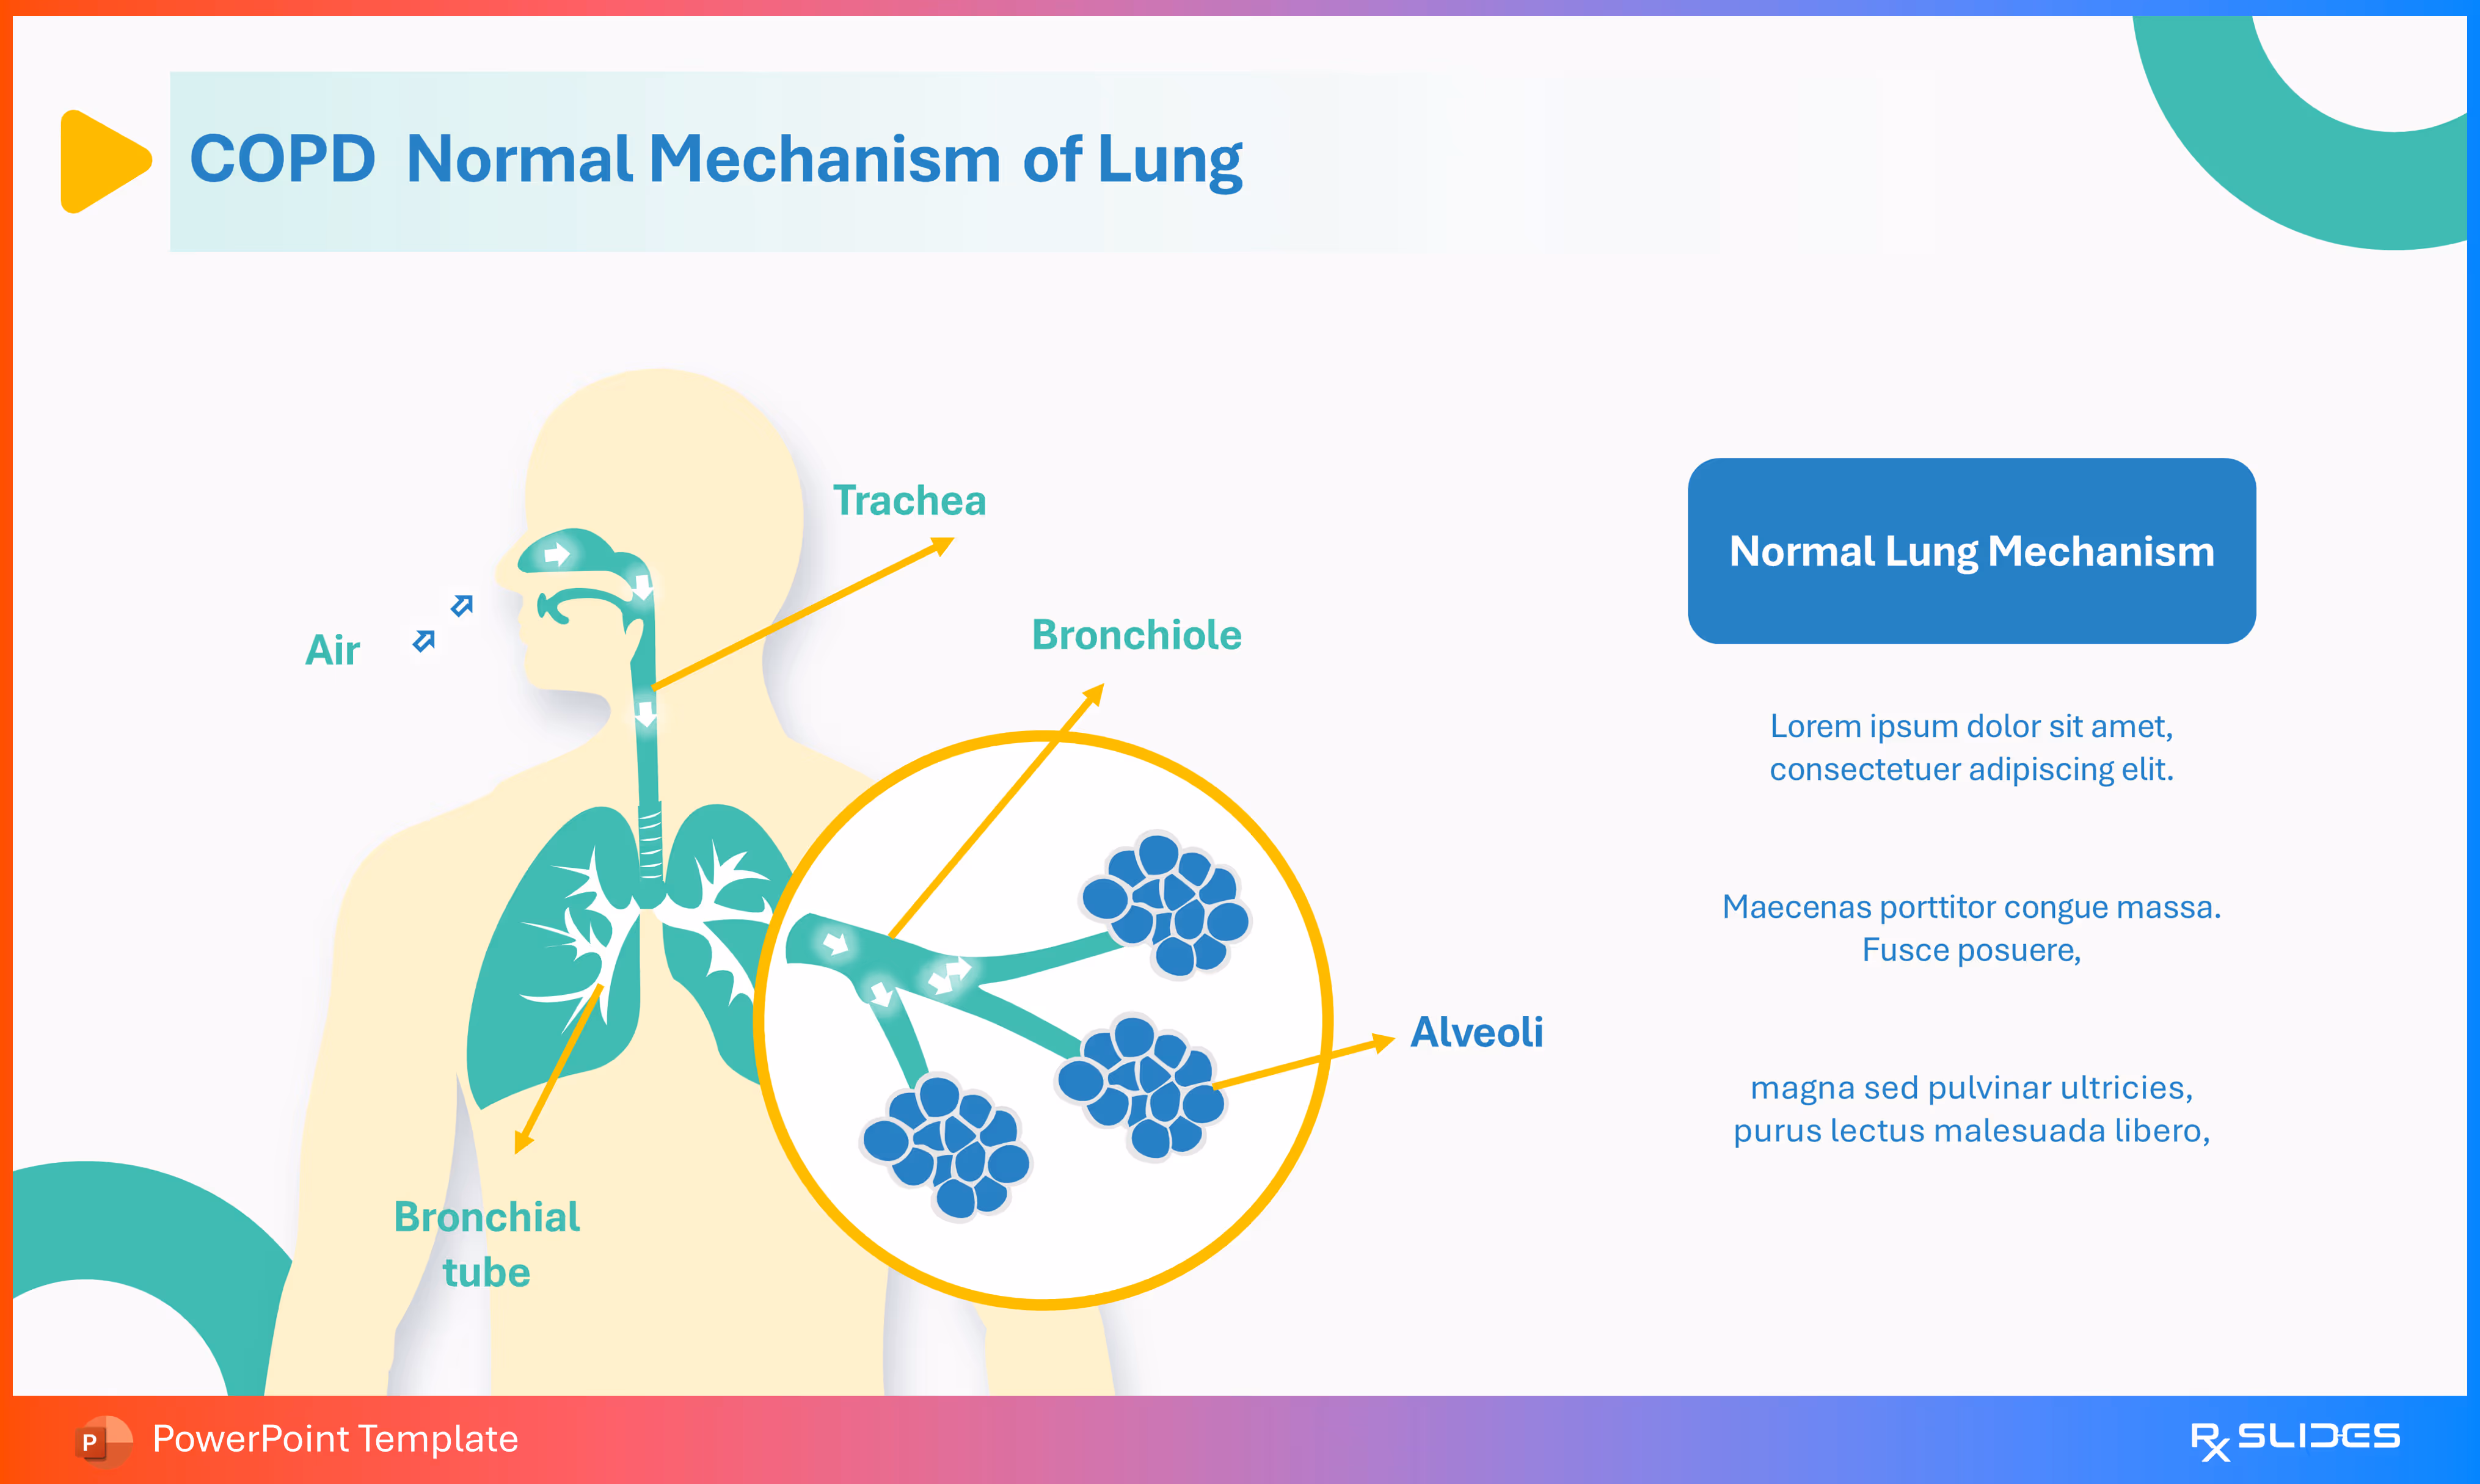
A detailed anatomical diagram illustrating the Normal Lung Mechanism, which serves as the healthy comparison for the pathological slides to follow.
The visual features a human silhouette highlighting the respiratory system and includes magnified views and labels for:
- Trachea
- Bronchiole
- Alveoli
- Bronchial tube
- Air flow
This slide is essential for establishing the baseline physiology before explaining the obstructed airflow characteristic of COPD.
Slide 9 - COPD Mechanism (Pathology)
.avif)
A detailed anatomical diagram illustrating the pathological changes that cause airflow limitation in COPD.
The visual features a human silhouette highlighting the respiratory system. The key focus is a magnified circular inset of a bronchial tube, clearly demonstrating:
- Inflammation (represented by red swelling)
- Excessive Mucus (indicated by the yellow substance)
- The difference between Normal Air flow and Limited Air flow (indicated by directional arrows).
This slide is essential for explaining the physiological process behind the airflow obstruction.
Slide 10 - COPD Risk Factors (Section Divider)
.avif)
- Transitional slide introducing the Risk Factors (or Causes) section.
- Features a prominent blue icon containing a warning sign (exclamation point within a triangle), visually signaling potential dangers, causes, or things to avoid related to the development of COPD.
Slide 11 - COPD Risk Factors (Detailed Overview)
.avif)
A comprehensive grid outlining several key risk factors for developing COPD.
The six points are arranged around the slide, each represented by a distinct icon:
- Exposed to air pollution: Features a gas mask icon.
- Worked with chemicals, dust, or fumes: Features a chemical structure icon (linked rings).
- Old Age: Features an icon of an elderly person with a cane.
- Had respiratory infections during childhood: Features an icon of lungs with snowflake/infection symbols.
- Females are more susceptible than men: Features the female (Venus) symbol.
- alpha-1 antitrypsin deficiency (AAT): Features a DNA double helix icon (indicating a genetic/hereditary risk).
Slide 12 - COPD Risk Factors (Circular Infographic)
.avif)
- A circular infographic summarizing the key risk factors for COPD.
- The layout arranges six icons around a central hub labeled "COPD Risk Factors." This provides a visually engaging summary of the previously detailed list
Slide 13 - COPD Risk Factors (Lungs Infographic)
.avif)
A central, organ-focused infographic summarizing the key risk factors for COPD.
The visual centerpiece is a large orange icon of the lungs, surrounded by six circular icons representing the risk factors, all connected by lines to the central image
Slide 14 - COPD Causes (Section Divider)
.avif)
- Transitional slide introducing the Causes (Etiology) section.
- Features a prominent blue icon containing a stylized DNA double helix, visually signaling the underlying factors, often including genetic components like alpha-1 antitrypsin deficiency (AAT), or the deep-rooted physical damage that results in the disease.
Slide 15 - COPD Causes (Four-Point Infographic)
.avif)
A four-point circular infographic detailing the key causes (or risk factors) of COPD.
The four circles are arranged in a central diamond pattern:
- Workplace dust (Icon of a cloud with white speckles, representing dust/fumes).
- AAT Deficiency (Icon of a DNA double helix, representing Alpha-1 Antitrypsin Deficiency, the genetic cause).
- Air pollution (Icon of a gas mask).
- Smoking (Icon of a cigarette with smoke, representing the most common cause).
Slide 16 - COPD Causes (Circular Infographic with Central Image)
.avif)
- A detailed infographic outlining four primary causes of COPD arranged around a central illustration of an obstructed airway.
- The visual center shows a magnified bronchial tube that is red and swollen, containing yellow matter (representing inflammation and mucus), which is characteristic of the disease pathology. The surrounding circles, connected by lines, detail the four key causes
Slide 17 - COPD Causes (Smoking Detail)
.avif)
A detailed slide focusing on Smoking as the primary cause of COPD.
The visual features a human silhouette highlighting the respiratory system and the damaging effects of tobacco smoke:
- Smoking Icon: An inserted image shows smoke being inhaled through the mouth.
- Pathology Detail: A magnified view of a bronchial tube shows inflammation and narrowing of the airways due to chronic irritation.
Explain that "Tobacco smoke irritates the airways," causing inflammation and swelling that "narrows the airways."
Slide 18 - COPD Causes (Normal Airway Epithelium)
.avif)
A micro-anatomical slide illustrating the Normal cellular mechanism of the airway epithelium, providing a baseline for comparison with damaged tissue.
The detailed diagram shows:
- Motile Cilia: Hair-like projections on the surface of the cells.
- Mucus: A layer of fluid on top of the cilia.
- Cellular Junction: The connection points between the epithelial cells (likely ciliated and goblet cells).
The key function is the coordinated movement of the cilia to clear the mucus layer, maintaining a healthy, clear airway. This section is essential before illustrating how COPD causes these structures to fail.
Slide 19 - COPD Causes (Smoking Damage to Cilia)
.avif)
A micro-anatomical slide illustrating the damage caused by smoking that contributes to COPD. This visual contrasts with the "Normal" view (Slide 18).
- Damaged Cilia: The diagram shows Motile Cillia that are damaged (bent, broken, or absent), impairing their function.
- Excess Mucus: The text explains that smoke "also damages cilia," meaning "they can't remove mucus and trapped particles from the airways."
- Irritants: Icons of viruses/bacteria (blue circles with spikes) and a cigarette/smoke plume are shown entering the airway, contributing to damage and trapped particles.
This slide explains how smoking leads to poor mucus clearance, a hallmark of chronic bronchitis.
Slide 20 - COPD Causes (Cellular Pathophysiology Detail)
.avif)
A micro-anatomical slide illustrating the advanced cellular pathology resulting from Smoking, emphasizing multiple points of damage characteristic of COPD (chronic bronchitis). This visual expands on the previous slide (Slide 19).
- Motile ciliary disorder: The cilia on the cells are shown damaged and ineffective, surrounded by smoke.
- Mucus hypersecretion: An excessive amount of yellow particles (mucus) is shown accumulating on and around the cells.
- Tight Junctions disruption: The connections between the epithelial cells are labeled as disrupted, indicating increased permeability or cell damage.
- Smoking Context: The accompanying text links the damage to smoking: "Smoke also damages cilia. So they can't remove mucus and trapped particles from the airways."
Slide 21 - COPD Causes (AAT Deficiency Detail)
.avif)
- The illustration shows one healthy lung (blue) with an AAT molecule/icon present, and another lung (gray/damaged) with a red 'X' over where the AAT molecule should be, indicating its absence.
- The accompanying text defines the condition: "Alpha-1 antitrypsin is an enzyme that helps protect your lungs."
- It explains that without it, "Your lungs are more likely to become damaged from exposure to irritating substances like smoke and dust."
- The presence of a smoke plume in the background visually links this genetic deficiency to environmental triggers.
Slide 22 - COPD Stages (Section Divider)
.avif)
- Transitional slide introducing the Stages or severity section of COPD.
- Features a prominent blue icon containing an orange circle with a stylized bronchial tube showing obstruction and inflammation (represented by the white, cloud-like mucus), visually signaling a focus on disease progression and severity classifications.
Slide 23 - COPD Stages (Severity Infographic)
.avif)
A four-stage severity infographic detailing the progression of COPD, generally following the GOLD (Global Initiative for Chronic Obstructive Lung Disease) classification system. Each stage is represented by a separate box with an icon of a person experiencing difficulty breathing, progressively worsening across the stages:
- Stage 1: Mild (Icon of a person with mild respiratory distress).
- Stage 2: Moderate (Icon of a person with more obvious respiratory distress, possibly coughing/throat clearing).
- Stage 3: Severe (Icon of a person with significant breathing difficulty, hand to throat/chest).
- Stage 4: Very severe (Icon of a person with critical respiratory failure, often with a 'No' symbol over the activity, indicating severe limitation).
Slide 24 - COPD Stages (Linear Progression Infographic)
.avif)
- A linear progression infographic detailing the four stages of COPD, using a horizontal arrow graphic to emphasize disease worsening over time.
- This is an alternative to the previous column-based view (Slide 23).
Slide 25 - COPD Symptoms (Section Divider)
.avif)
- Transitional slide introducing the Symptoms (Clinical Manifestations) section.
- Features a prominent blue icon containing a white silhouette of a person's profile with orange particles being expelled from the mouth/nose, visually signaling coughing, phlegm, or breathing difficulty—the common signs of COPD.
Slide 26 - COPD Symptoms (Linear Infographic)
.avif)
- A linear infographic detailing a sequence of six key symptoms or complications of COPD, arranged along a horizontal blue timeline/chain graphic:
- Heart Failure at Later Stage (Icon of a human heart).
- Breathless (Icon of human lungs).
- Weight Loss (Icon of a foot/scale with a minus sign).
- Wheezing (Icon of a head with sound waves coming from the mouth/nose).
- Mucus Production (Icon of splatter/snowflake-like particles).
- Cough (Icon of a head with cough particles being expelled).
Slide 27 - COPD Complications (Section Divider)
.avif)
- Transitional slide introducing the Complications (Adverse Outcomes) section.
- Features a prominent blue icon containing a stylized illustration of a muscle (likely the diaphragm or another respiratory muscle) with lightning bolts/shockwaves emanating from it.
- This visually signals muscle strain, respiratory failure, or other severe adverse effects that result from chronic breathing difficulty.
Slide 28 - COPD Complications (Six-Point Grid)
.avif)
- A comprehensive six-point grid detailing the most common and severe complications of chronic obstructive pulmonary disease.
- Each complication is represented by a distinct icon in a blue circle:
- Anemia (Icon of a blood drop).
- Muscle Weakness (Icon of a muscle with lightning bolts).
- Bone Thinning (Icon of a bone).
- Right-sided Heart Failure (Icon of a human heart).
- Collapsed Lung (Icon of a lung with a central depression).
- Lung Infections (Icon of a lung with snowflake/infection symbols).
Slide 29 - COPD History (Clinical Questions Infographic)
.avif)
A unique, diagnostic infographic visually representing the key questions a clinician asks a patient when taking a history for suspected COPD.
The questions are arranged along a winding path ( representing a stethoscope's tubing):
- Visual Centerpiece of a stethoscope icon on the far left.
- Six Key Questions/Points:
- Have you had long-term exposure to dust or air pollutants? (Icon of a house with a chimney and smoke).
- Do you smoke? (Icon of a cigarette with smoke).
- Do you get short of breath with exercise? When resting? (Icon of a person bent over, struggling to breathe/tired).
- Do other members of your family have COPD? (Icon of a family/group of people).
- Have you been coughing or wheezing for a long time? (Icon of a person's head with expelled cough particles).
- Do you cough up phlegm? (Icon of mucus/splatter).
Slide 30 - COPD History (Clipboard Infographic)
.avif)
- An alternative, centralized infographic focusing on the key questions a clinician asks when taking a history for suspected COPD.
Slide 31 - COPD Diagnosis (Section Divider)
.avif)
- Transitional slide introducing the Diagnosis section.
- Features a prominent blue icon containing a stylized illustration of a medical imaging machine (likely a CT or MRI scanner).
- This visually signals a focus on diagnostic tests, including spirometry, chest X-rays, or CT scans, used to confirm the presence and severity of COPD.
Slide 32 - COPD Diagnosis (Spirometry)
.avif)
A detailed slide focusing on Spirometry, the primary diagnostic test for COPD. The visual features an illustration of a patient using a spirometry device:
- A person is shown exhaling into the device, which is connected to a monitor displaying a waveform (representing lung function/air flow).
- A dedicated text box is labeled "Spirometry" to explain the procedure, its importance, and likely the criteria for diagnosing COPD (e.g., reduced FEV1/FVC ratio).
Slide 33 - COPD Diagnosis (Pulse Oximetry)
.avif)
A detailed slide focusing on Pulse Oximetry, another common diagnostic and monitoring tool for COPD. The visual features an illustration of a pulse oximeter device displaying a numerical reading (e.g., SpO2 92% and pulse 86 bpm):
- A clear, stylized image of the electronic device with its screen displaying readings.
- A dedicated text box is labeled "Pulse oximetry" to explain the procedure, its role in measuring oxygen saturation, and its utility in monitoring acute exacerbations or long-term disease management.
Slide 34 - COPD Diagnosis (Arterial Blood Gases - ABGs)
.avif)
A detailed slide focusing on Arterial Blood Gases (ABGs), a critical diagnostic and monitoring test for severe COPD and respiratory failure.
- The visual features a close-up illustration of a forearm with a syringe being inserted to draw arterial blood (typically from the radial artery).
- A dedicated text box is labeled "Arterial blood gases (ABGs)" to explain the procedure and its importance in measuring blood pH, partial pressures of oxygen (PaO2), and carbon dioxide (PaCO2), which are essential for assessing gas exchange and respiratory status in advanced COPD.
Slide 35 - COPD Diagnosis (Electrocardiogram - ECG or EKG)
.avif)
A detailed slide focusing on the Electrocardiogram (ECG or EKG), often used in COPD patients to evaluate related cardiac complications like Right-Sided Heart Failure (Cor Pulmonale).
- The visual features an illustration of a patient lying on an examination table with ECG leads attached to their chest and limbs. A nearby monitor displays a waveform (representing heart activity).
- A dedicated text box is labeled "Electrocardiogram (ECG or EKG)" to explain the procedure and its role in assessing the heart's function and rhythm, which can be impacted by chronic lung disease.
Slide 36 - COPD Treatment (Section Divider)
.avif)
- Transitional slide introducing the Treatment (Management) section.
- Features a prominent blue icon containing a stylized illustration of an inhaler dispensing medication (indicated by the small orange particles).
- This visually signals a focus on pharmacological management, specifically bronchodilators, which are a cornerstone of COPD therapy.
Slide 37 - COPD Diagnosis (Imaging - X-ray and CT-Scan)
.avif)
A comparative slide detailing the use of Medical Imaging in the diagnosis and assessment of COPD, featuring two distinct images:
- X-ray: The visual features an X-ray image of the human rib cage and lungs, representing the use of plain film radiography to check for signs of hyperinflation or other conditions like pneumonia.
- CT-Scan: The visual features a stylized icon of a CT (Computed Tomography) scanner, representing the use of more advanced imaging to detect emphysematous changes or rule out other lung diseases.
Slide 38 - COPD Treatment (Bronchodilators)
.avif)
A detailed slide focusing on the first line of pharmacological management: Bronchodilators.
- The visual centerpiece is a large, stylized illustration of a metered-dose inhaler (MDI), the device used to deliver bronchodilator medication directly to the lungs.
- A dedicated section is labeled "Bronchodilators", indicating this is the first item in the treatment plan.
- The accompanying text explains the general function of this class of drugs—to relax the muscles around the airways and open them up, making breathing easier.
Slide 39 - COPD Treatment (Anti-inflammatory Medications)
.avif)
A detailed slide focusing on the second line of pharmacological management: Anti-inflammatory Medications (typically corticosteroids).
- A human silhouette highlighting the lungs in red, which visually grounds the treatment to the affected organ and inflammation.
- Two Treatment Icons:
- Steroid Inhalers: An icon representing an inhaler, indicating localized, inhaled therapy.
- Steroid Pill: An icon representing a pill bottle and tablet, indicating systemic, oral therapy (often reserved for severe cases or exacerbations).
- A dedicated section is labeled "Anti-inflammatory medications", indicating this is the second item in the treatment plan. The accompanying text explains the role of these medications in reducing inflammation and swelling in the airways.
Slide 40 - COPD Treatment (Supplemental Oxygen)
.avif)
A detailed slide focusing on the third key component of COPD management: Supplemental Oxygen therapy.
- The visual centerpiece is a close-up illustration of a patient wearing an oxygen mask (or nasal cannula), visually representing the delivery of oxygen.
- A dedicated section is labeled "Supplemental Oxygen", indicating this as the third main treatment item.
- The accompanying text explains the necessity of this therapy: "If blood oxygen is low hypoxemia you may need a portable oxygen tank to improve your oxygen levels."
Slide 41 - COPD Treatment (Antibiotics)
.avif)
A detailed slide focusing on the use of Antibiotics to treat acute lung infections associated with COPD exacerbations.
- The visual centerpiece is an illustration of a medicine bottle tipped over with capsules spilling out, representing oral antibiotic medication.
- A dedicated section is labeled "Antibiotics", indicating this is the fourth main treatment item.
- The accompanying text explains the rationale: "COPD makes you prone to lung infections. You may need to take antibiotics to stop a bacterial infection."
Slide 42 - COPD Treatment (Vaccinations)
.avif)
A detailed slide focusing on Vaccinations as a crucial preventive measure in COPD management.
- Vaccination Visual: The visual centerpiece is a stylized illustration of a syringe and a medication vial, representing the administration of a vaccine.
- A dedicated section is labeled "Vaccinations", indicating this is the fifth treatment item. The accompanying text explains the rationale: "It's important to get shots to prevent flu and pneumonia. Respiratory infections are more dangerous when you have COPD."
Slide 43 - COPD Treatment (Rehabilitation)
.avif)
A detailed slide focusing on Rehabilitation programs as a critical non-pharmacological component of COPD management.
- Rehabilitation Visual: The visual centerpiece is an illustration of a person being pushed in a wheelchair by a caregiver (or therapist). This represents the support and assistance needed for chronic illness management and mobility issues.
- A dedicated section is labeled "Rehabilitation", indicating this is the sixth treatment category.
- The accompanying text explains the benefits: "Rehabilitation programs teach effective breathing strategies to lessen shortness of breath and conditioning."
Slide 44 - COPD Treatment (Anticholinergics Mechanism)
.avif)
A molecular-level slide detailing the mechanism of action for Anticholinergics, a type of bronchodilator used in COPD treatment.
- Mechanism Visual: The visual centerpiece is a magnified diagram of a synapse or junction within the airway, showing:
- Vagus nerve ending releasing Acetylcholine.
- Muscarinic receptors on the Smooth Muscle layer of the airway.
- Anticholinergic molecules blocking the acetylcholine from binding.
- The section is labeled "Anticholinergics". The text explains the action:
- "The Vagus nerve ending releases acetylcholine which binds to muscarinic receptors."
- "This Causes bronchoconstriction and mucus secretion."
- "Anticholinergics counteract bronchoconstriction and decrease mucus secretion."
Slide 45 - COPD Treatment (Leukotriene Modifiers Mechanism)
.avif)
A molecular-level slide detailing the mechanism of action for Leukotriene Modifiers, another class of anti-inflammatory medication used in COPD (and asthma) treatment.
- Mechanism Visual: The visual centerpiece is a magnified diagram of an immune/inflammatory response within the airway, showing:
- Allergens activating Mast Cells.
- The Mast Cell releasing Cysteinyl Leukotrienes (inflammatory mediators).
- Leukotriene Modifiers (represented by small blue blocks) acting in the area of the Bronchiole to counteract the effects that cause Mucus secretion and bronchoconstriction.
- A dedicated section is labeled "Leukotriene modifiers". The text explains the action:
- "When mast cells become sensitized it releases inflammatory mediators as leukotrienes."
- "They act on cystine receptors present in respiratory tract, causing Bronchoconstriction and mucus secretions."
- "Leukotriene Modifiers counteract those effects causing bronchodilation and decreasing mucus secretion."
Slide 46 - COPD Treatment (Expectorants Mechanism)
.avif)
A micro-anatomical slide detailing the mechanism of action for Expectorants, a class of drug used to manage excessive and viscous mucus secretions in COPD (chronic bronchitis).
- Mechanism Visual: The visual centerpiece is a magnified diagram of the respiratory epithelium, showing:
- Mucociliary cells (likely ciliated cells and goblet cells) forming the lining.
- Layers of Viscous mucus and Watery mucous on the surface.
- The effect of the expectorant leading to Watery Excretions (fluid release) to thin the mucus.
- A dedicated section is labeled "Expectorants". The text explains the action:
- "Expectorants reduce the viscosity of tenacious secretions by irritating the gastric vagal receptors that stimulate respiratory tract fluid."
- "thus increasing the volume but decreasing the viscosity of respiratory tract secretions."
Slide 47 - Antihistamine Mechanism
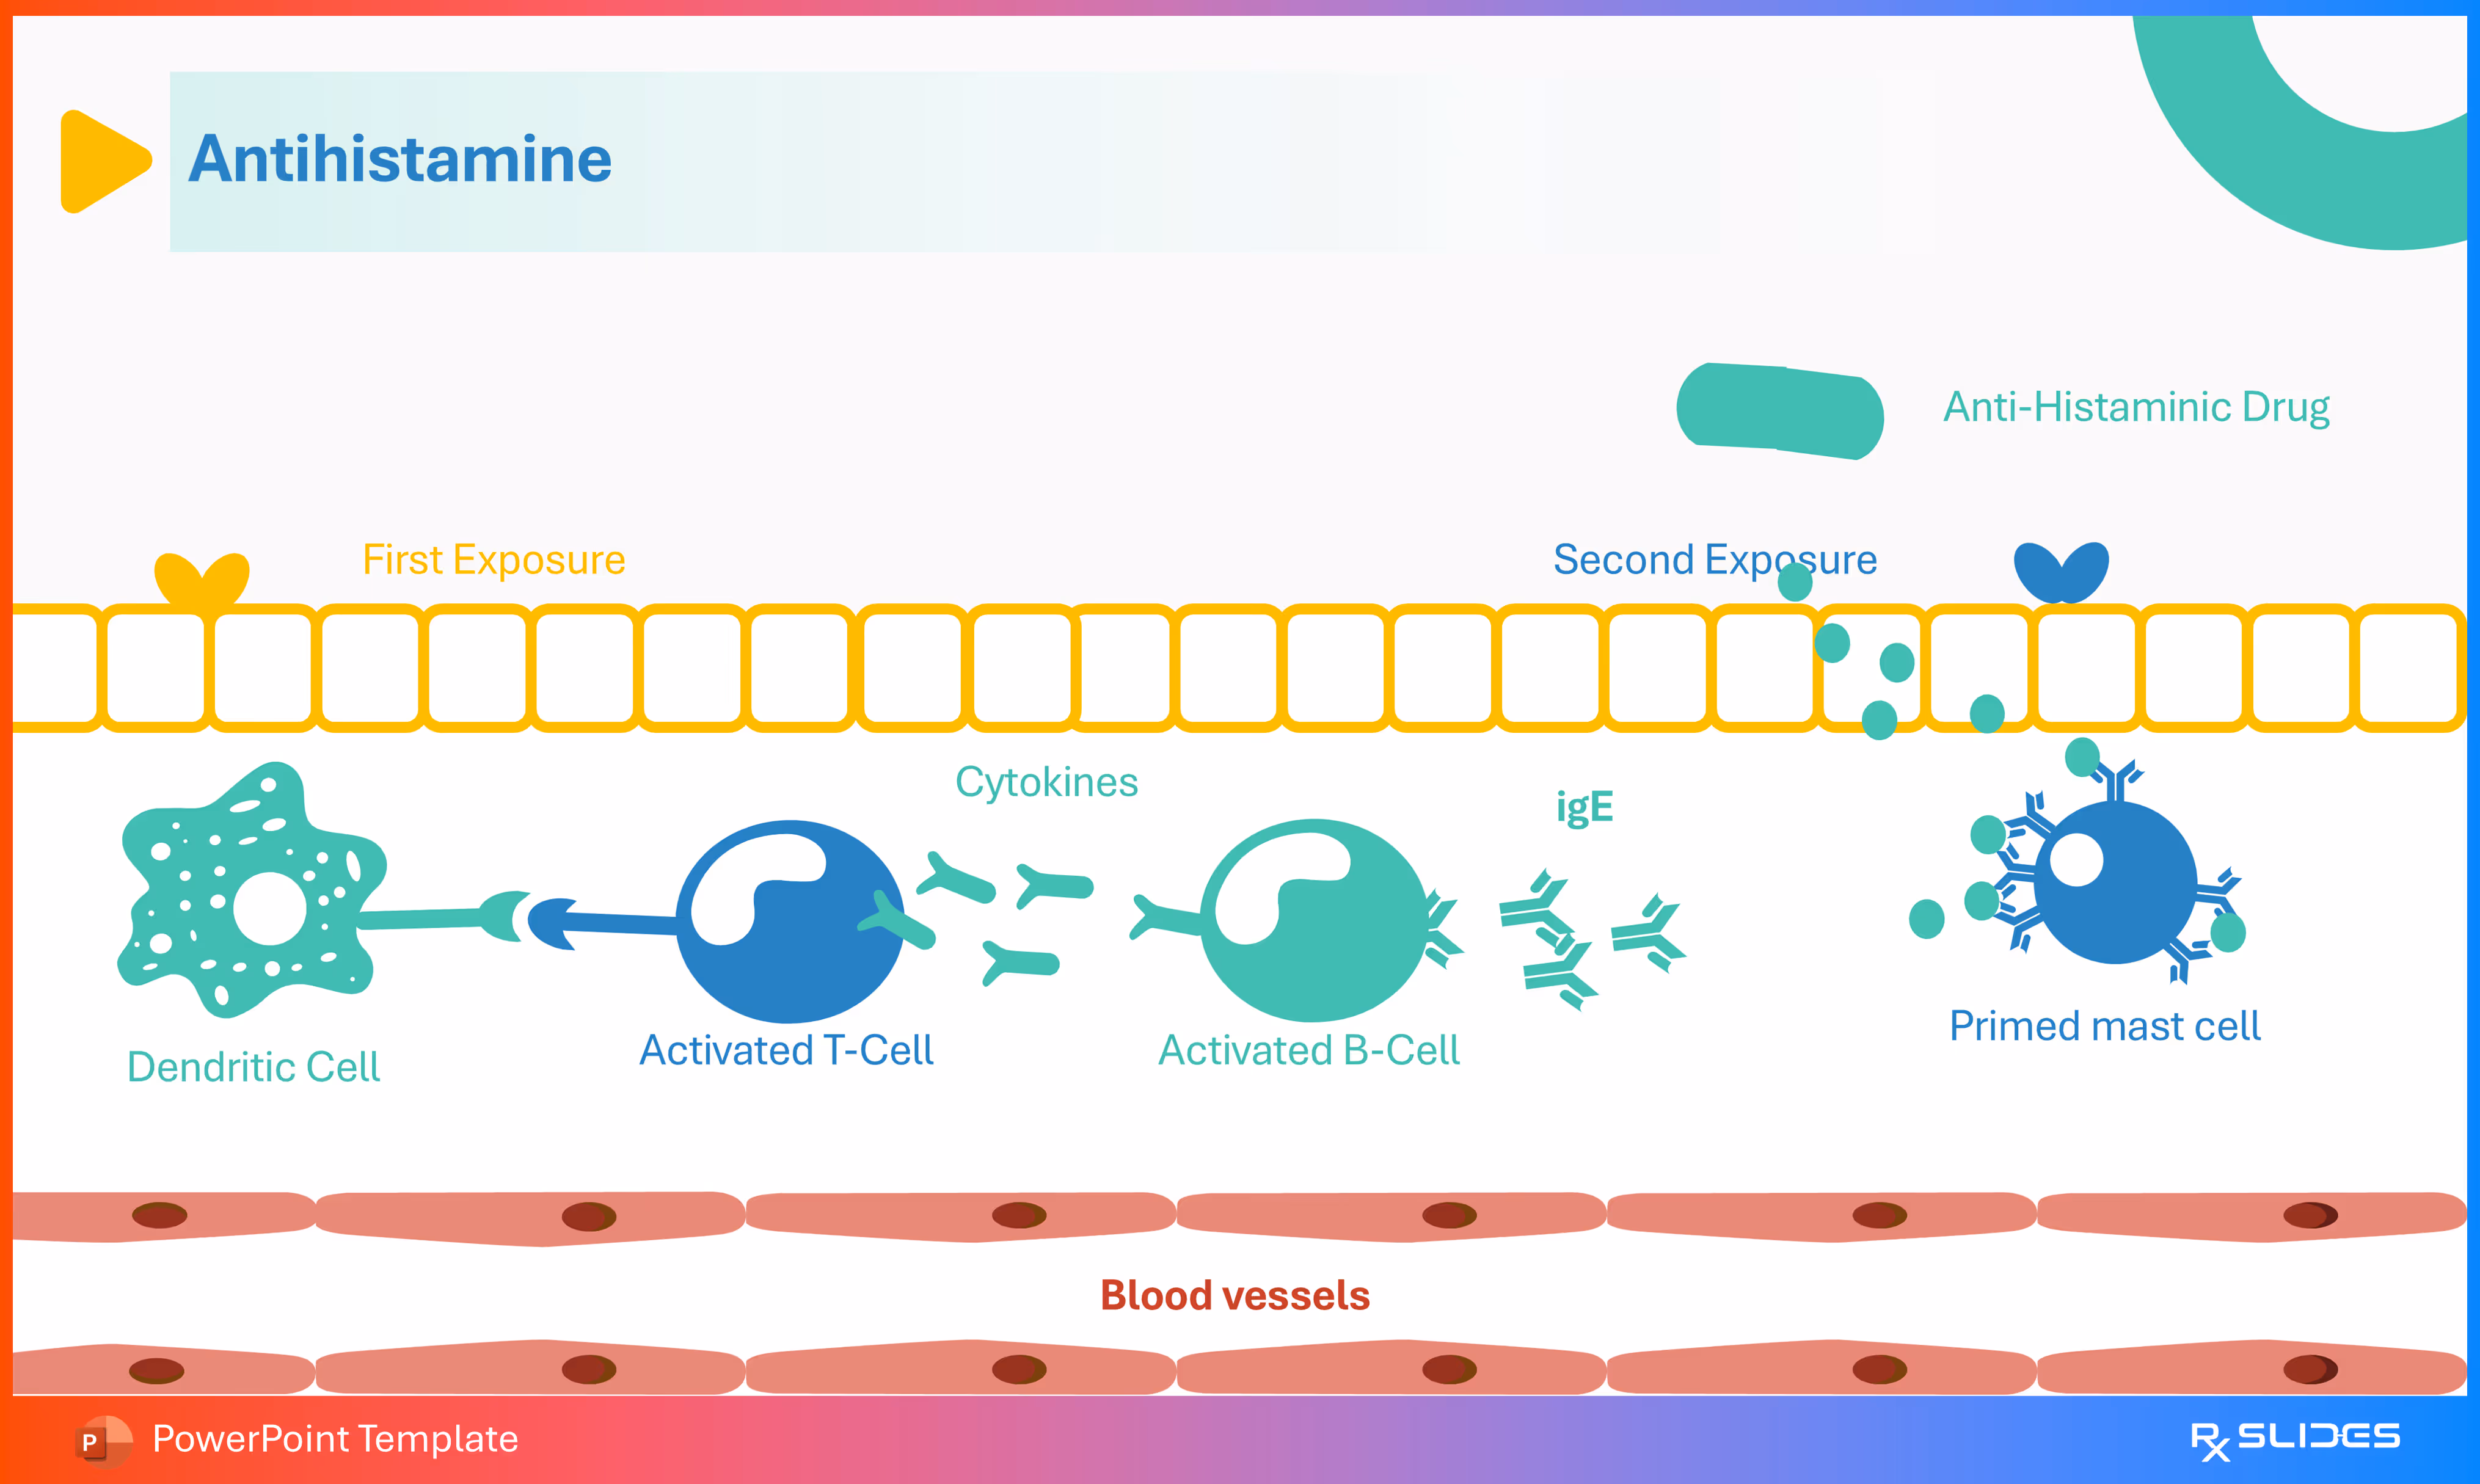
A molecular-level slide detailing the mechanism of the Type 1 Hypersensitivity reaction (allergic response) and how Antihistamines work to block this reaction.
- Mechanism Visual: The complex diagram illustrates the two stages of the immune response:
- First Exposure: A foreign substance is processed by the Dendritic Cell, which activates a T-Cell. The Activated T-Cell then activates an Activated B-Cell, which produces IgE antibodies. The IgE binds to the Mast Cell, making it a Primed Mast Cell.
- Second Exposure: The foreign substance binds to the IgE on the Primed Mast Cell, causing it to degranulate and release inflammatory mediators (like histamine).
- Antihistaminic Drug: A stylized molecule is shown blocking the effect of the mediator on the target cell.
- The slide title "Antihistamine" clearly identifies the drug class and its mechanism is illustrated by the labeled components: Dendritic Cell, Activated T-Cell, Activated B-Cell, Cytokines, IgE, Primed mast cell, and Blood vessels.
Slide 48 - COPD Prevention (Section Divider)
.avif)
- Transitional slide introducing the Prevention section.
- Features a prominent blue icon containing a stylized illustration of a cigarette with a 'No' symbol through it.
- This visually signals a focus on eliminating the primary preventable risk factor: smoking.
Slide 49 - COPD Prevention (Five-Point Action Plan)
.avif)
A linear infographic detailing five key actions for preventing COPD or slowing its progression, arranged along a chain/timeline graphic:
- Hand Washing (Icon of hands under water/soap).
- Stop smoking (Icon of a smoking cigarette).
- Stop pollutants exposure (Icon of a gas mask).
- Do sport (Icon of a dumbbell).
- Healthy Diet (Icon of an apple).
This slide provides a clear, actionable guide for preventative measures and lifestyle modifications crucial for COPD management.
Slide 50 - COPD Prevention (Alternative Five-Point Action Plan)
.avif)
- An alternative infographic layout detailing five key actions for preventing COPD or slowing its progression.
- This version uses a diamond-shaped flow with icons centered in white diamond shapes bordered by blue shadow
Slide 51 - Thank You (Conclusion)
.avif)
- The concluding slide for the entire presentation, featuring a thank you message and a relevant medical graphic.
- A prominent icon of human lungs (one side red, one side blue, depicting the bronchial tree) is shown next to the text.
- This visually reinforces the central theme of the COPD presentation.
Features of the Template
- 100% editable PowerPoint template.
- Editable colors, you can change according to your presentation style and company branding guidelines.