Acute kidney Injury PowerPoint Template
No items found.
Acute Kidney Injury PowerPoint: Animated Medical Template
- Deliver expert, clear, and engaging presentations on Acute Kidney Injury (AKI) with this editable animated PowerPoint template.
- Designed for nephrologists and medical educators, this 45-slide deck covers all clinical scopes of AKI, including causes, diagnosis, treatment options, complications, and prevention strategies.
- Enhance your lectures and case presentations with professionally designed visuals optimized for medical training and academic use.
- For additional urinary-related templates, feel free to explore our dedicated Urinary category.
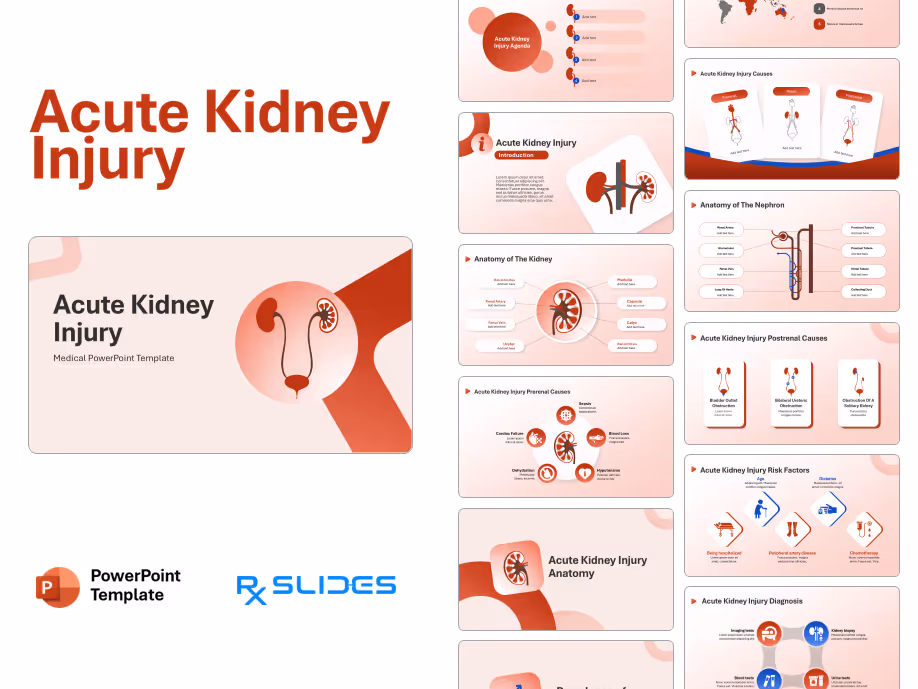
Acute Kidney Injury PowerPoint Template Content
Slide 1: Title Slide

- A visually appealing cover slide introducing your acute kidney injury presentation.
- Its professional layout is perfect for both clinical and academic audiences.
Slide 2: Agenda – Topics in Acute Kidney Injury

- This agenda provides a structured visual guide to the presentation's key content areas: causes, symptoms, pathophysiology, diagnosis, and treatment, keeping your audience engaged from start to finish.
Slide 3: Introduction to AKI – Section Slide

- Provides a high-level overview of acute kidney injury, suitable for setting the clinical stage or beginning a case presentation on AKI.
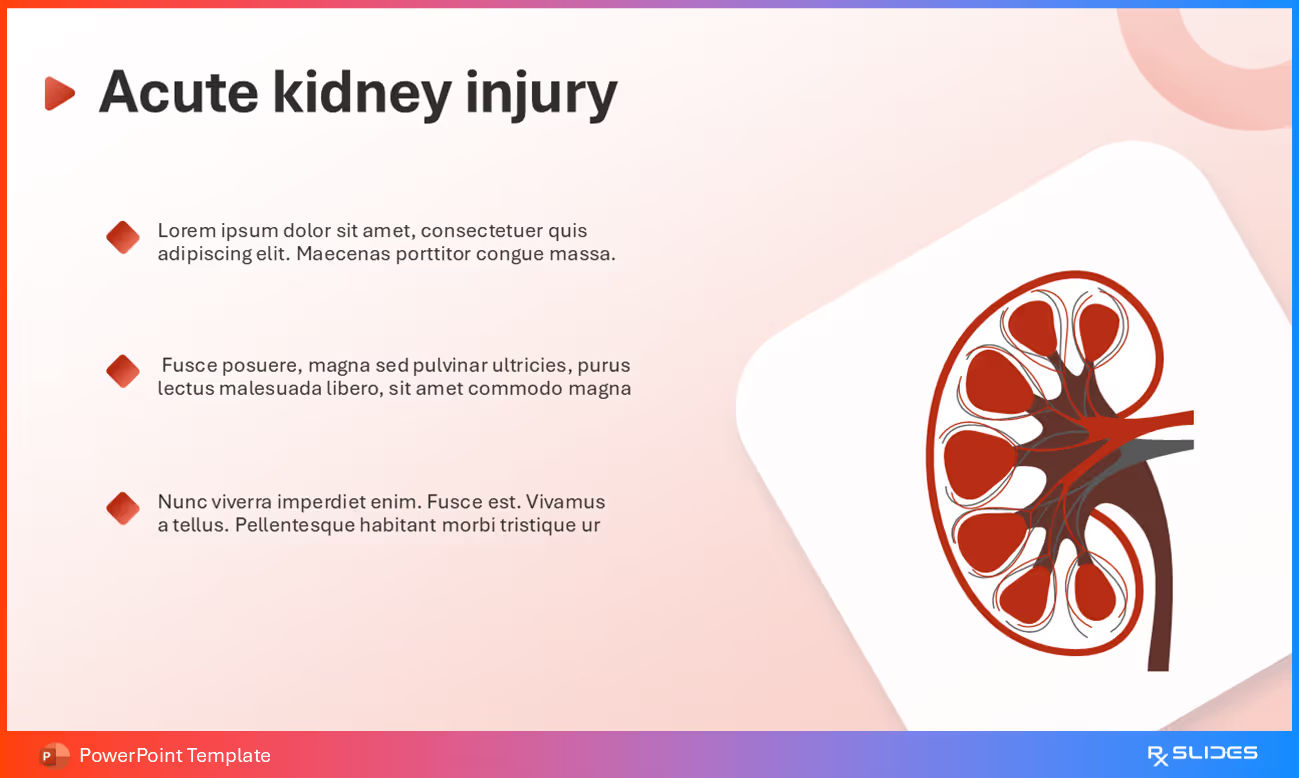
Slide 4: AKI Introduction

- Change the dummy text to include your AKI definition or introduction with the right medical illustration for both kidneys.
Slide 5: Acute Kidney Injury Facts
- Insert data related to AKI into this editable slide, where the colors can be easily changed to match your theme.
Slide 6: Prevalence of Acute Kidney Injury: Section Slide
- This section header marks the start of AKI prevalence data. Use it to smoothly transition into epidemiology, gender distribution, or global AKI trends with a consistent, professional look.
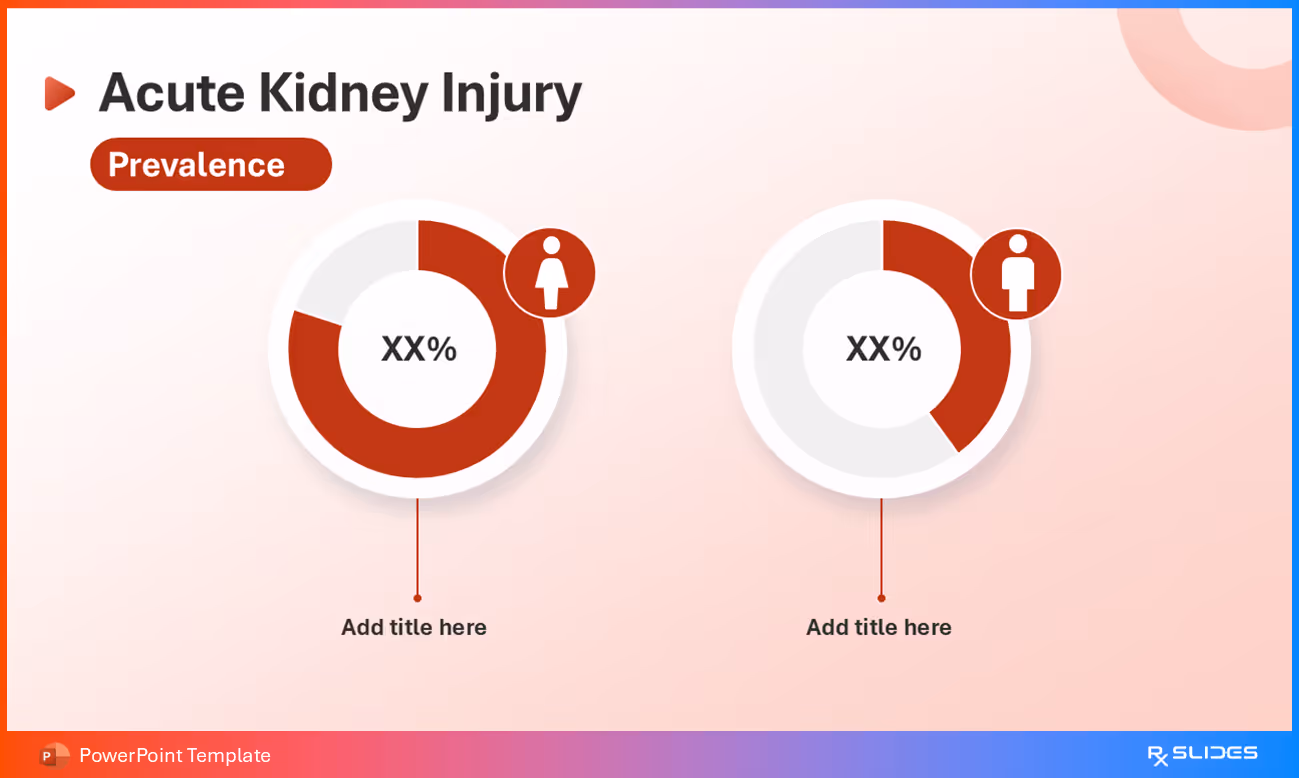
Slide 7: AKI Prevalence by Gender: Editable Chart
- Visual slide with placeholders to display AKI prevalence by sex. Replace values and labels to quickly present male vs. female data.
- The clean format makes it easy to adapt for audits or research.
Slide 8: Prevalence of Acute Kidney Injury: Global Distribution Map
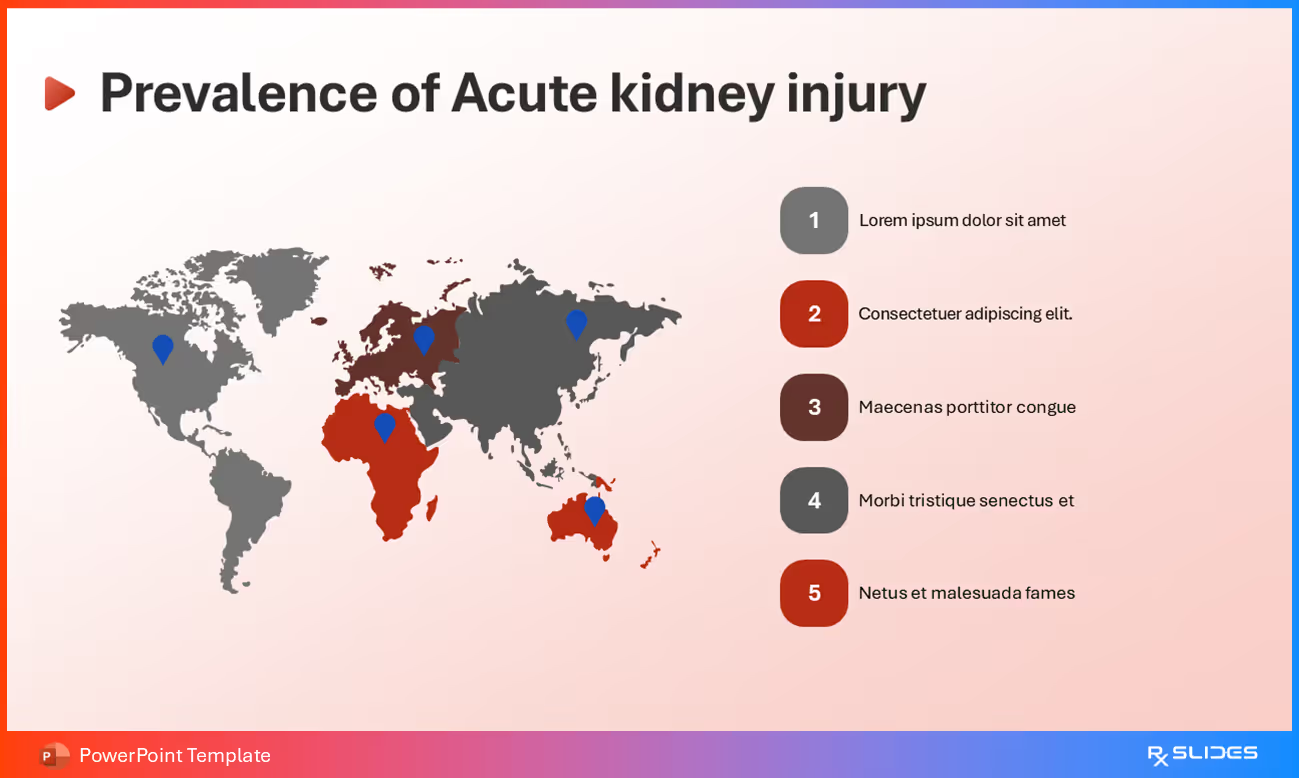
- Show global AKI prevalence with this interactive map, using editable pins and numbered legends to highlight key regions, countries, or population groups affected by acute kidney injury.
Slide 9: Global AKI Burden: Visual Map with Data Callouts
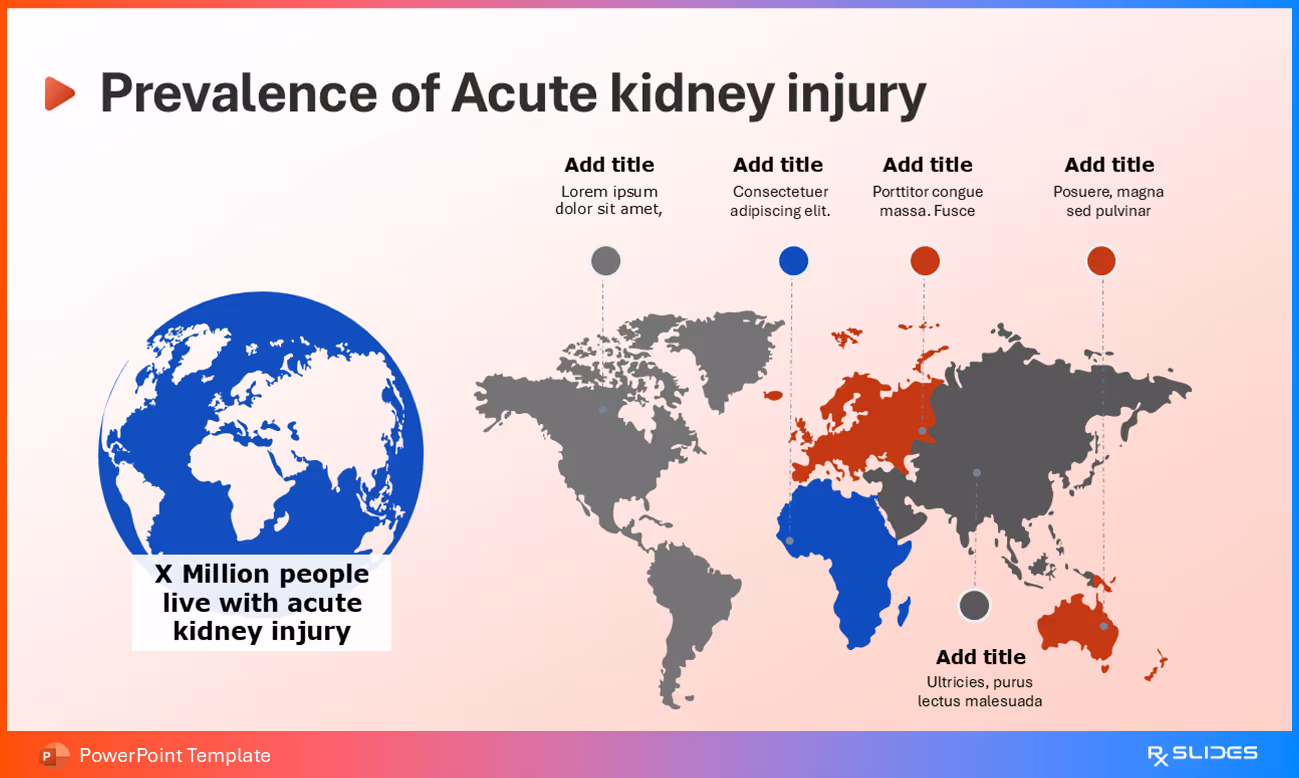
- Highlight the worldwide burden of AKI using this global map with region-specific callouts. The large infographic on the left allows for a powerful presentation of total global estimates, with fully editable pins and data boxes for quick customization.
Slide 10: Acute Kidney Injury Anatomy: Section Divider

- A bold section divider slide introducing the anatomical overview of acute kidney injury, ideal for transitioning into nephron structure, renal circulation, or histopathological changes.
- The featured kidney icon and vibrant design reinforce the medical context and ensure audience engagement.
Slide 11: Journey Through the Urinary System Anatomy
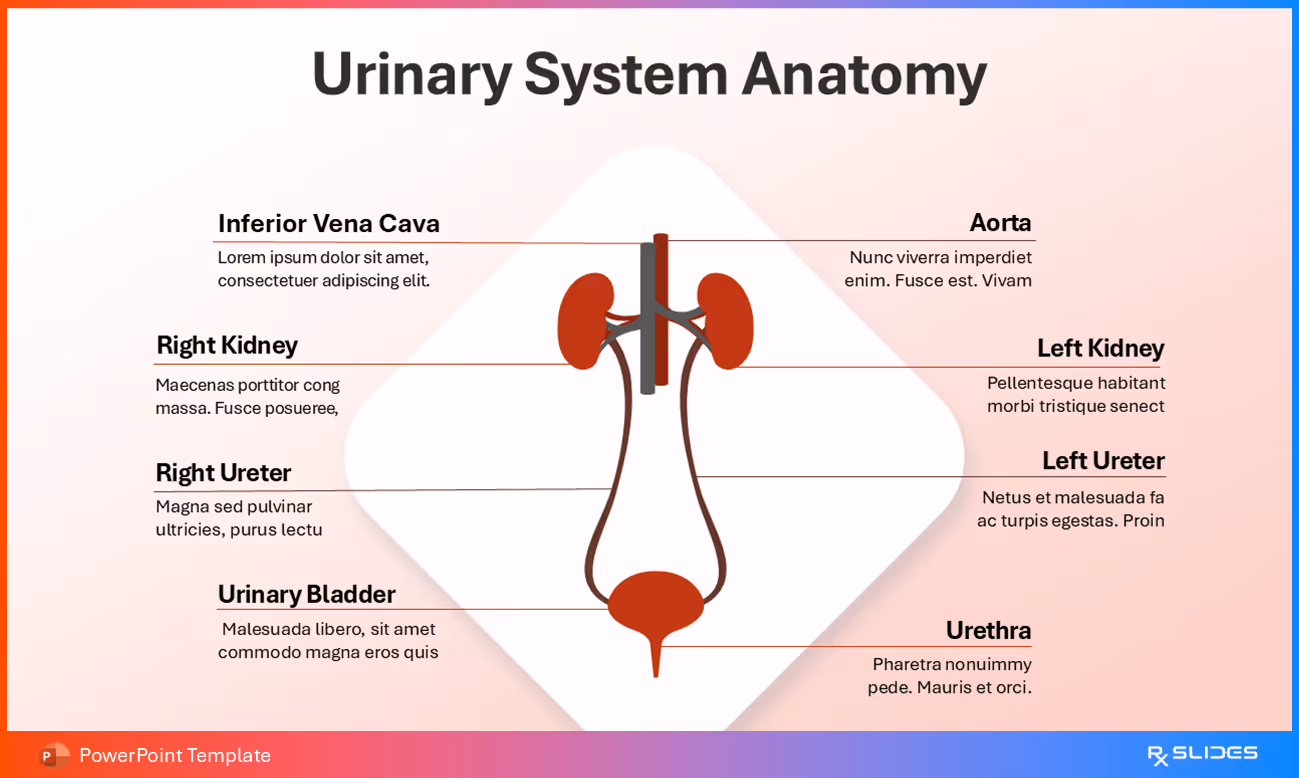
- Begin a visual journey through the urinary system with this engaging anatomy slide. A central, clearly labeled diagram traces the path from the filtering kidneys to the bladder and urethra, making it perfect for anatomy lessons and medical training.
Slide 12: Anatomy of the Kidney
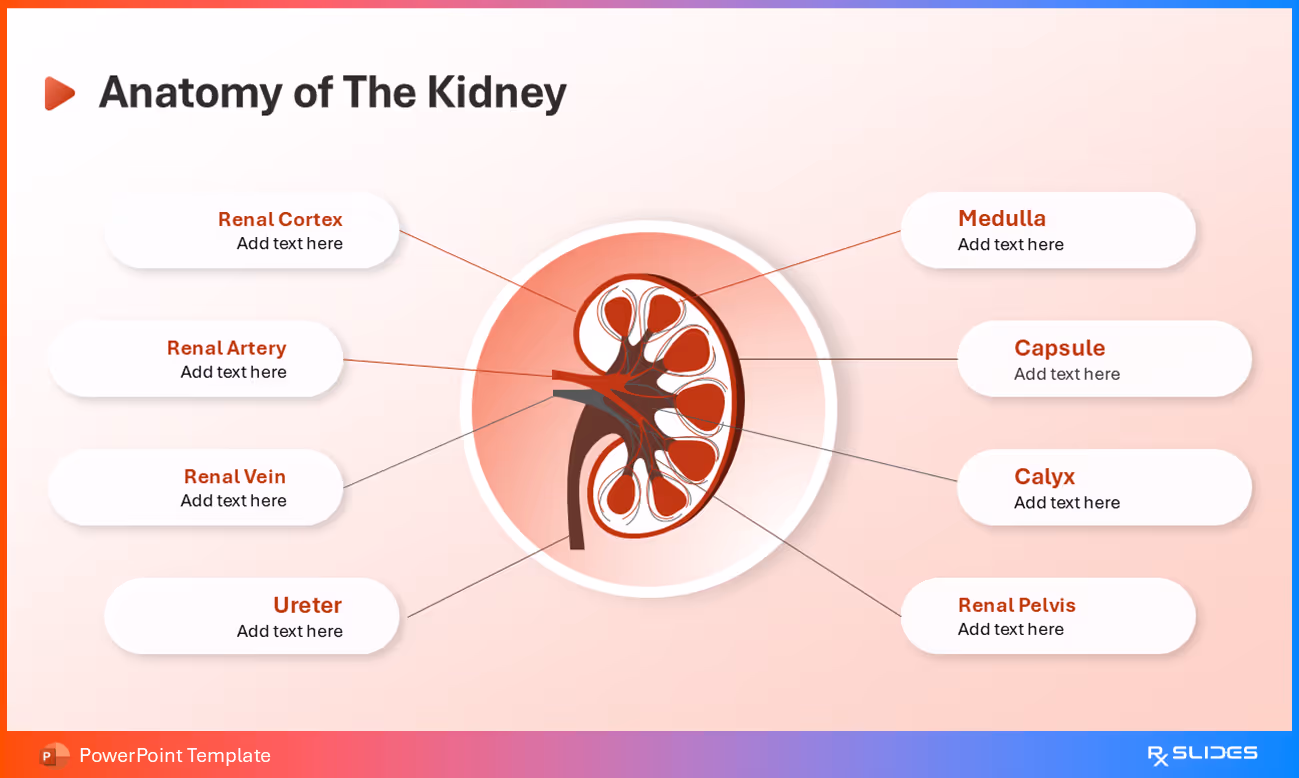
- This detailed diagram of a kidney's internal structure points out important parts like the renal cortex, medulla, and ureter. It's a great tool for explaining what each section does and how it all fits together for anyone teaching or learning about kidney anatomy.
Slide 13: Anatomy of the Nephron
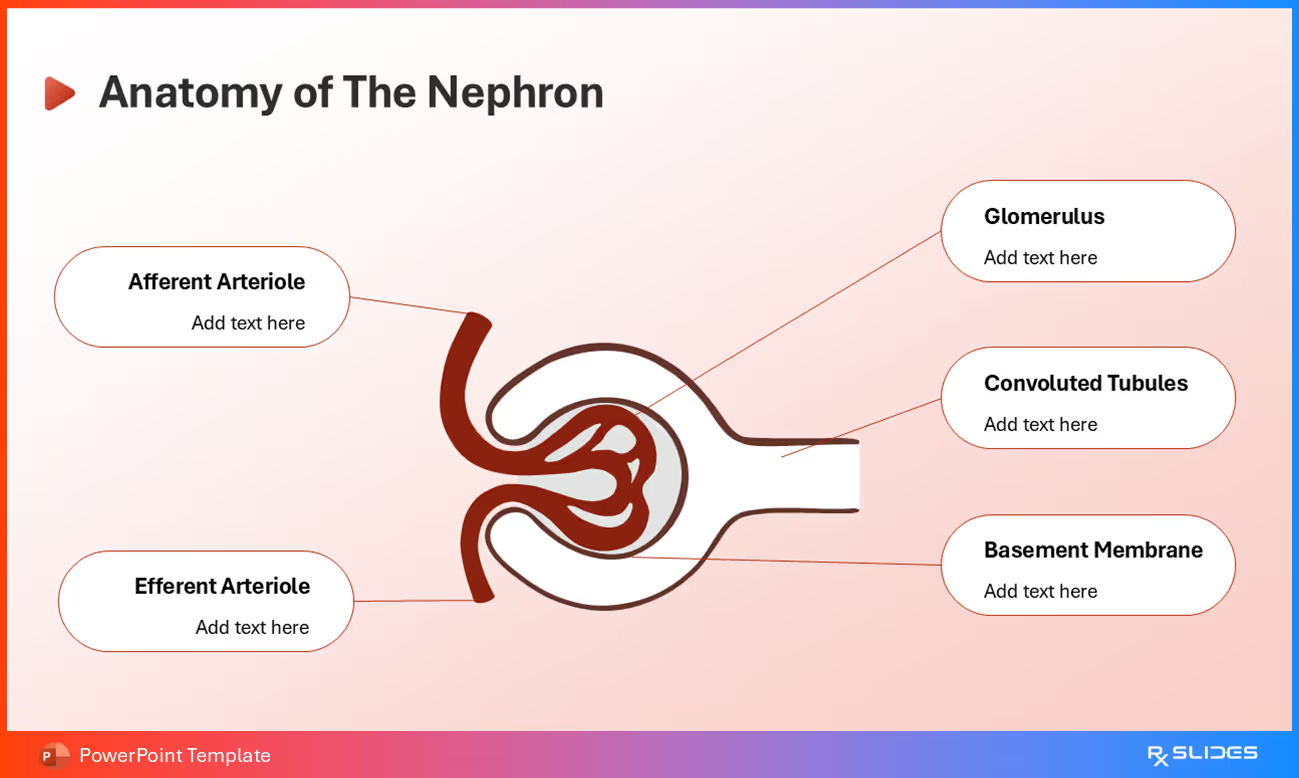
- This detailed diagram of a nephron clearly labels the glomerulus, afferent arteriole, efferent arteriole, convoluted tubules, and basement membrane. It is a useful tool for explaining how the kidney filters blood at a cellular level.
Slide 14: Anatomy of the Nephron: Alternative Animated View
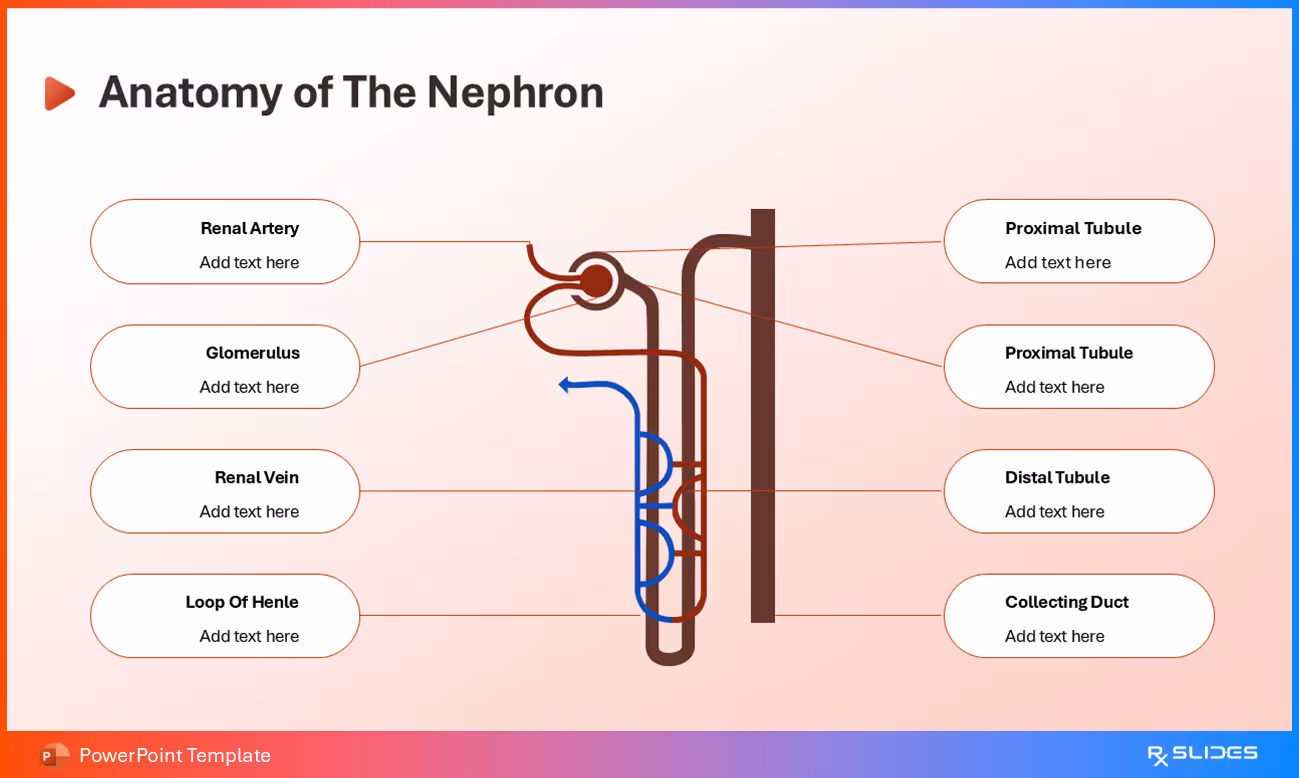
- This slide gives a more complete look at the nephron, showing its connection to the blood supply. The diagram clearly labels key parts like the renal artery, glomerulus, renal vein, and collecting duct, making it a great visual for explaining the kidney's full filtering process.
Slide 15: Acute Kidney Injury Causes—Section Slide

- This slide introduces the topic of what causes acute kidney injury. It has a red background and a simple icon showing a drop of water with a line through it, which helps you start a discussion about the reasons behind this condition.
Slide 16: Acute Kidney Injury Causes

- This slide provides a clear explanation of the three primary causes of acute kidney injury. It uses three separate cards, each with a diagram that highlights where the problem occurs.
- The three categories are prerenal, which affects the blood flow to the kidneys; renal, which points to problems with the kidneys themselves; and postrenal, which shows issues after the kidneys, in the urinary tract. This slide is a very helpful way to teach and remember the different origins of this condition.
Slide 17: Acute Kidney Injury Prerenal Causes
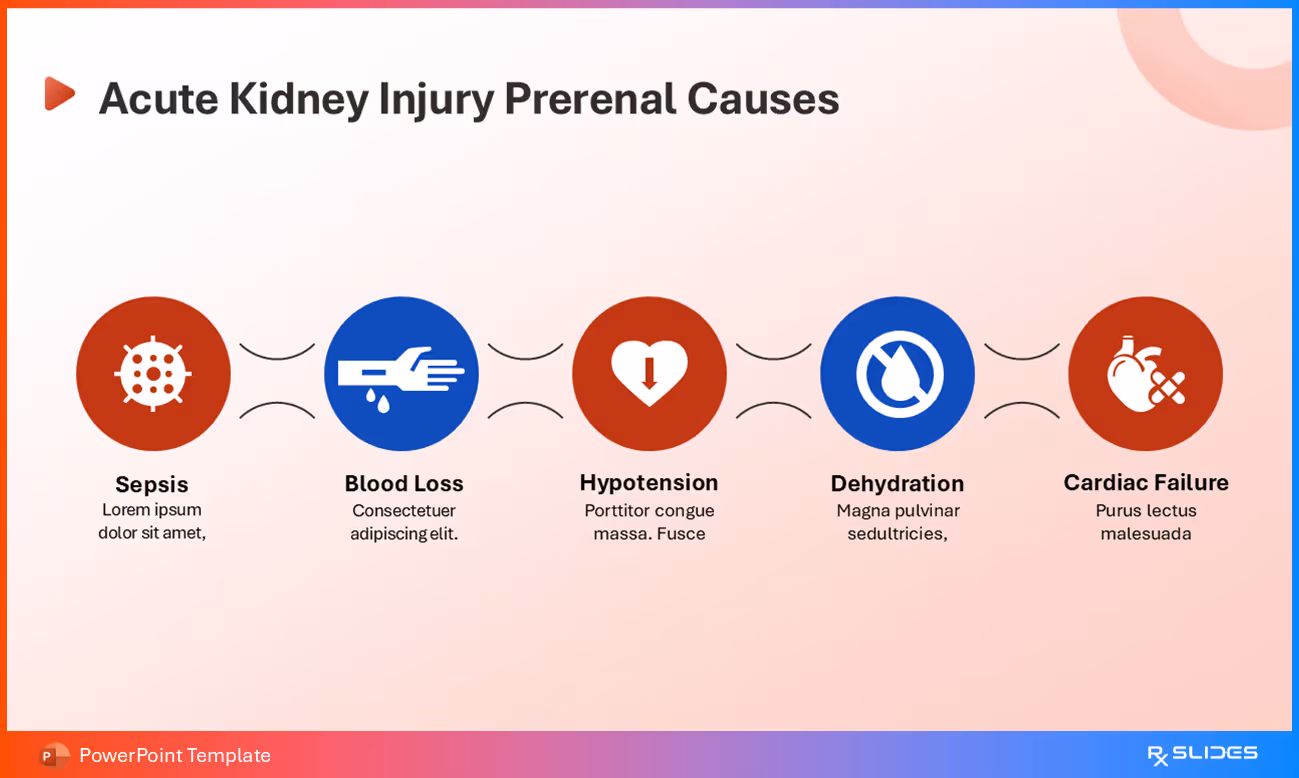
- This slide lists the main reasons for prerenal acute kidney injury, including sepsis, blood loss, hypotension, dehydration, and cardiac failure.
- The connected icons provide a clear and simple way to present problems that reduce blood flow to the kidneys.
Slide 18: Visualizing Prerenal Causes of Acute Kidney Injury
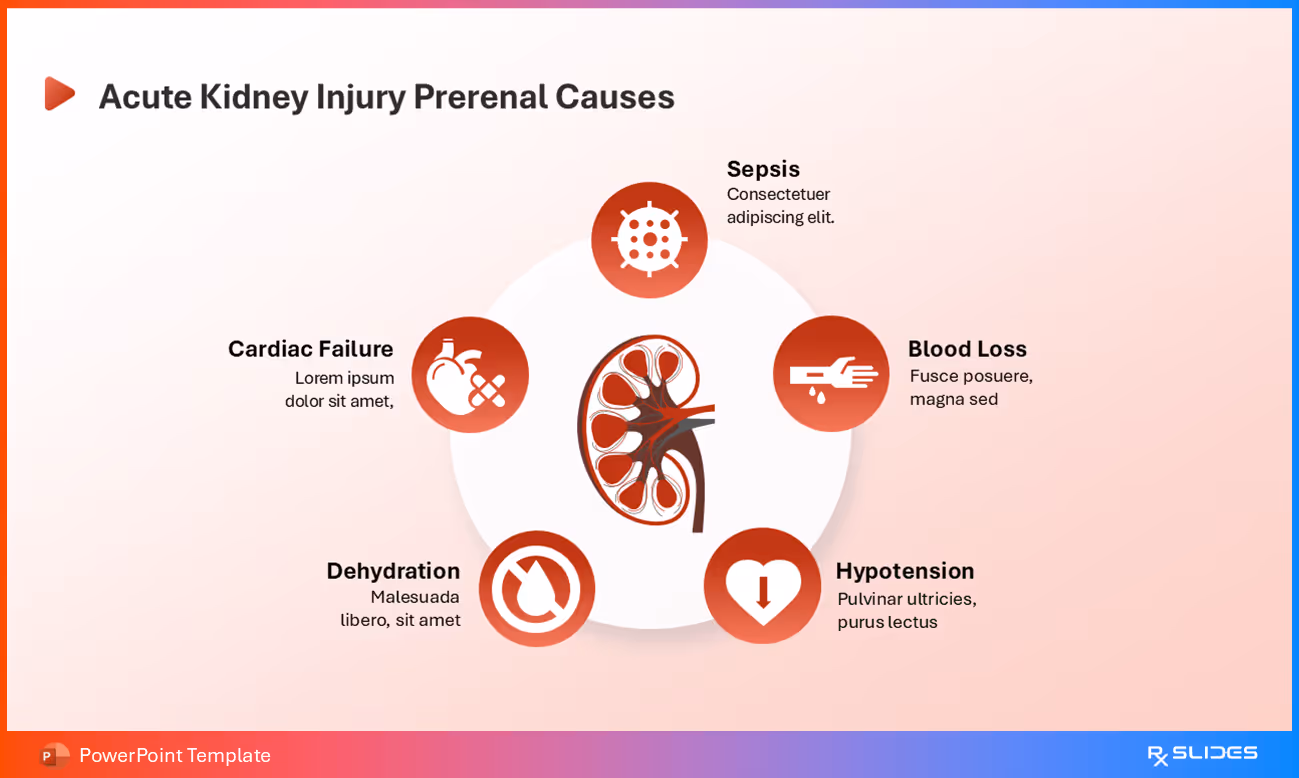
- A central kidney illustration is surrounded by icons representing key prerenal factors.
- This circular design reinforces the interconnectedness of these systemic conditions and their impact on kidney function.
- Use this slide to provide a dynamic and memorable overview of how problems elsewhere in the body can lead to kidney injury.
Slide 19: Acute Kidney Injury Renal Causes
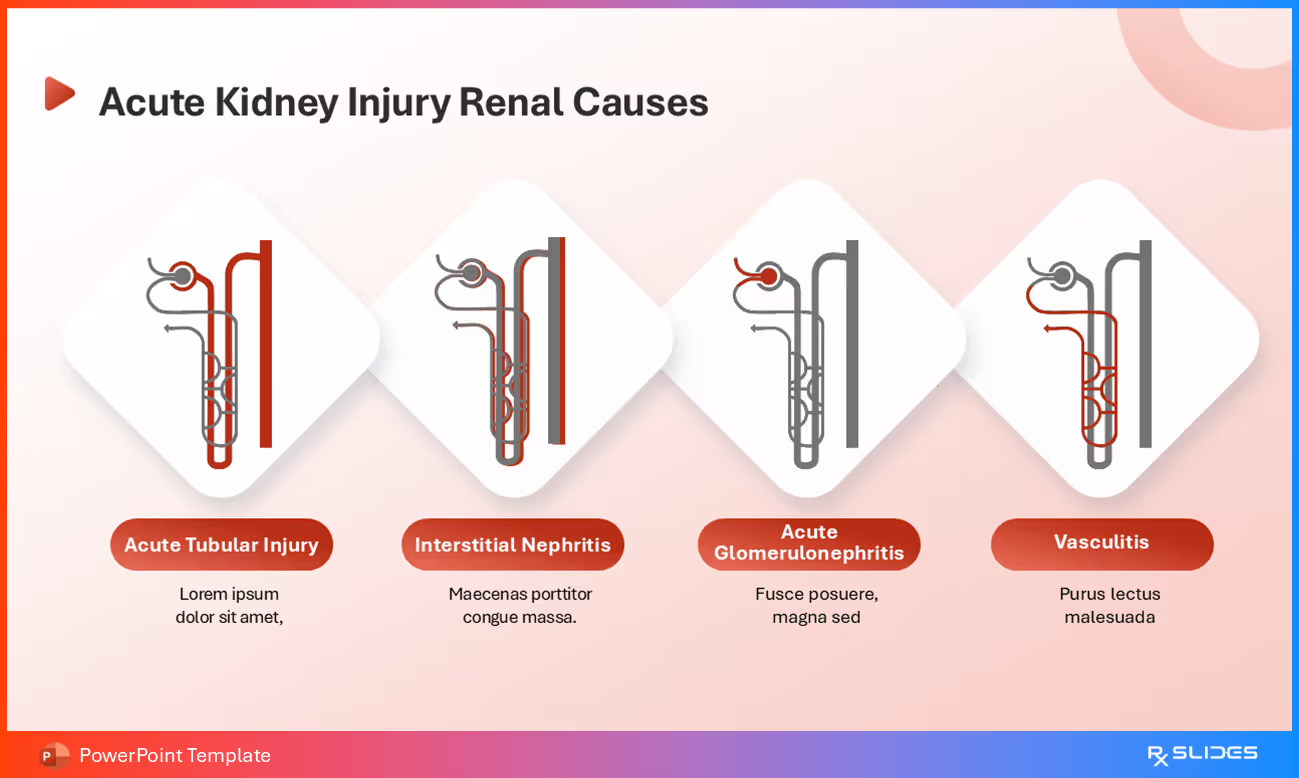
- This slide moves from the general causes to the specific problems that happen right inside the kidney.
- It uses four detailed diagrams to show what goes wrong in each case.
- The four causes shown are acute tubular injury, interstitial nephritis, acute glomerulonephritis, and vasculitis.
- Use this slide to explain the different types of damage that can affect the kidney's filtering parts and lead to kidney injury.
Slide 20: Acute Kidney Injury Postrenal Causes
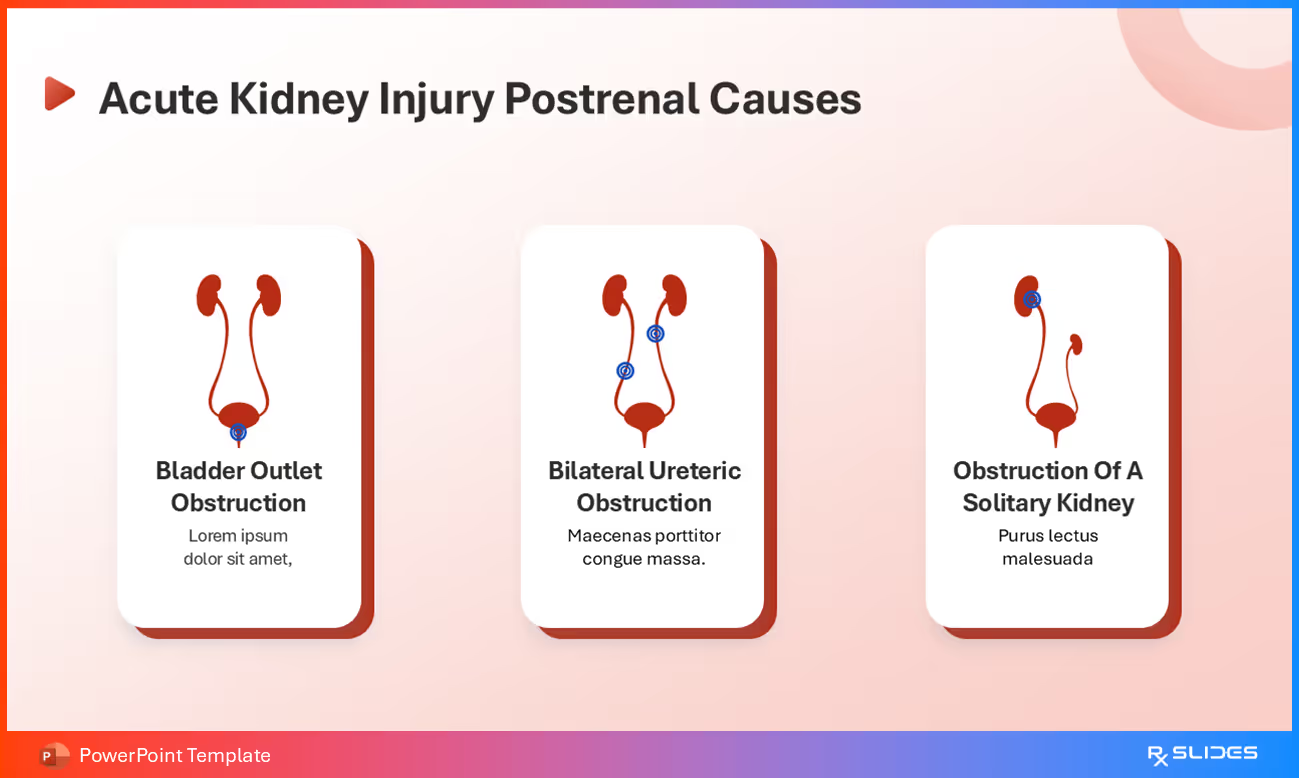
- Focus on the postrenal causes of acute kidney injury with this slide, which are problems that block the flow of urine after it leaves the kidneys.
- The diagrams show three distinct issues: bladder outlet obstruction, bilateral ureteric obstruction, and obstruction of a solitary kidney.
Slide 21: Acute Kidney Injury Risk Factors-Section Slide

- Introduce the risk factors for acute kidney injury with this section slide, a useful way to get your audience ready to learn about who is most at risk.
Slide 22: Acute Kidney Injury Risk Factors

- This slide lists several common things that can increase a person's risk of getting acute kidney injury, including being hospitalized, age, peripheral artery disease, diabetes, and chemotherapy. The use of icons provides a brief look at the major risk factors.
Slide 23: Acute Kidney Injury Risk Factors (Continued)
- Expand on the topic of risk factors with this slide, which highlights how existing health issues can increase the chance of disease. Icons are used to represent high blood pressure, heart failure, kidney diseases, and liver diseases, showing how different health problems are connected.
Slide 24: Acute kidney Injury Pathogenesis Section Slide

- This slide introduces the next main topic for the attendees.
- Unlike the previous slides that looked at causes and risk factors, this one moves to explaining how the damage actually happens inside the kidney.
Slide 25: Cross-section of the Kidney
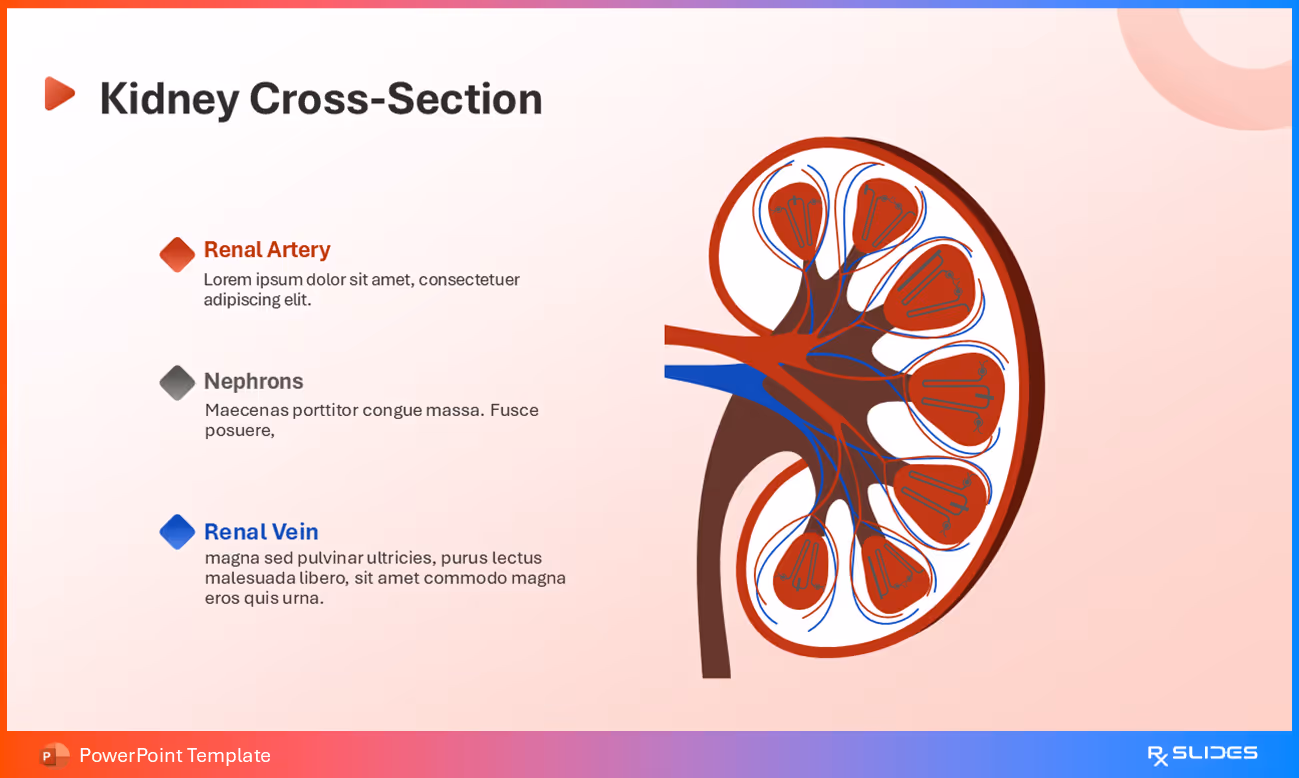
- Explain the main parts of the kidney with this cross-section diagram. It points out the renal artery, nephrons, and renal vein, helping to explain the basic structure before you discuss what goes wrong in the disease.
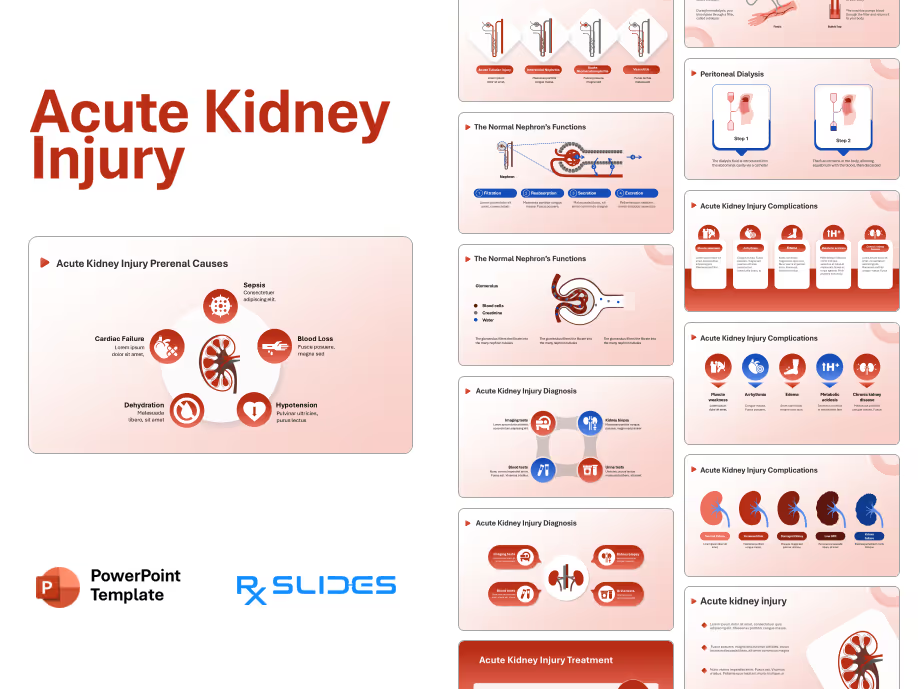
Slide 26: The Normal Nephron's Functions
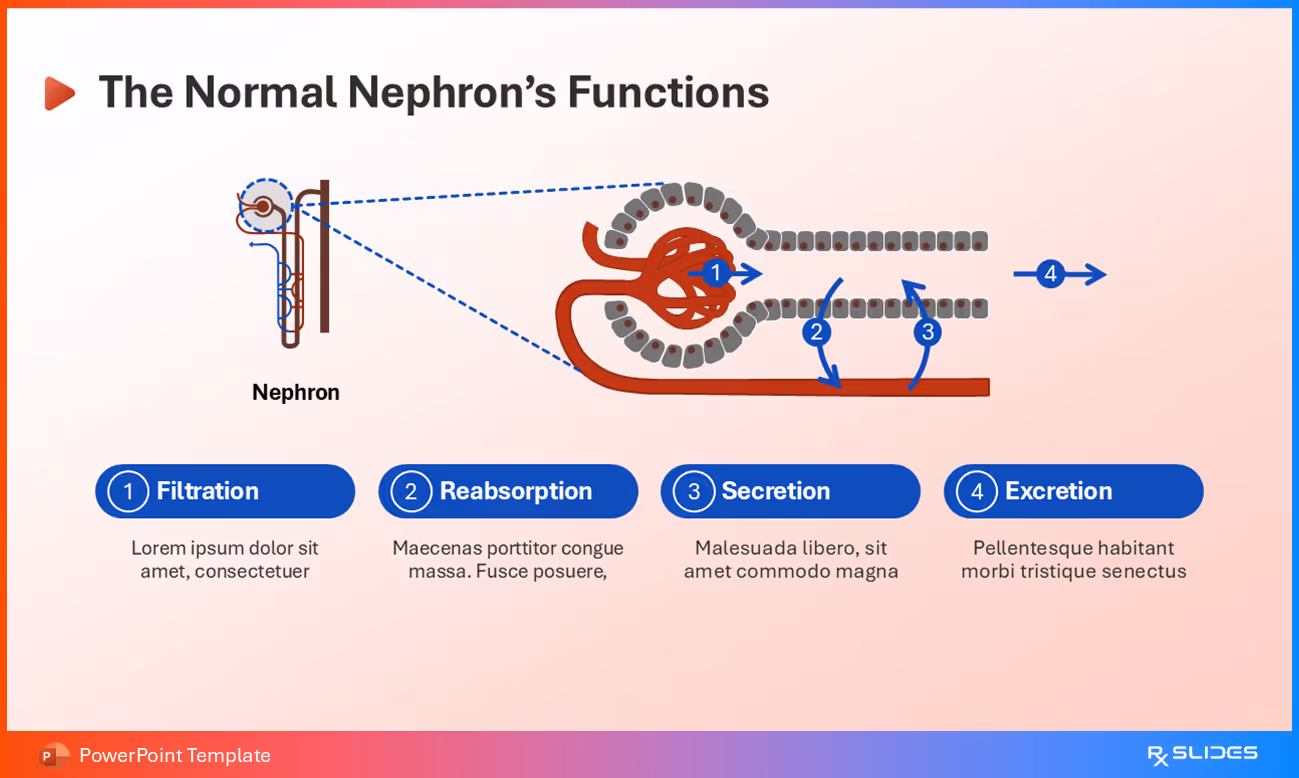
- This animated slide is the perfect tool to introduce the overall flow of events in the nephron, explaining the four main parts: filtration, reabsorption, secretion, and excretion.
Slide 27: Detailed Overview of the Normal Nephron's Functions
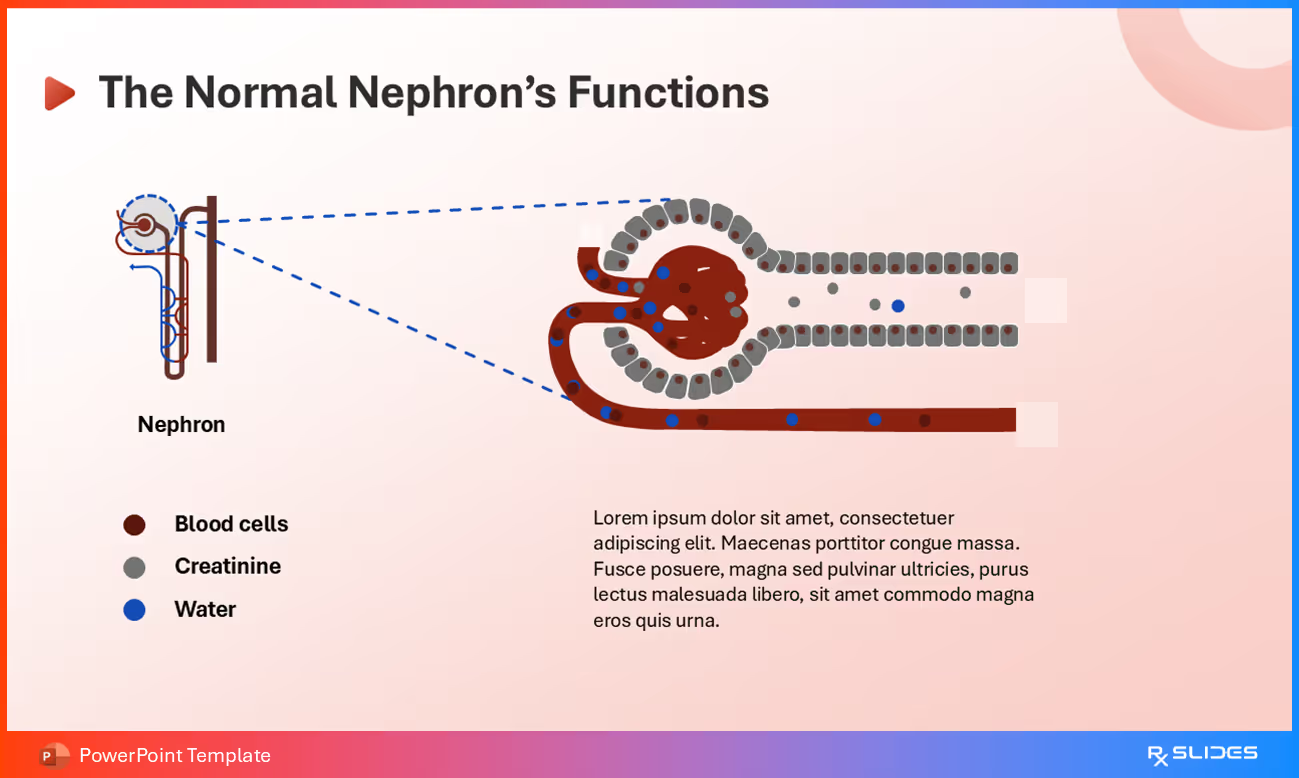
- For a deeper understanding of the process, this slide gives a close-up view of the nephron. The detailed diagram uses colored dots to show key elements like blood cells, creatinine, and water, bringing the filtering process to life.
Slide 28: The Normal Nephron's Functions

- Explain the journey inside the kidney to meet the glomerulus, the first and most important filter. The diagram acts as a guide to show how the kidney sorts what passes through, explaining the very beginning of its mission to clean the blood.
Slide 29: Glomerulus in Prerenal Kidney Injury
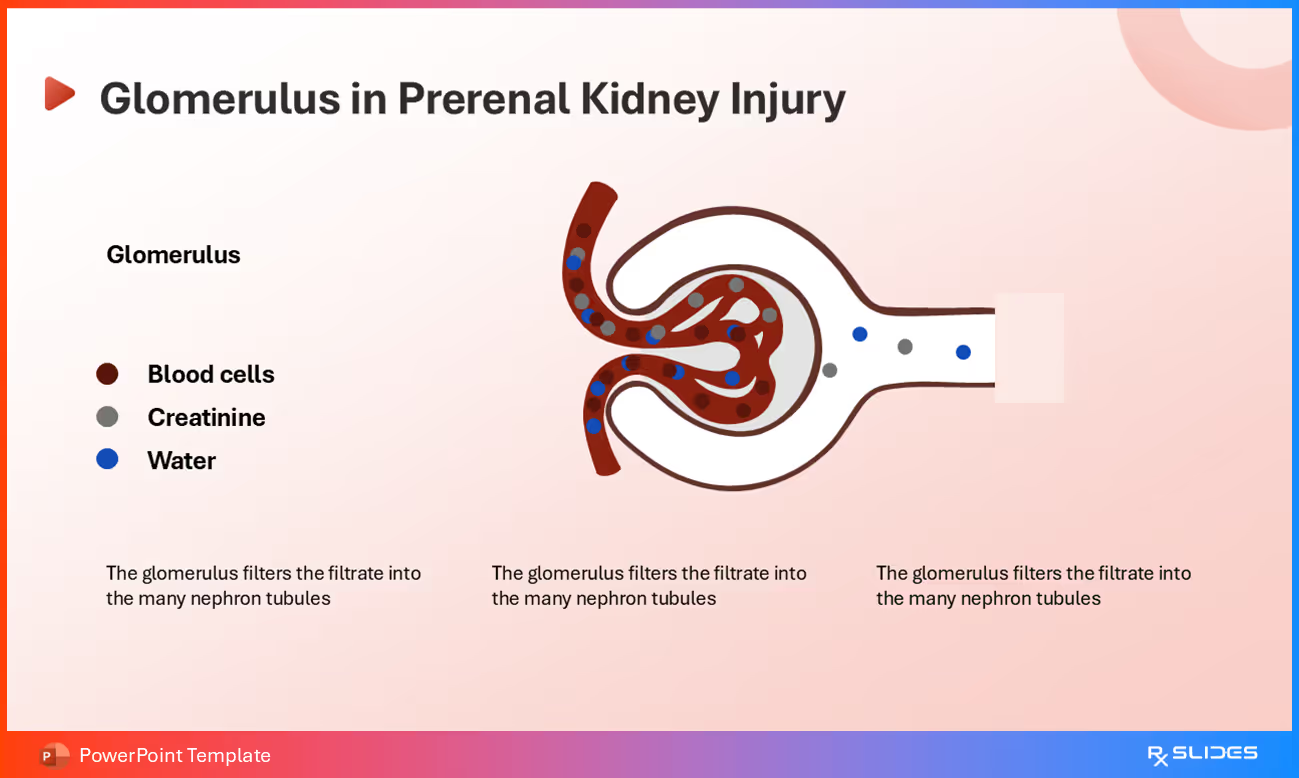
- The journey continues with this slide, a powerful visual showing the glomerulus under stress from prerenal causes. The diagram illustrates how a lack of blood flow impacts the filtration of blood cells, creatinine, and water, showing where the story of kidney injury begins.
Slide 30: Acute Tubular Necrosis Explained
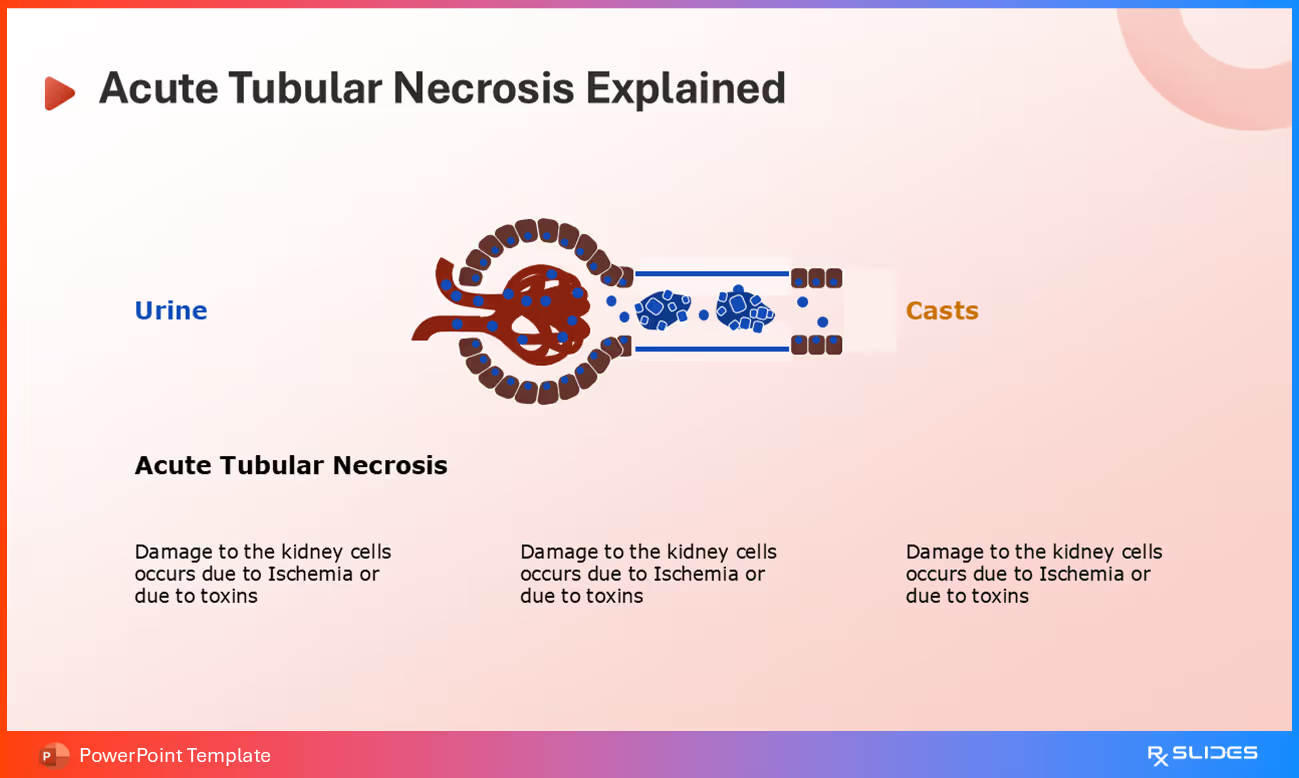
- This slide zooms in to explain a specific crisis happening inside the kidney: acute tubular necrosis.
- It’s a story of damage, where the kidney’s cells are hurt by ischemia or toxins.
- The diagram illustrates how this damage creates casts that block the flow of urine, highlighting the physical impact this injury has on the kidney’s function.
Slide 31: Acute Interstitial Nephritis Explained
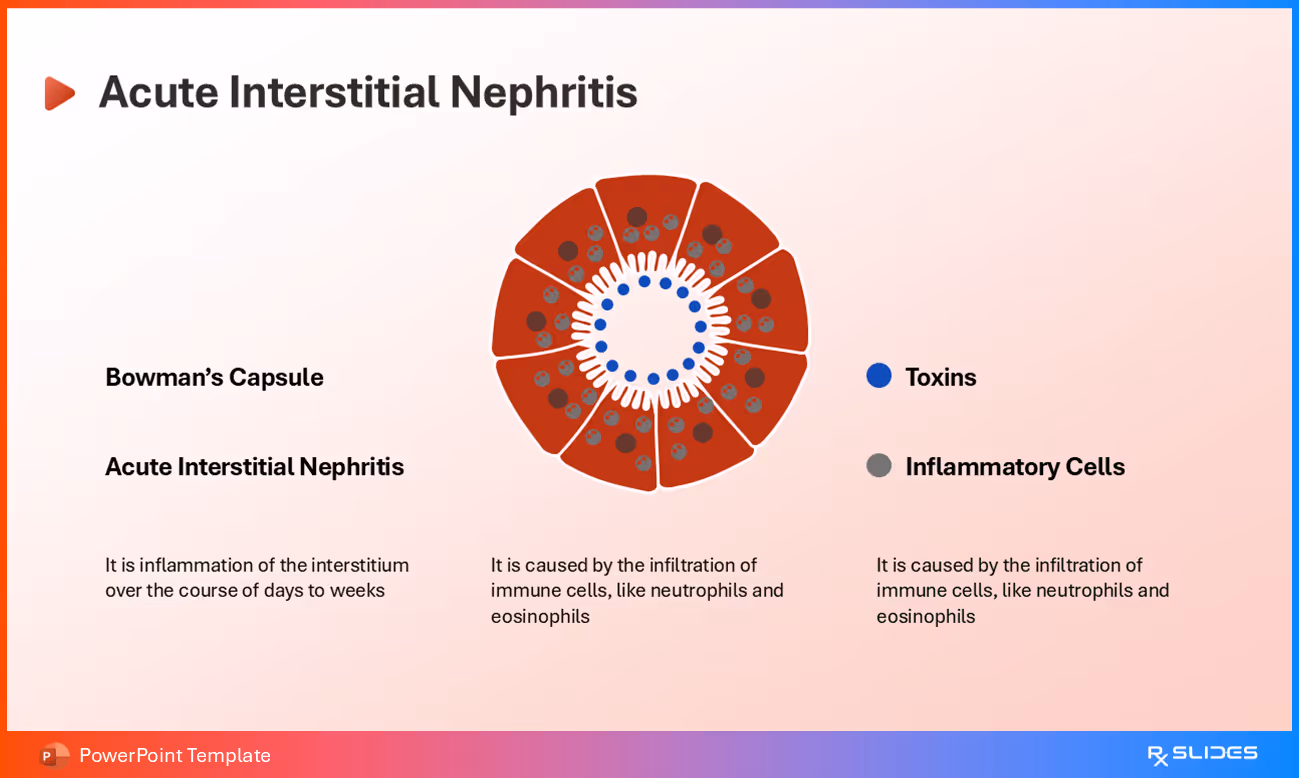
- The slide shows a different kind of challenge within the kidney, specifically within the Bowman's Capsule, which is under attack.
- The diagram tells the story of acute interstitial nephritis, showing how toxins and inflammatory cells infiltrate the area.
- This slide is a compelling way to show how the immune system's response can lead to serious damage.
Slide 32: How Postrenal Obstruction Causes Injury
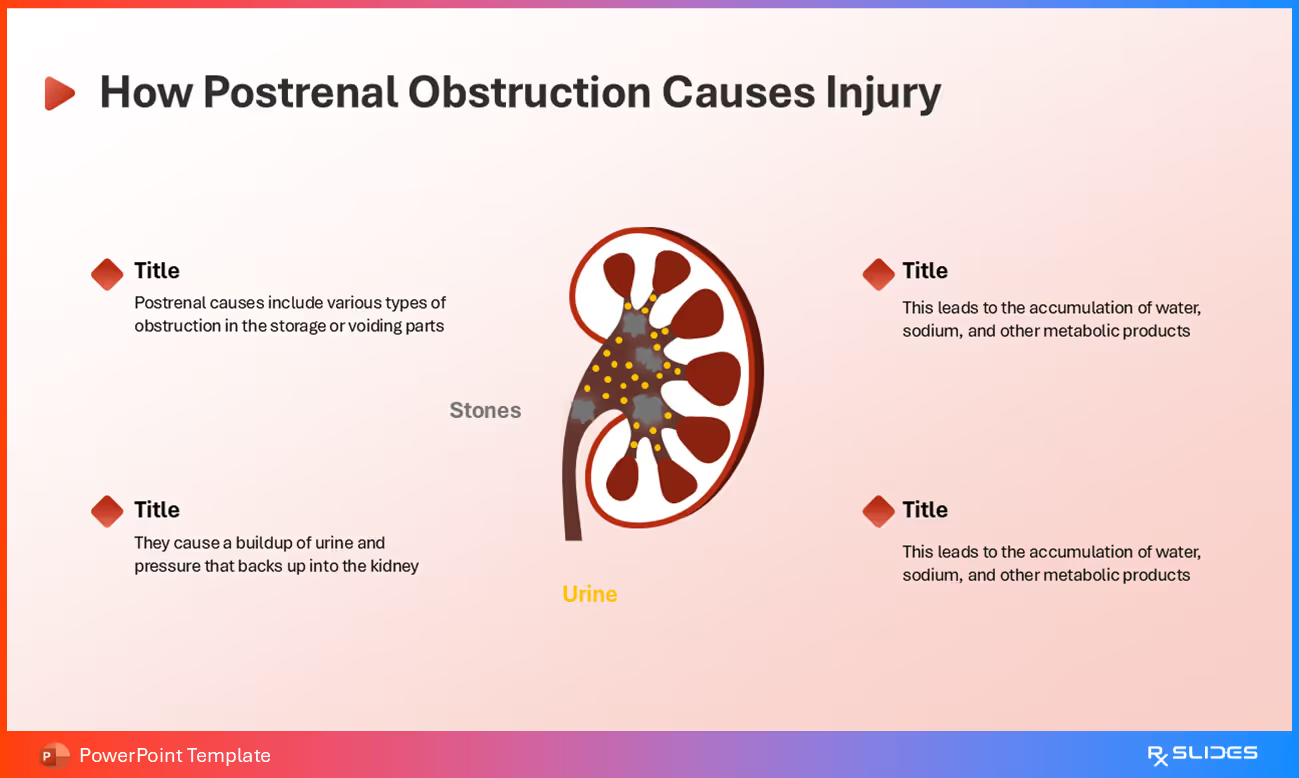
- This final slide in the sequence tells the story of a blockage. It provides the audience a clear visual of the problem: something like stones creates an obstruction that stops the flow of urine.
- The diagram shows how this causes a buildup of pressure and a harmful accumulation of water, sodium, and other metabolic products that ultimately injure the kidney.
Slide 33: Acute Kidney Injury Symptoms Section Slide

- This slide uses a visual metaphor to introduce the topic of symptoms, serving as an engaging way to begin discussing the clinical presentation of the condition.
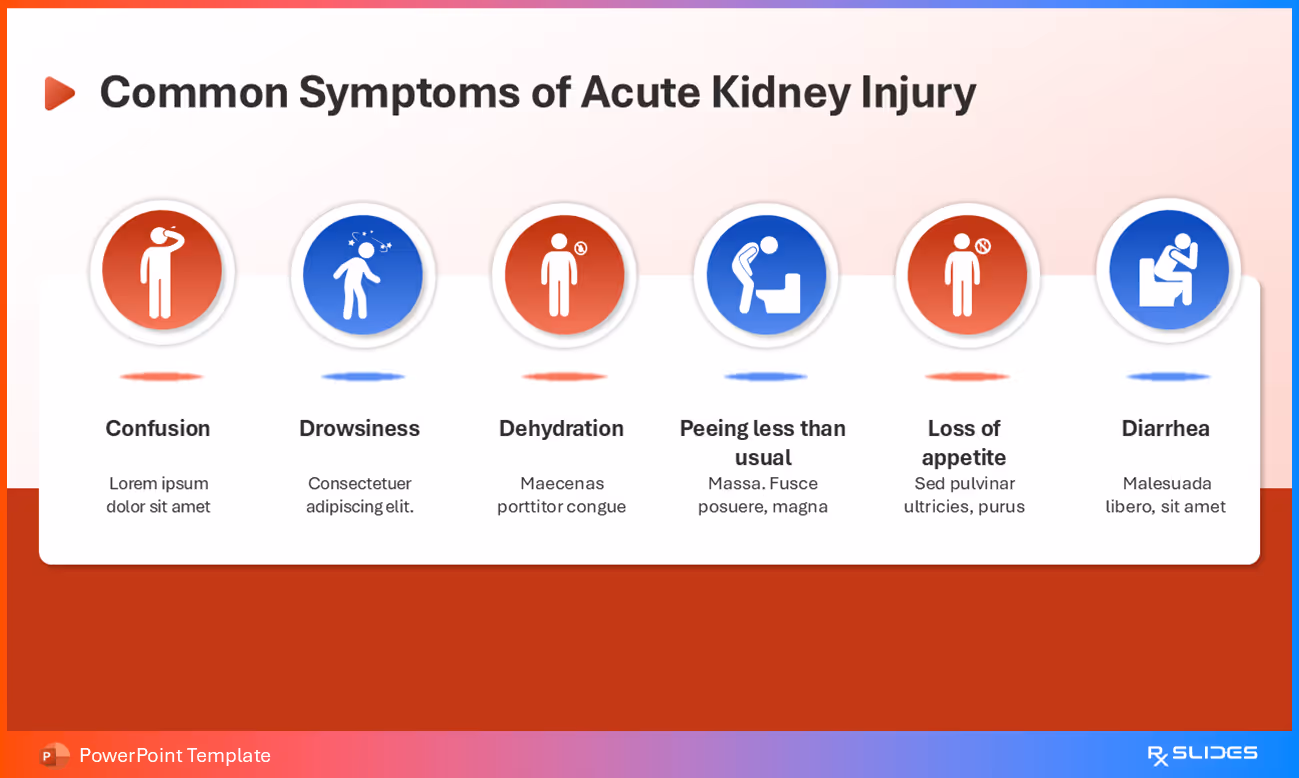
Slide 34: Clinical Symptoms of Acute Kidney Injury
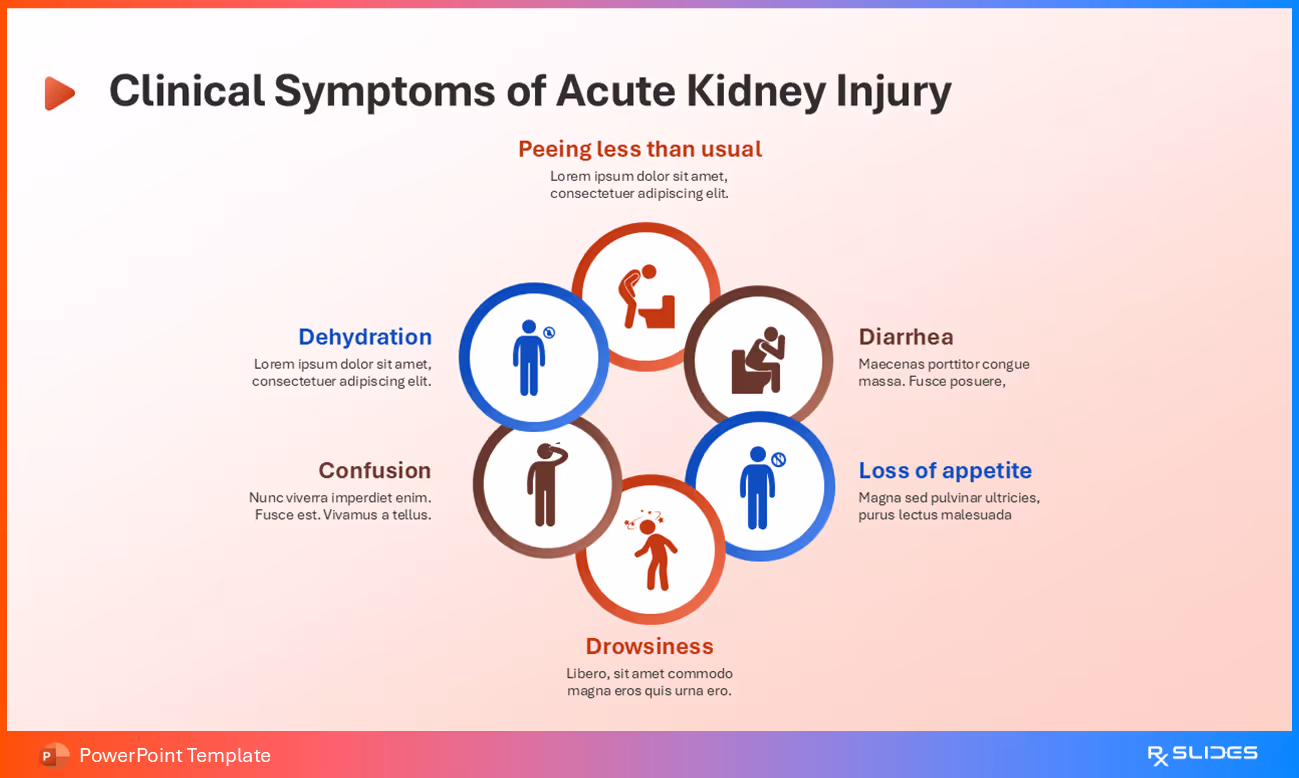
- This slide provides a detailed look at various symptoms of the condition in a circular flow diagram. It lists key symptoms like peeing less than usual, dehydration, diarrhea, loss of appetite, drowsiness, and confusion, each with a supporting icon.
- It is a clear and organized way to present a comprehensive list of symptoms.
Slide 35: Acute Kidney Injury Symptoms: Alternative Design
- This alternative design presents AKI symptoms in a horizontal layout, reinforcing key clinical manifestations like muscle weakness and drowsiness with distinct icons.
Slide 36: Acute Kidney Injury Diagnosis: Divider Slide

- Introduce the topic of diagnosis with this slide's clean, simple icon. The magnifying glass over the kidneys visually represents the process of examining the condition to reach a diagnosis.
Slide 37: Acute Kidney Injury Diagnosis
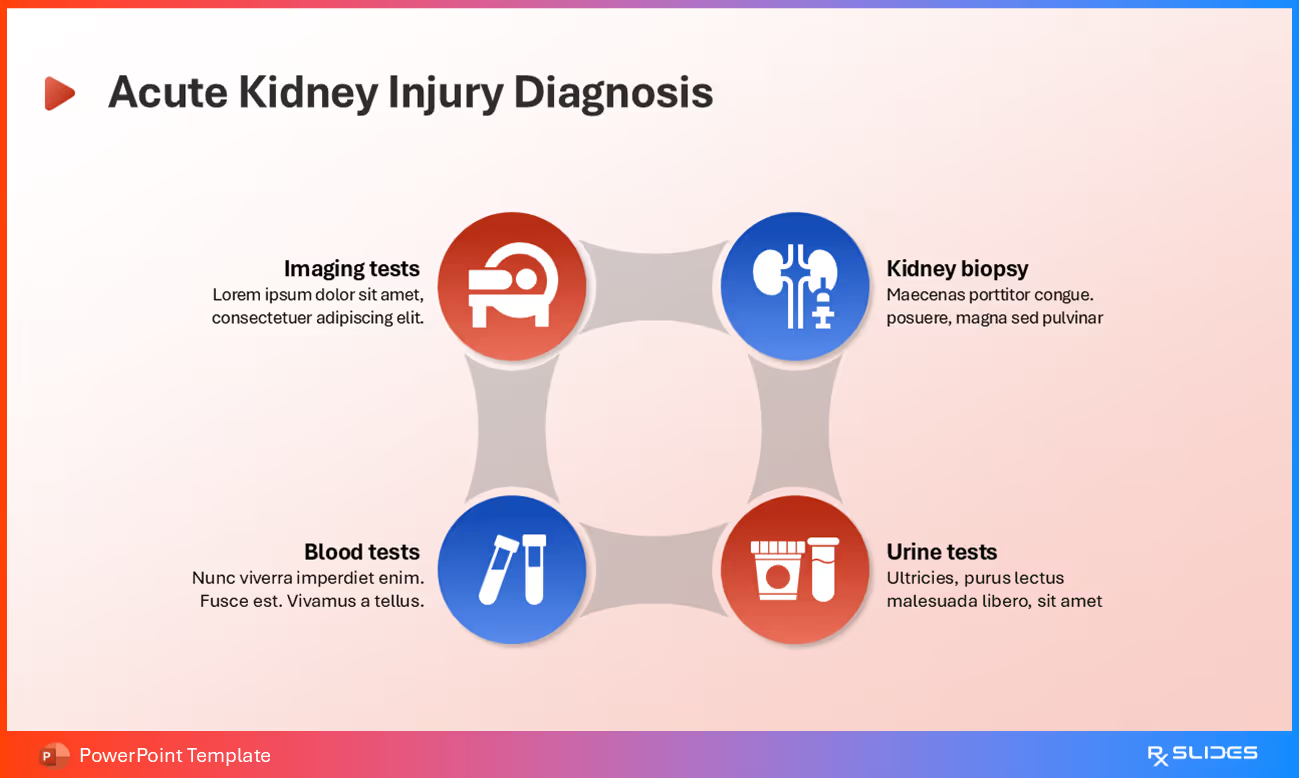
- This slide illustrates the interconnected nature of diagnosing acute kidney injury. It presents four key diagnostic methods—imaging tests, kidney biopsy, blood tests, and urine tests—emphasizing that physicians often use a combination of these approaches.
Slide 38: Acute Kidney Injury Diagnosis: Alternative Animated Design
- A central kidney icon anchors this alternative animated design, visually reinforcing how four diagnostic steps are often combined to give a full picture of the patient's condition.
Slide 39: Acute Kidney Injury Treatment Section Slide

- This slide serves as a section header to transition to the topic of treatment. The icon of a medical capsule is a clear visual cue that signals the beginning of a discussion on therapeutic interventions for acute kidney injury.
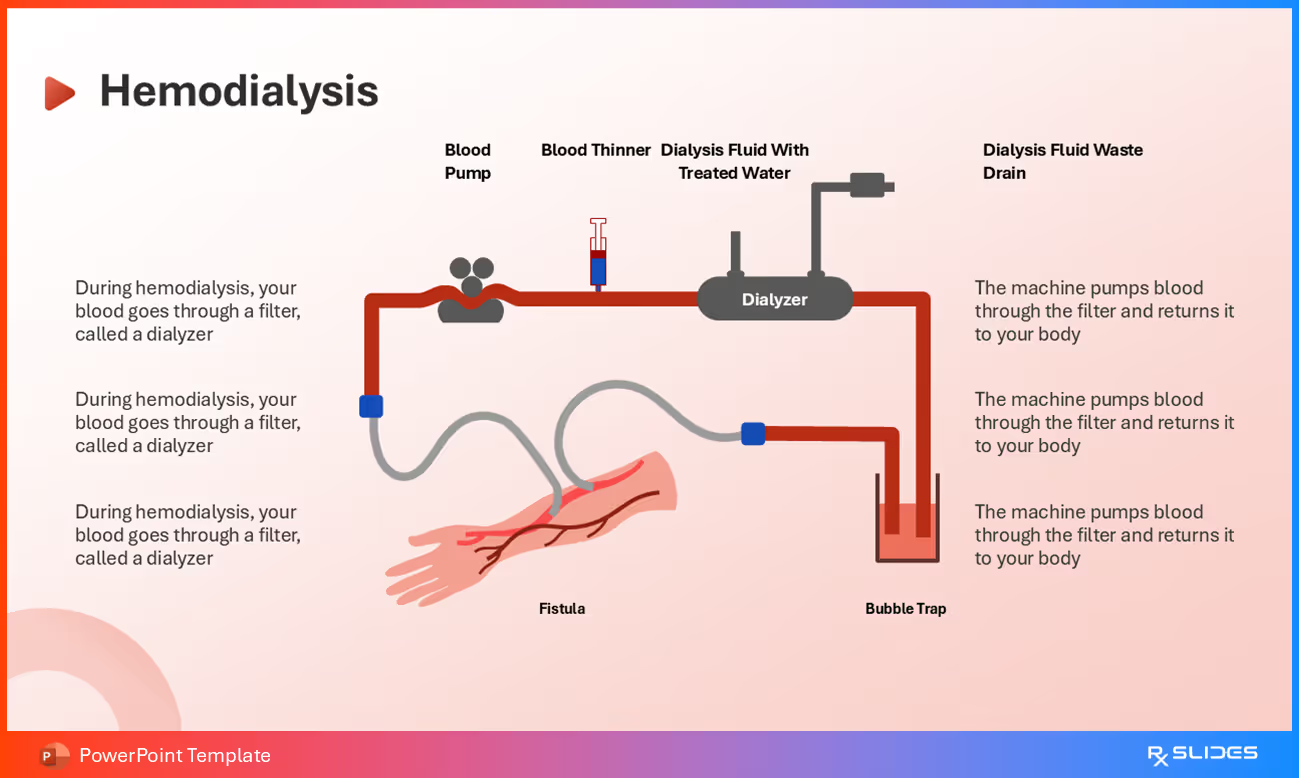
Slide 40: How Hemodialysis Works

- This animated diagram of the hemodialysis process highlights key components like the fistula, blood pump, and dialyzer. It serves as a visual guide to explain how the machine cleans the blood and returns it to the body.
Slide 41: Peritoneal Dialysis
- Illustrate the peritoneal dialysis process with this simple two-step diagram. It shows how the fluid is introduced into the abdominal cavity and then stays in the body to allow for waste exchange before being discarded.
Slide 42: The Two-Step Process of Peritoneal Dialysis
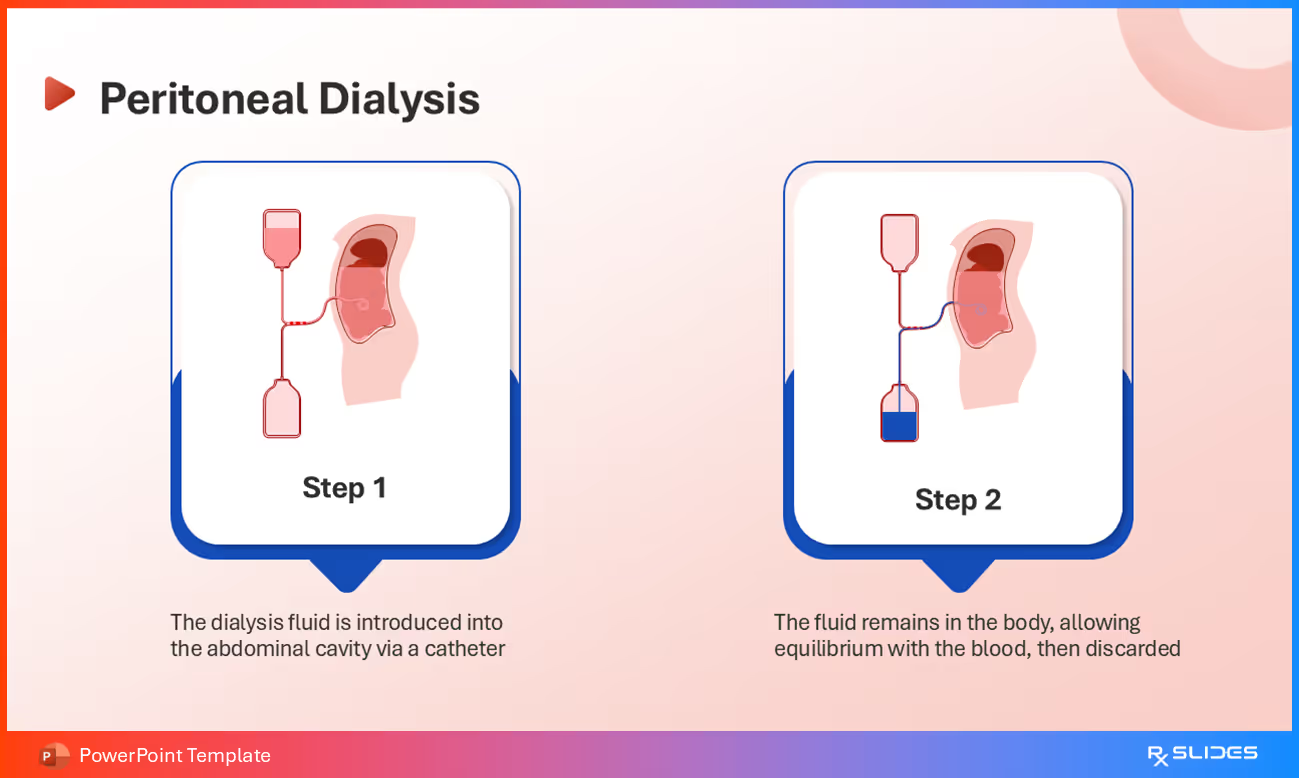
- This slide offers a simple, two-step visual guide to the peritoneal dialysis procedure. Step 1 shows the fluid being introduced via a catheter, and Step 2 illustrates how it filters and is then drained away.
Slide 43: Complications of AKI

- This slide serves as a header to transition into the next topic. The warning icon with an exclamation point powerfully alerts the audience to the serious nature of the complications that will be discussed.
Slide 44: Acute Kidney Injury Complications Alternative Design
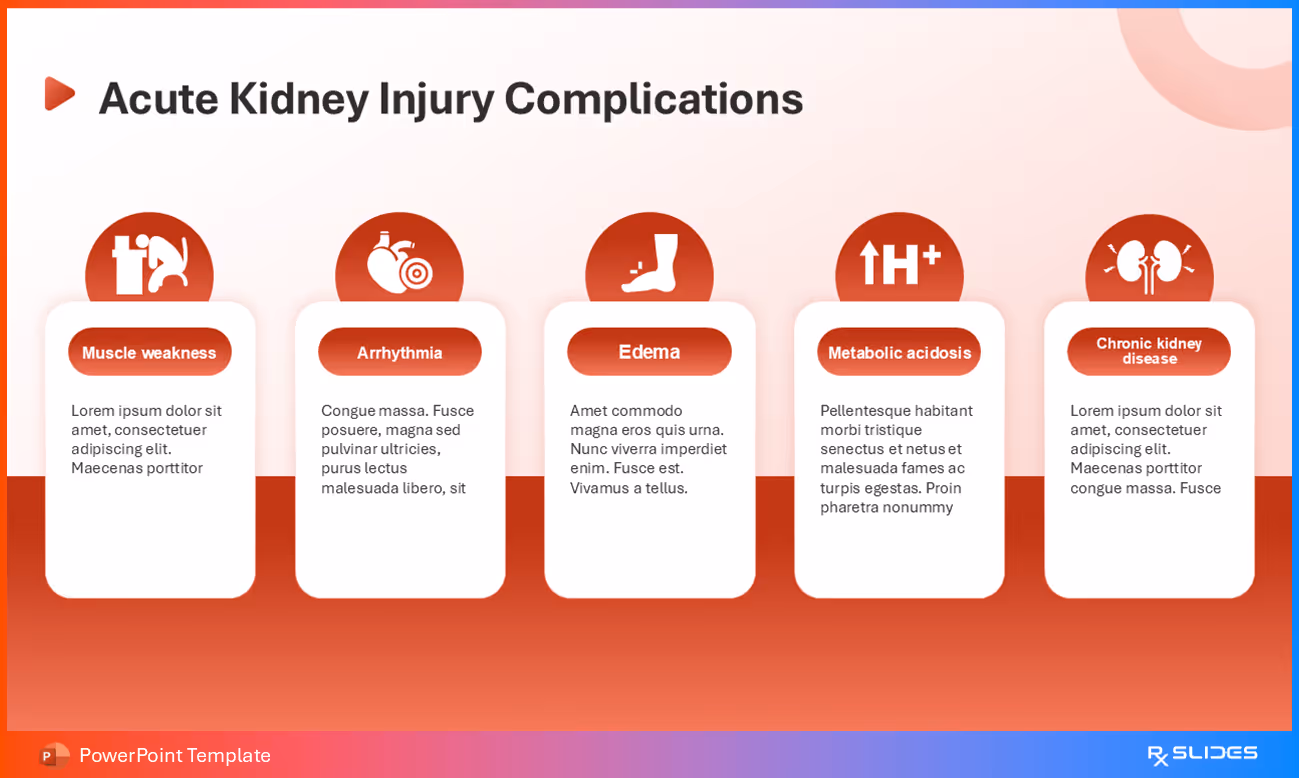
- This slide lists five potential complications in a clear, horizontal layout, covering muscle weakness, arrhythmia, edema, metabolic acidosis, and chronic kidney disease with supporting icons.
Slide 45: Consequences of Acute Kidney Injury
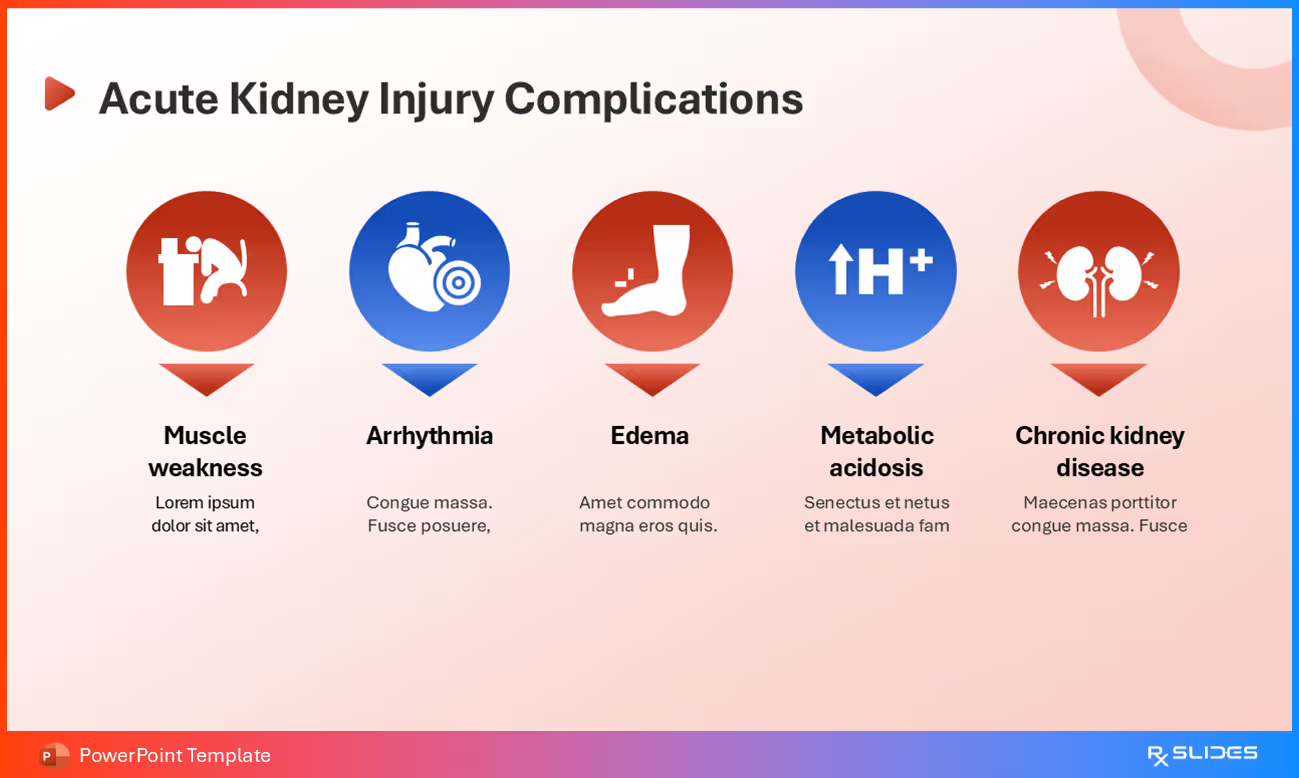
- This alternative design presents five key complications of AKI in a horizontal flow of circular icons, offering another visual way to highlight these serious health issues.
Slide 46: Kidney Failure Complications
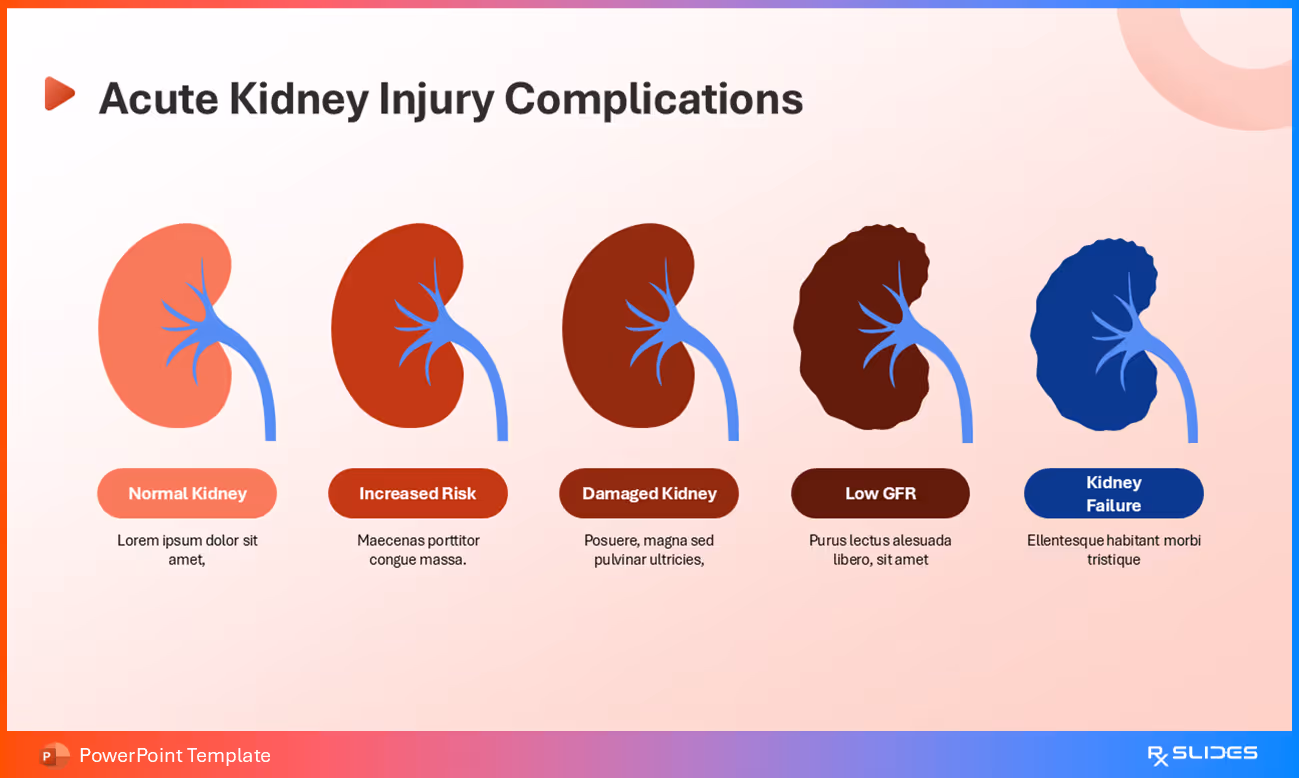
- This slide tells a visual story of the kidney's decline, starting with a normal kidney and moving through stages of damage to the final and most severe complication: kidney failure.
Slide 47: Acute Kidney Injury Prevention Section Slide

- Introduce the topic of prevention with this clear header. The prohibition sign icon visually reinforces the idea of stopping or avoiding acute kidney injury.
Slide 48: Acute Kidney Injury Prevention

- This slide lists six practical ways to prevent acute kidney injury. The diagram uses icons to highlight each strategy, including avoiding smoking, managing high blood pressure, and managing diabetes.
Slide 49: "Thank you" Slide.

- This final slide serves as a conclusion to the presentation, with a "Thank you" message placed prominently over a kidney icon for a simple, relevant ending.
Features of the Template
- 100% editable PowerPoint template.
- Editable colors, you can change according to your presentation style and company branding guidelines.