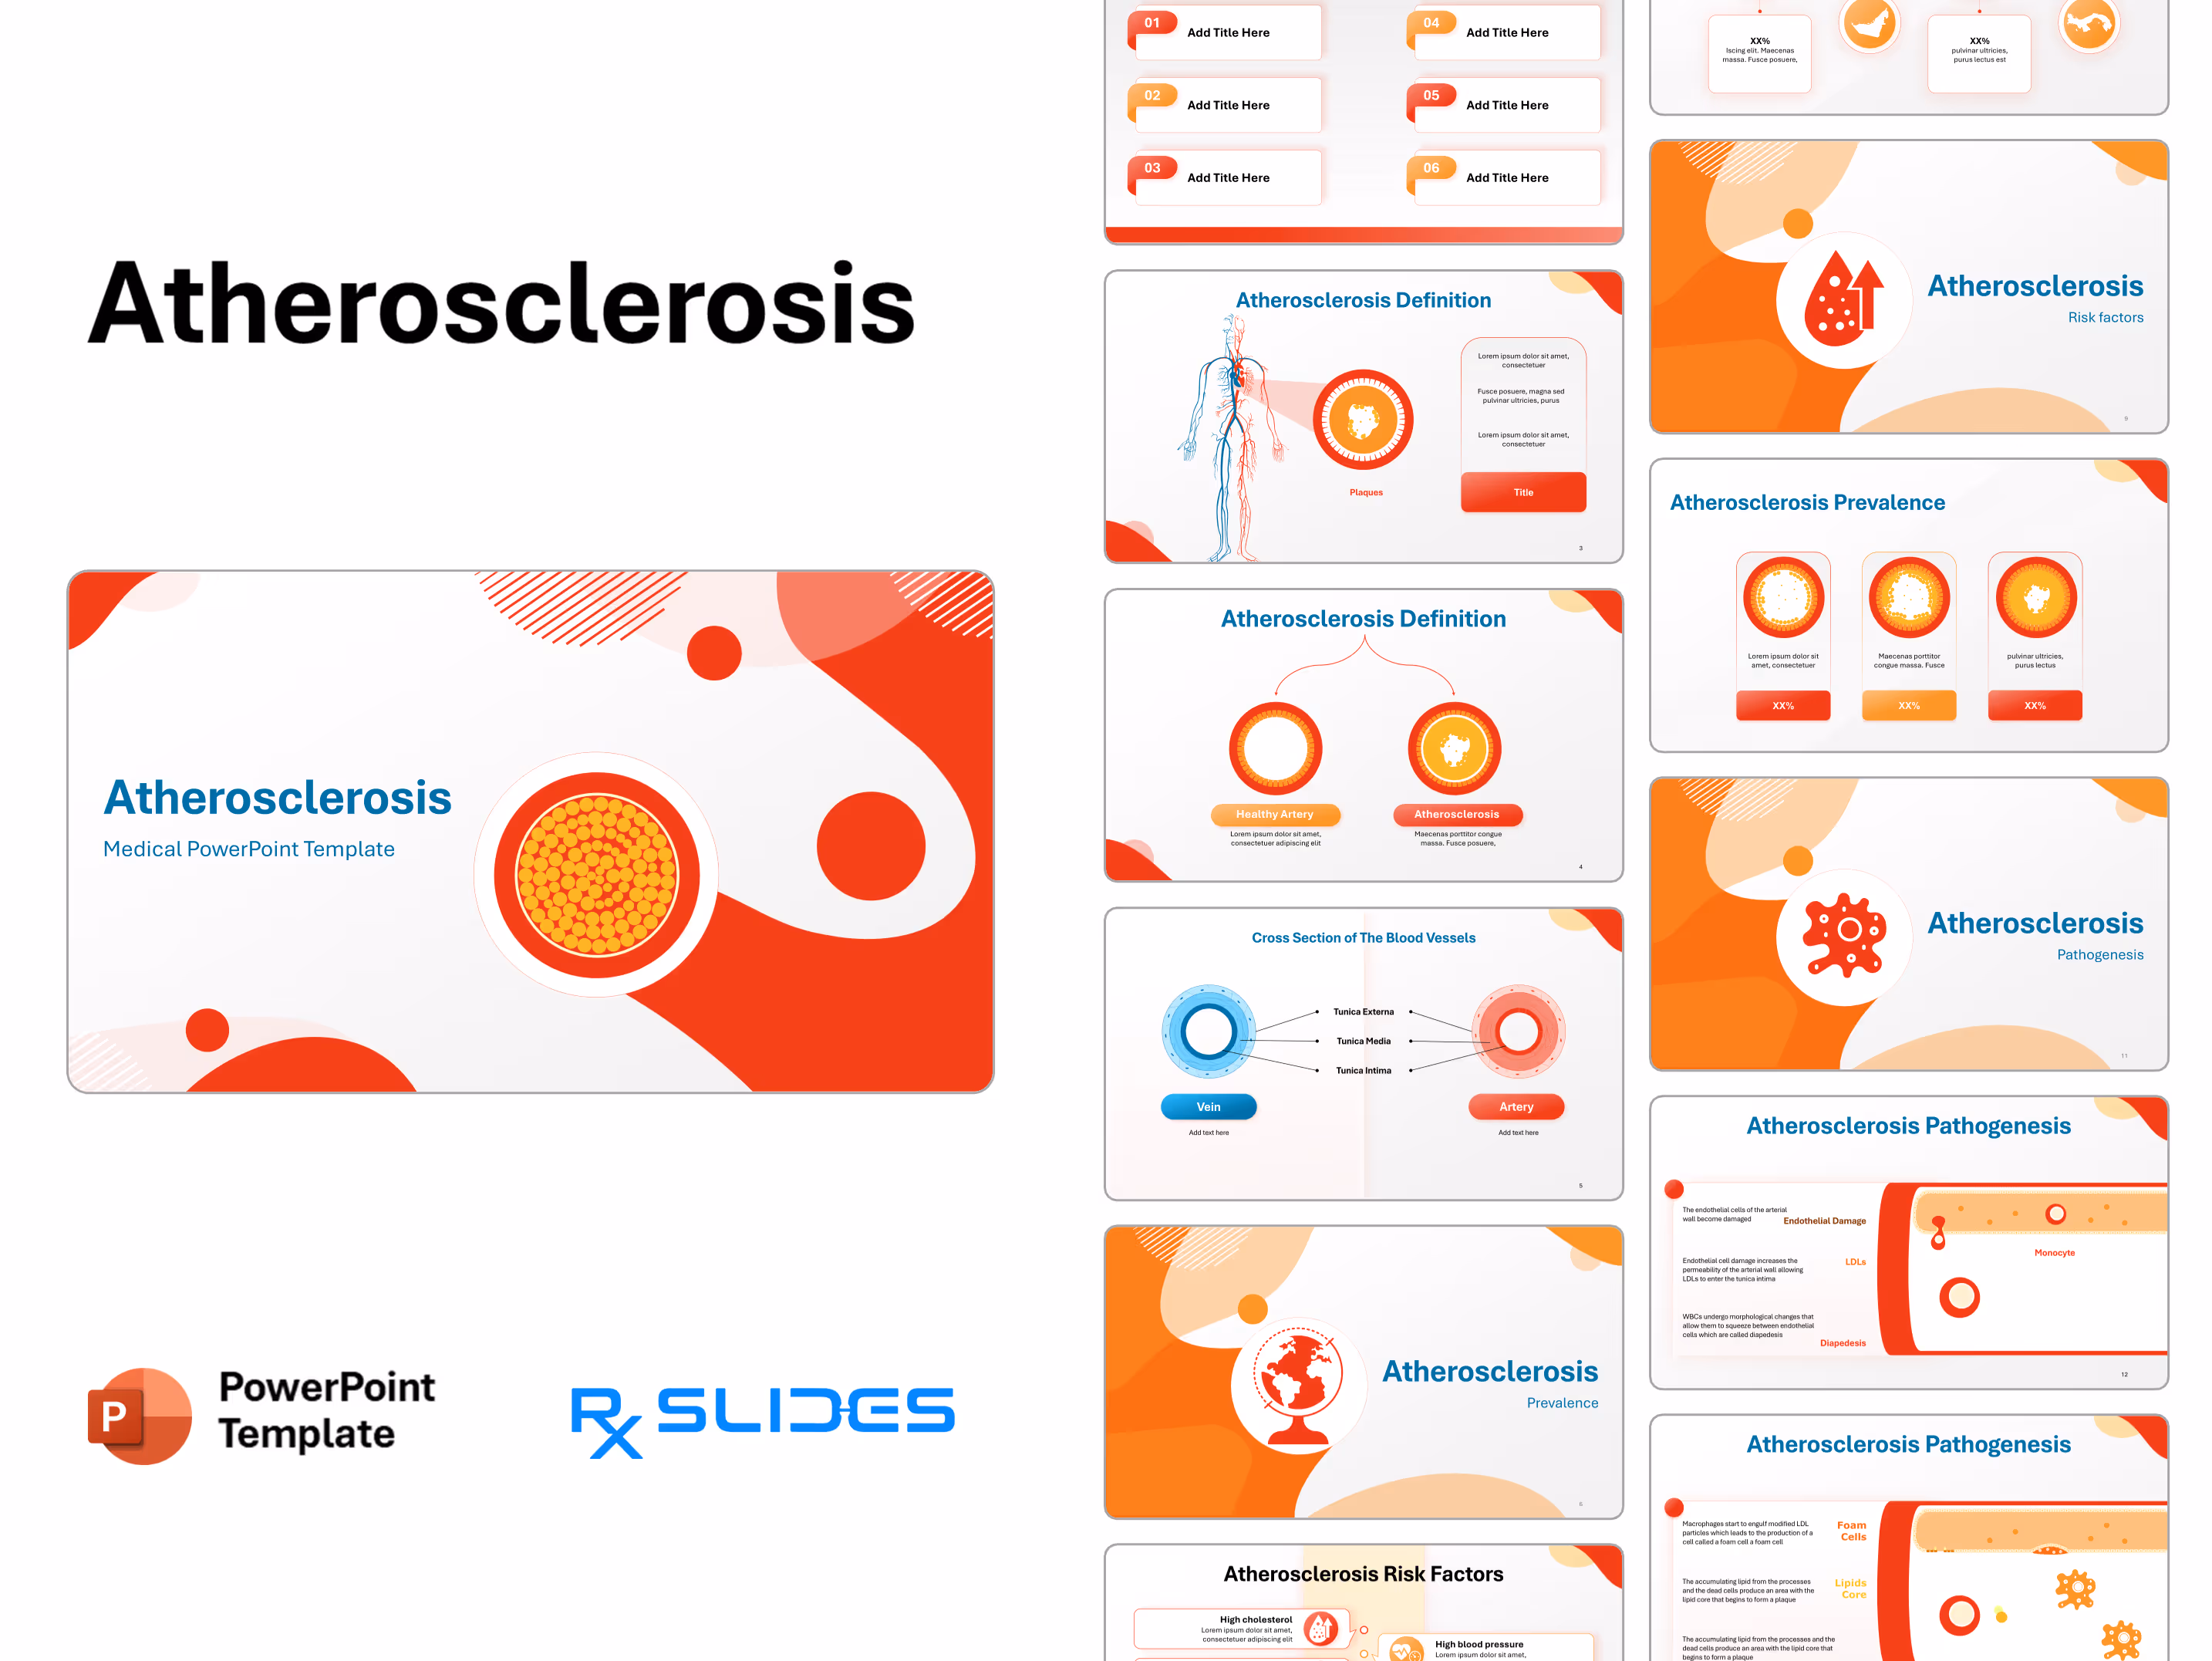
Atherosclerosis PowerPoint Template
Atherosclerosis : Medical Animated Template
- The Atherosclerosis PPT template is an animated medical PowerPoint template that will maximize the benefit of your explanation.
- RxSlides template, which includes medical animations and infographics, will attract your audience.
- We showed infographics to give your audience a dynamic and appealing Atherosclerosis presentation.
- From basic heart anatomy to complex disease processes, we offer a diverse range of animated heart disease PowerPoint templates to suit any cardiology topic.
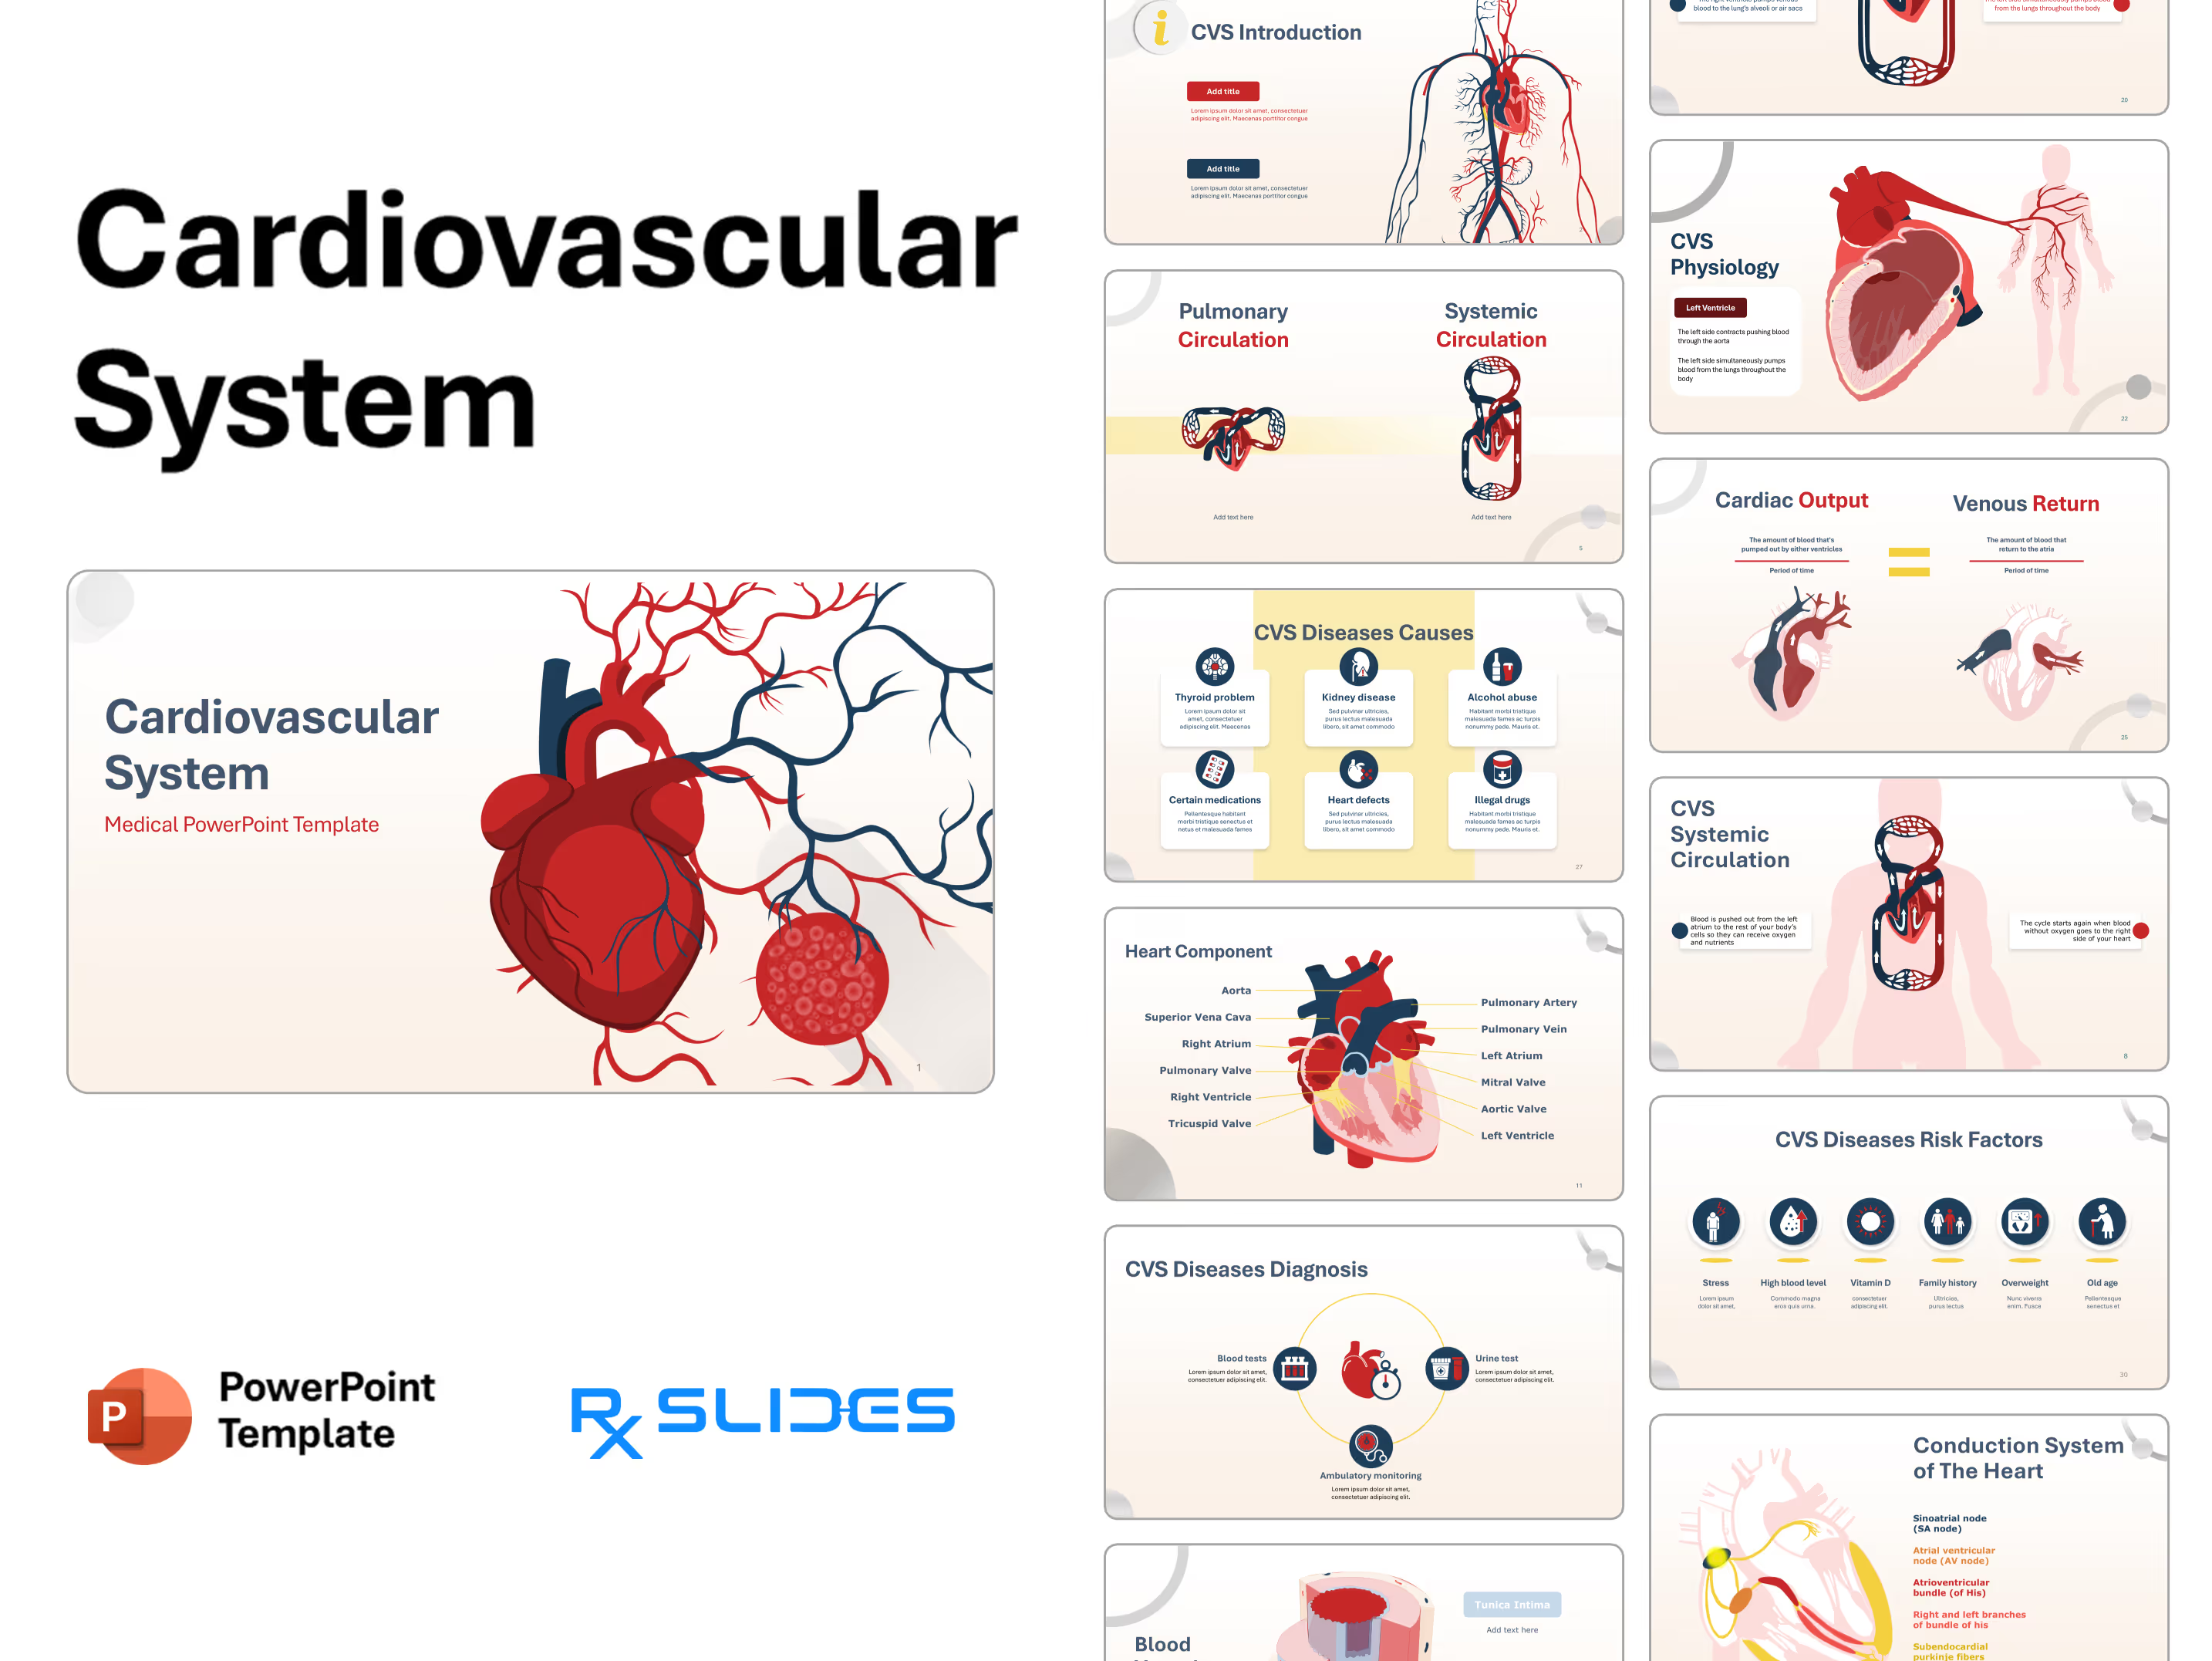
The Atherosclerosis PowerPoint Template Preview
The Atherosclerosis PowerPoint Template Content
Slide 1 - Atherosclerosis (Title Slide)
.avif)
This slide serves as the presentation's title page, clearly introducing the subject matter.
- The background features large, abstract shapes in red and white.
- A large, prominent circular graphic in the lower right illustrates a cross-section of an artery that is clogged with plaque (represented by yellow/orange circles). This visually defines the disease as the narrowing of a blood vessel due to plaque buildup.
Slide 2 - Agenda

This slide provides a structured, six-point layout for the presentation agenda, using the template's signature red and orange color palette.
- Six distinct, numbered callout boxes (01 to 06) are arranged in two columns.
- Each box contains the placeholder text "Add Title Here," allowing for customization of the following sections, which typically cover:
- Definition/Overview
- Causes/Risk Factors
- Pathophysiology (Plaque Formation)
- Symptoms/Complications
- Diagnosis
- Treatment/Prevention
Slide 3 - Atherosclerosis Definition
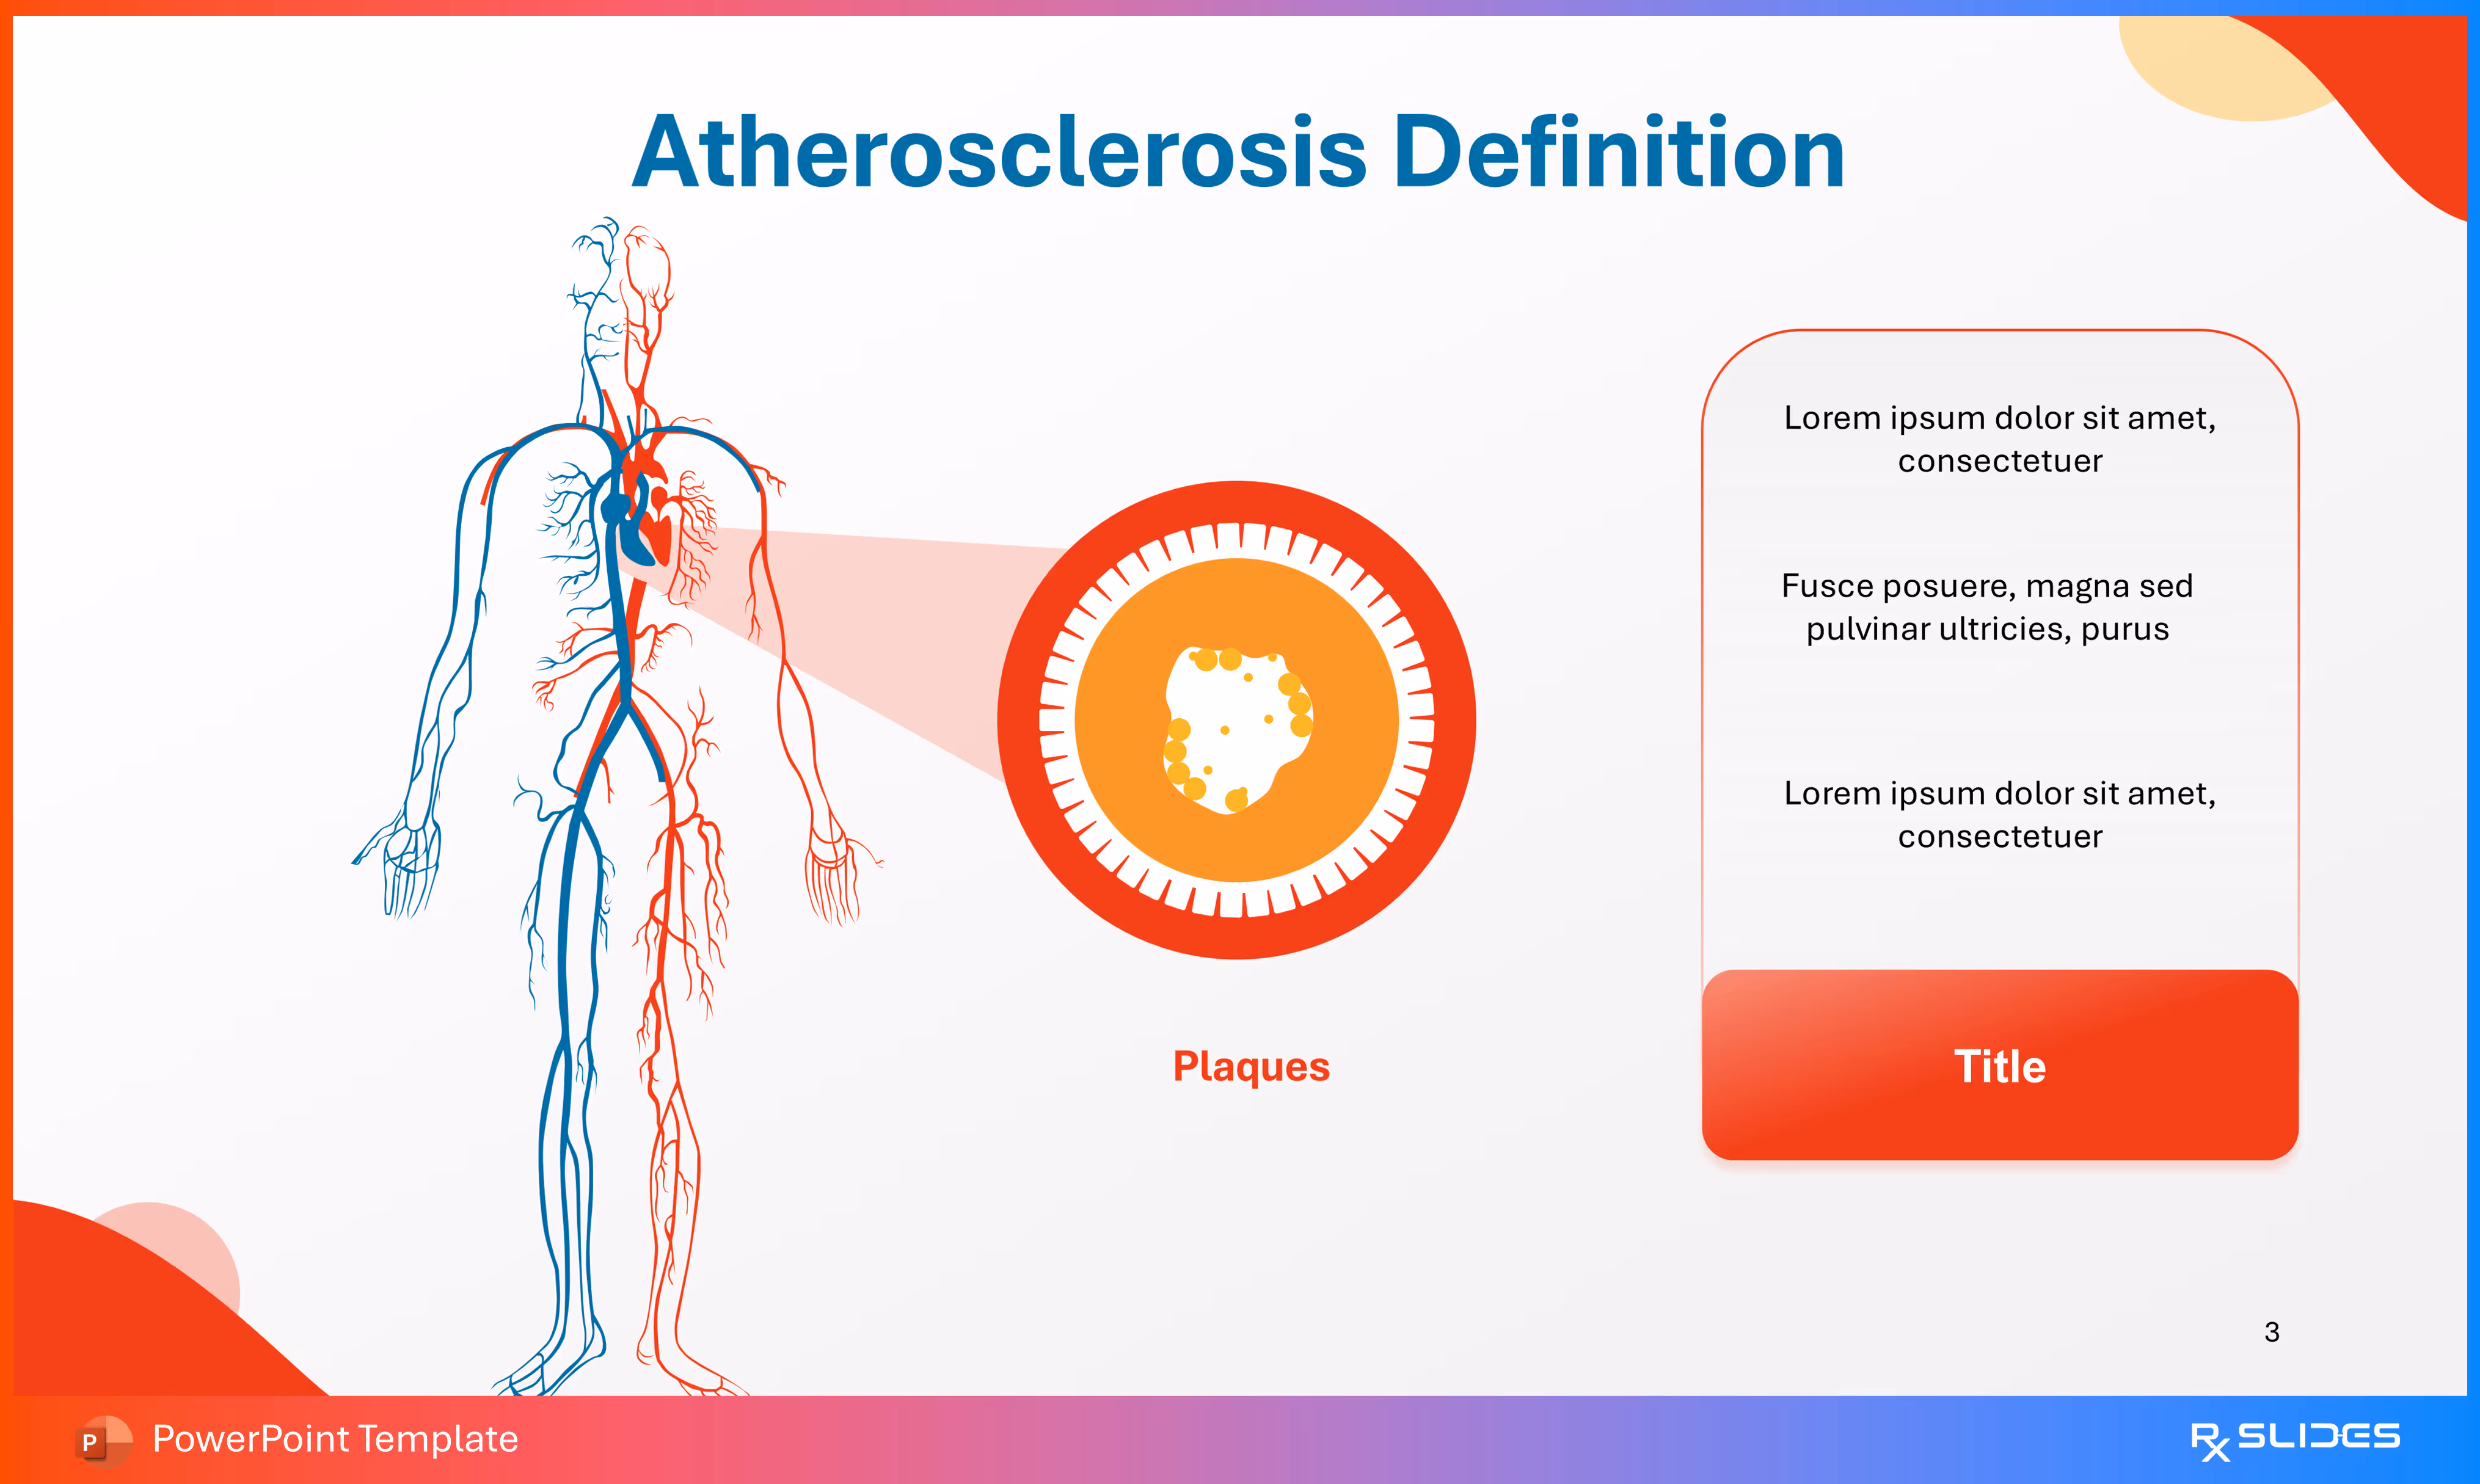
This slide provides the key anatomical illustration and definition for Atherosclerosis, explaining the disease process.
- A full-body outline shows the human circulatory system, with arteries (red) and veins (blue).
- A red circular callout with an orange center magnifies a segment of the artery, clearly showing the buildup of Plaques (yellow/orange material) that narrow the vessel.
- A text box on the right is reserved for the definition and key facts.
Slide 4 - Atherosclerosis Definition (Comparison)
.avif)
This slide uses a side-by-side comparison to visually and textually differentiate between a healthy artery and one exhibiting Atherosclerosis.
- Two circular illustrations are presented, connected by red curved lines leading from the title.
- Healthy Artery (Left): Labeled "Healthy Artery" with a large, clear white inner lumen, representing normal blood flow.
- Atherosclerosis (Right): Labeled "Atherosclerosis" with the inner lumen significantly narrowed and filled with yellow/orange plaque material.
Slide 5 - Cross Section of The Blood Vessels (Anatomy)
.avif)
This slide provides a detailed anatomical comparison of an artery and a vein, highlighting the layered structure of the vessel walls.
- Two diagrams show cross-sections of vessels side-by-side:
- Vein (Left): Illustrated in shades of blue.
- Artery (Right): Illustrated in shades of red.
- Anatomical Labels: Lines connect the layers of both vessels to their common names:
- Tunica Externa (Outermost layer).
- Tunica Media (Middle layer).
- Tunica Intima (Innermost layer, where plaque forms in atherosclerosis).
Slide 6 - Atherosclerosis: Prevalence (Section Divider)
.PNG)
This slide serves as a powerful section divider, transitioning the presentation into the epidemiology and scale of Atherosclerosis.
- A large, prominent red icon of a globe or world map is displayed on the left.
Slide 7 - Atherosclerosis Prevalence (Severity Infographic)
.avif)
This slide provides a visual flow illustrating the progression of atherosclerosis, using a side-by-side comparison of artery cross-sections with placeholder statistics.
- Three vertical cards, colored in a progression from red to orange to red, each feature a cross-section of a blood vessel:
- Stage 1 (Left): Shows a vessel with minimal plaque (small yellow dots), representing a low level of disease or a low prevalence statistic (XX%).
- Stage 2 (Center): Shows a moderate buildup of plaque, narrowing the lumen, representing an intermediate stage or a moderate statistic (XX%).
- Stage 3 (Right): Shows a vessel severely occluded with a large, unstable plaque, representing the most severe stage or a higher, critical statistic (XX%).
- The visual progression from left to right strongly suggests the increasing severity or the statistical distribution of the disease across different populations or age groups.
Slide 8 - Atherosclerosis Prevalence (Geographic Infographic)
.avif)
This slide provides a two-row layout using map icons to present placeholder prevalence statistics for different geographical regions.
- Four groups are presented, each consisting of a rectangular text box with a placeholder percentage (XX%) and a circular icon containing a stylized map outline.
- Top-Left: Placeholder text and XX% are linked to a map icon of France (Red).
- Bottom-Left: Placeholder text and XX% are linked to a map icon of the United Arab Emirates (UAE) (Orange).
- Top-Right: Placeholder text and XX% are linked to a map icon of the USA (Red).
- Bottom-Right: Placeholder text and XX% are linked to a map icon (Orange).
Slide 9 - Atherosclerosis: Risk Factors (Section Divider)
.avif)
This slide acts as a section divider, shifting the focus from the scope of the disease to its causes.
- A large red icon of a blood drop with white circles (representing blood components or fat globules) and an upward-pointing arrow is centrally featured.
- This icon strongly visualizes elevated blood components, such as cholesterol (hyperlipidemia) or blood pressure, directly linking to the core risk factors for atherosclerosis.
Slide 10 - Atherosclerosis Risk Factors (Six-Point List)
.avif)
This slide details six common risk factors for atherosclerosis, organized in two vertical columns (left in red/red-orange, right in orange).
- The Seven Risk Factors (Left Column - Red/Red-Orange):
- High cholesterol: Features an icon of food and droplets, suggesting high-fat intake.
- Family history: Features an icon of a family/people silhouette.
- Lack of exercise: Features an icon of a wheelchair, symbolizing limited mobility or sedentary lifestyle.
- Diabetes: Features an icon of a hand pricking a finger to check blood sugar.
- High blood pressure: Features an icon of a heartbeat line and a heart.
- Old age: Features an icon of an elderly person with a cane.
- Diet high in saturated fat: Features an icon of a stack of food, like a burger or sandwiches.
Slide 11 - Atherosclerosis: Pathogenesis (Section Divider)
.avif)
This slide serves as a section divider, pivoting the presentation from the risk factors to the actual biological process of the disease.
- A large, prominent red icon resembling a cell, with white inner components is featured on the left.
Slide 12 - Atherosclerosis Pathogenesis (Early Steps)
.avif)
This slide uses a flow diagram integrated with an artery cross-section to illustrate the early stages of plaque formation.
- The right side features a magnified cross-section of an artery wall, showing the lumen (top) and layers below.
- The left side lists the steps in chronological order.
- The Three Early Steps:
- Endothelial Damage: "The endothelial cells of the arterial wall become damaged".
- LDLs (Lipid Entry): "Endothelial cell damage increases the permeability of the arterial wall allowing LDLs to enter the tunica intima". The diagram shows orange circles (LDLs) entering the vessel wall.
- Diapedesis (WBC Entry): "WBCs undergo morphological changes that allow them to squeeze between endothelial cells which are called diapedesis". The diagram shows a large cell (Monocyte, representing a White Blood Cell/WBC) near the artery wall.
Slide 13 - Atherosclerosis Pathogenesis (Plaque Formation)
.avif)
This slide completes the pathological explanation, detailing the formation of foam cells and the core of the mature plaque.
- The right side continues the magnified cross-section of the artery wall.
- The diagram now shows amoeba-like shapes (Macrophages) consuming the smaller orange circles (LDLs).
- The Later Steps:
- Foam Cells: "Macrophages start to engulf modified LDL particles which leads to the production of a cell called a foam cell a foam cell". The resulting, larger, irregularly shaped cells in the diagram are likely the foam cells.
- Lipids Core: "The accumulating lipid from the processes and the dead cells produce an area with the lipid core that begins to form a plaque". This explains the growth of the atherosclerotic plaque, which is primarily a lipid core covered by a fibrous cap.
- Plaque Formation (Repetitive Text): The slide repeats the previous description: "The accumulating lipid from the processes and the dead cells produce an area with the lipid core that begins to form a plaque".
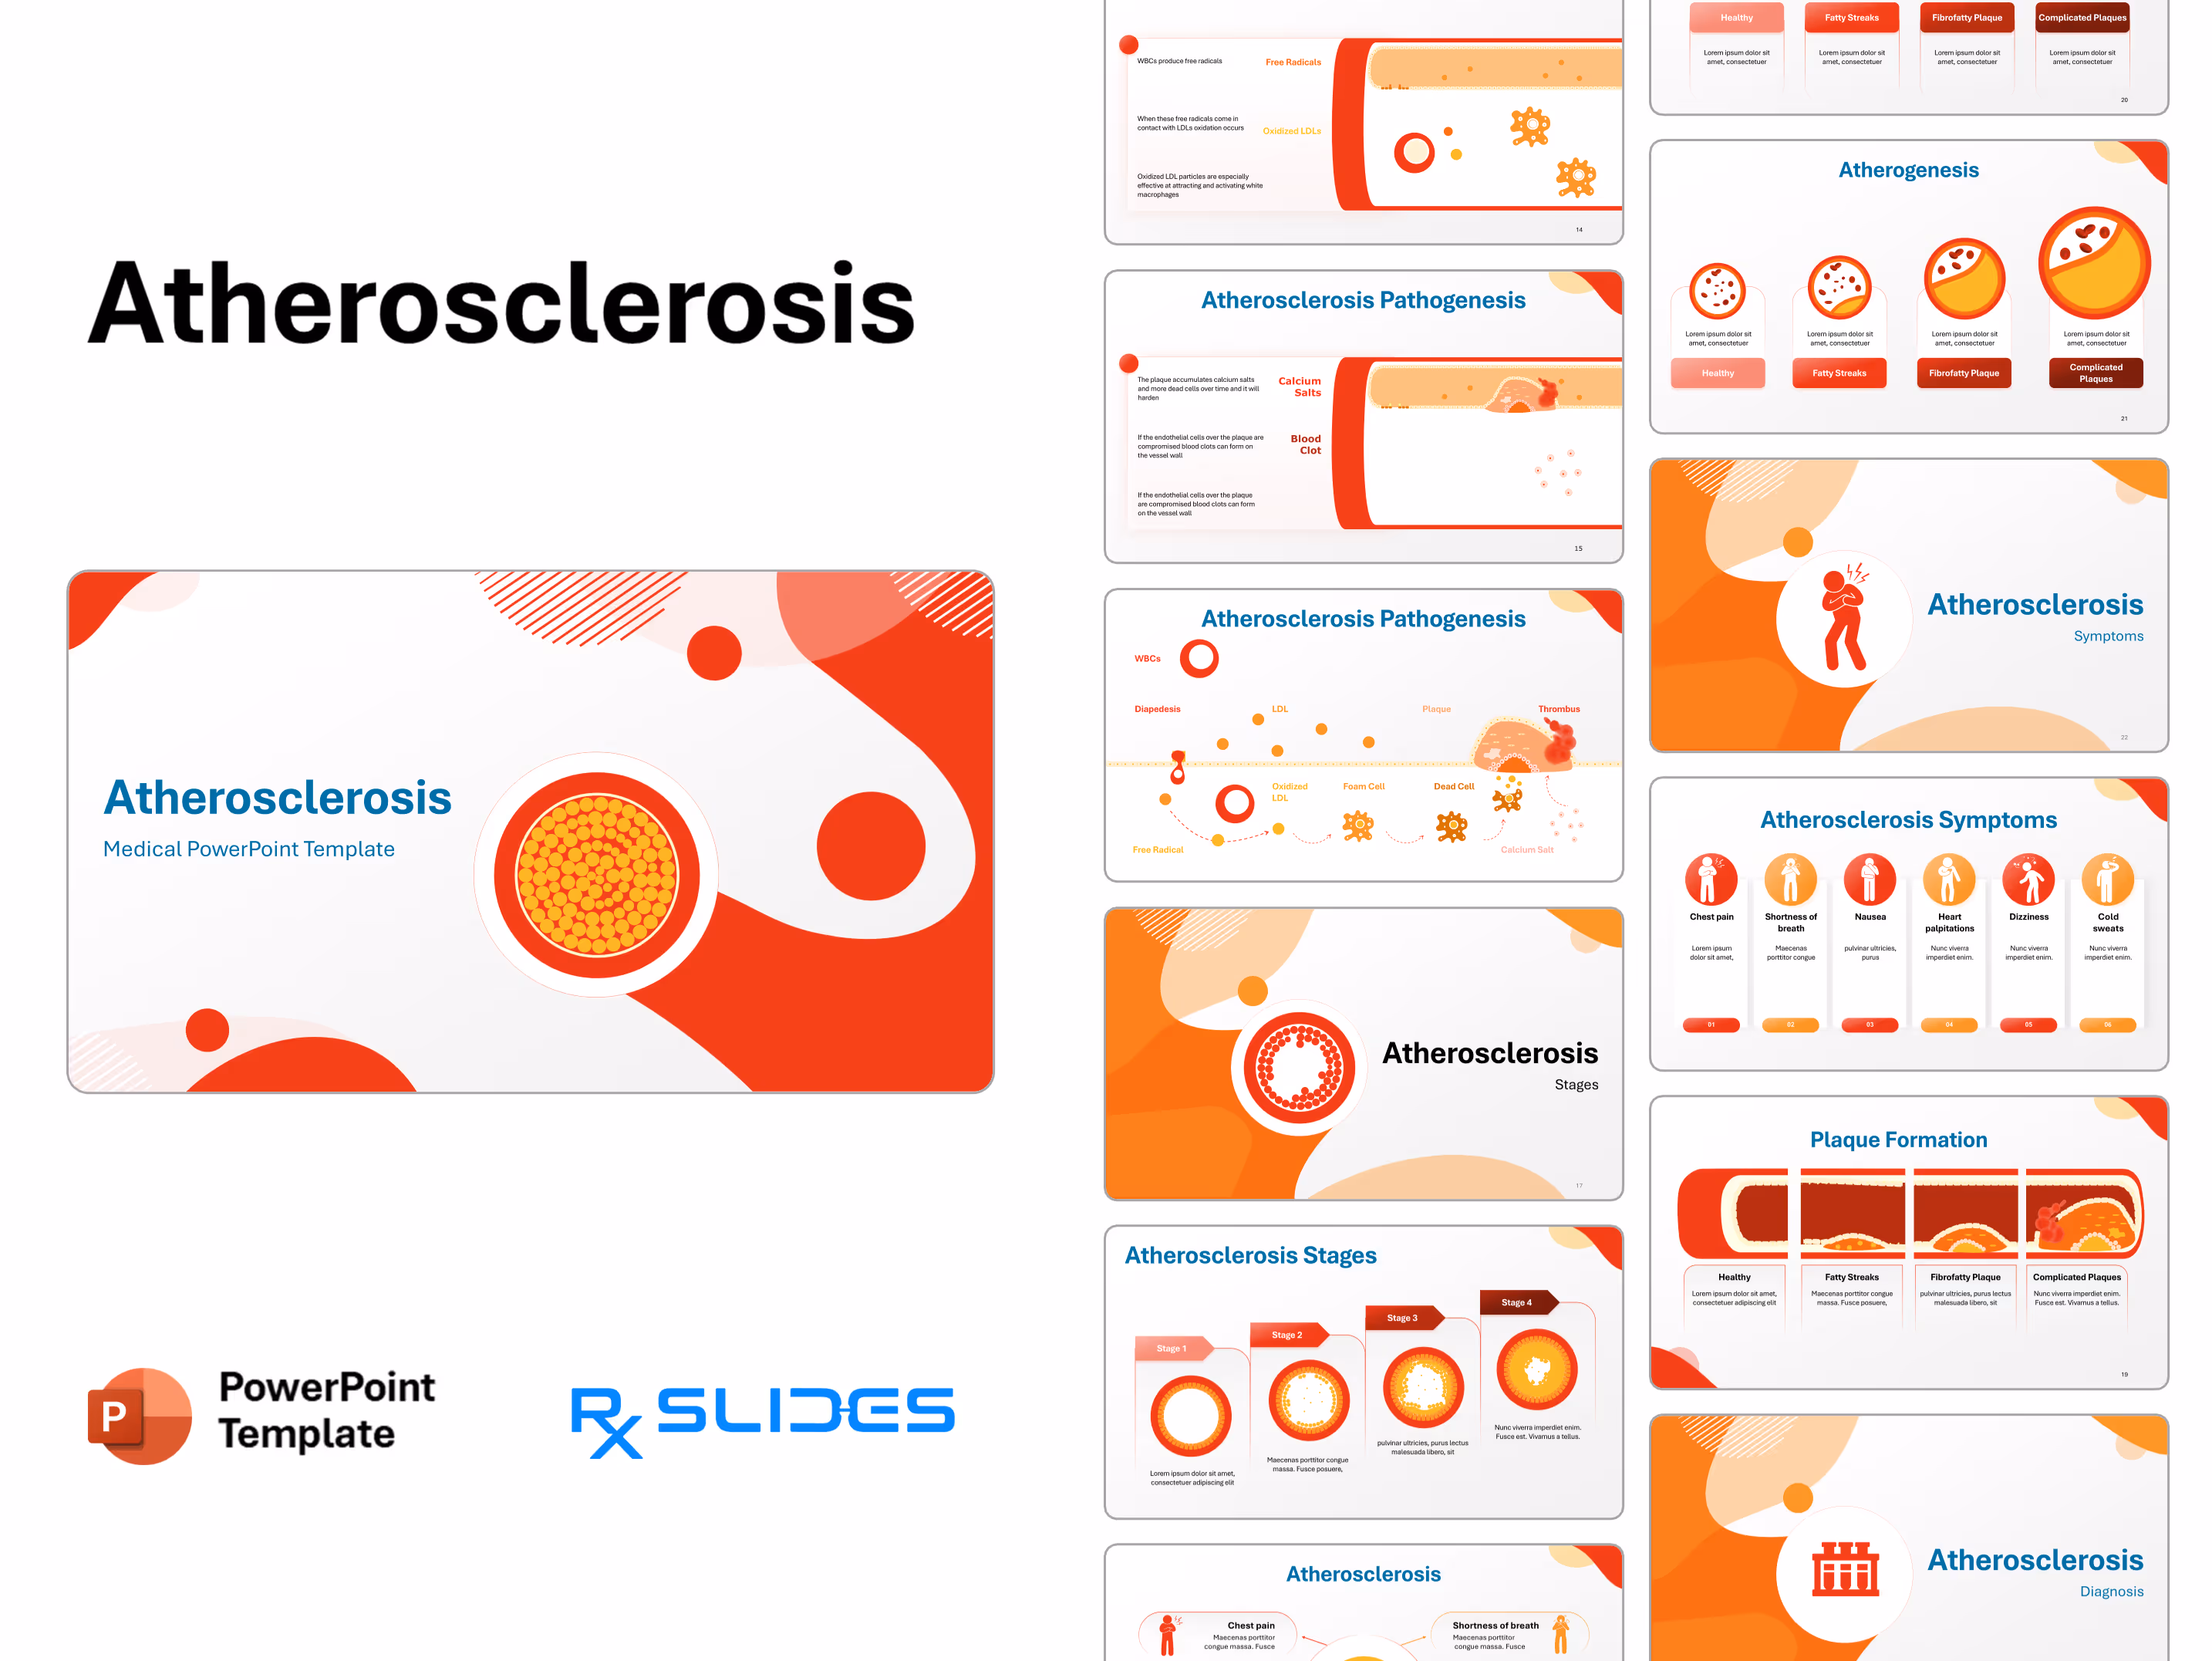
Slide 14 - Atherosclerosis Pathogenesis (Oxidation Step)
.avif)
This final pathogenesis slide emphasizes the critical chemical reaction—lipid oxidation—that drives the inflammatory response and subsequent plaque growth.
- The magnified artery cross-section is again shown, which is now populated with LDLs, Monocytes, and Foam Cells.
- The Oxidation Sequence:
- Free Radicals: "WBCs produce free radicals".
- Oxidized LDLs: "When these free radicals come in contact with LDLs oxidation occurs". This oxidation makes the lipids far more inflammatory.
- Activation: "Oxidized LDL particles are especially effective at attracting and activating white macrophages". This step explains the continuous cycle of inflammation and lipid accumulation, as the activated macrophages engulf the oxidized lipids, becoming more foam cells.
Slide 15 - Atherosclerosis Pathogenesis (Late Stages/Complications)
.avif)
This slide illustrates the final, dangerous stages of the plaque: hardening and rupture/thrombosis.
- The right side continues the magnified artery cross-section.
- The diagram now shows a mature plaque that is partially calcified and potentially unstable, with a blood clot forming on its surface.
- The Final Steps/Complications:
- Calcium Salts: "The plaque accumulates calcium salts and more dead cells over time and it will harden".
- Blood Clot (Thrombosis): "If the endothelial cells over the plaque are compromised blood clots can form on the vessel wall".
- Repetitive Text: The slide repeats the blood clot description for emphasis. The formation of a blood clot (thrombosis) is the primary mechanism that leads to acute events like heart attack or stroke.
Slide 16 - Atherosclerosis Pathogenesis (Summary Diagram)
.avif)
This slide offers a comprehensive, visually rich summary of the entire disease development cycle, from initial inflammation to final thrombus formation.
- A single, large diagram shows the cross-section of an artery wall with a flow path illustrating all major steps.
- Initial Steps: Shows WBCs (White Blood Cells/Monocytes) and Diapedesis.
- Oxidation Cycle: Shows Free Radical production leading to Oxidized LDL.
- Plaque Formation: Shows Foam Cells, Dead Cells, the mature Plaque structure, and Calcium Salt accumulation.
- Complication: Clearly shows a large Thrombus (blood clot) forming on the ruptured surface of the plaque.
Slide 17 - Atherosclerosis: Stages (Section Divider)
.avif)
This slide serves as a section divider, transitioning the focus from the microscopic process to the clinically defined progression or Stages of atherosclerosis.
- A large, prominent red and white icon is featured on the left, which is a magnified cross-section of an artery.
- The artery's lumen is significantly narrowed by a buildup of red-orange material (representing the plaque), strongly symbolizing the progressive nature and restriction of blood flow associated with advanced Stages of the disease.
Slide 18 - Atherosclerosis Stages (Progression Diagram)
.avif)
This slide uses a sequential, four-panel graphic to show the visual and pathological progression of plaque buildup in an artery.
- Four columns, numbered Stage 1 through Stage 4, each contain a cross-section of an artery illustrating increasing severity.
- Stage 1 (Left): Shows a healthy artery with a wide-open lumen and no discernible plaque accumulation.
- Stage 2: Shows the beginning of plaque deposition, with small yellow dots forming underneath the inner lining (the fatty streak/early plaque).
- Stage 3: Shows a significantly thicker, more mature plaque layer surrounding the vessel, leading to noticeable lumen narrowing.
- Stage 4 (Right): Shows a highly advanced plaque that severely occludes the lumen, with calcification or rupture suggested by the white, irregular internal structure, representing the most critical stage.
Slide 19 - Plaque Formation (Longitudinal Staging)
.avif)
This slide provides an alternative, more anatomical view of the four stages of atherosclerosis, focusing on the changes in the inner vessel wall (longitudinal view).
- Four sequential panels show a longitudinal (lengthwise) section of an artery wall, illustrating the buildup of plaque from a small bump to a complicated lesion.
- Healthy (Left): Shows a smooth, clear artery wall.
- Fatty Streaks: Shows a small, flat accumulation of yellowish material beneath the endothelium.
- Fibrofatty Plaque: Shows a larger, more distinct plaque that protrudes into the vessel lumen and has a fibrous cap.
- Complicated Plaques (Right): Shows a large, often ruptured or unstable plaque with a blood clot (thrombus) on top of it, representing the dangerous stage of acute cardiovascular events.
Slide 20 - Atherosclerotic Progression (Cross-Sectional Staging)
.avif)
This slide provides a third visual option for illustrating the stages of atherosclerosis, focusing on the contents within the artery's lumen (the blood).
- Four circular cross-sections of an artery are shown, moving from a healthy state to a complicated one. Unlike Slide 18, the lumen is filled with red cells (representing blood flow).
- Healthy (Left): Shows a wide-open lumen with a uniform distribution of red cells.
- Fatty Streaks: Shows small plaque formation at the edges, slightly impacting the flow area.
- Fibrofatty Plaque: Shows significant plaque buildup, narrowing the central channel and restricting the red cell flow.
- Complicated Plaques (Right): Shows severe occlusion of the lumen by a large plaque, with minimal space left for blood to pass, vividly representing the final, critical stage of the disease.
Slide 21 - Atherogenesis (Cross-Sectional Staging)
.avif)
This slide provides a fourth visual option for illustrating the stages of atherosclerosis, focusing on the contents within the artery's lumen (the blood).
- Four circular cross-sections of an artery are shown, moving from a healthy state to a complicated one.
Slide 22 - Atherosclerosis: Symptoms (Section Divider)
.avif)
This slide serves as a section divider, pivoting the presentation from the theoretical progression of the disease (Stages) to its clinical presentation in patients (Symptoms).
- A large, prominent red icon on the left depicts a human figure clutching their chest, with jagged lines radiating from the area. This icon is the universal symbol for chest pain (angina) or a heart attack, which are the most critical symptoms resulting from atherosclerosis in the coronary arteries.
Slide 23 - Atherosclerosis Symptoms
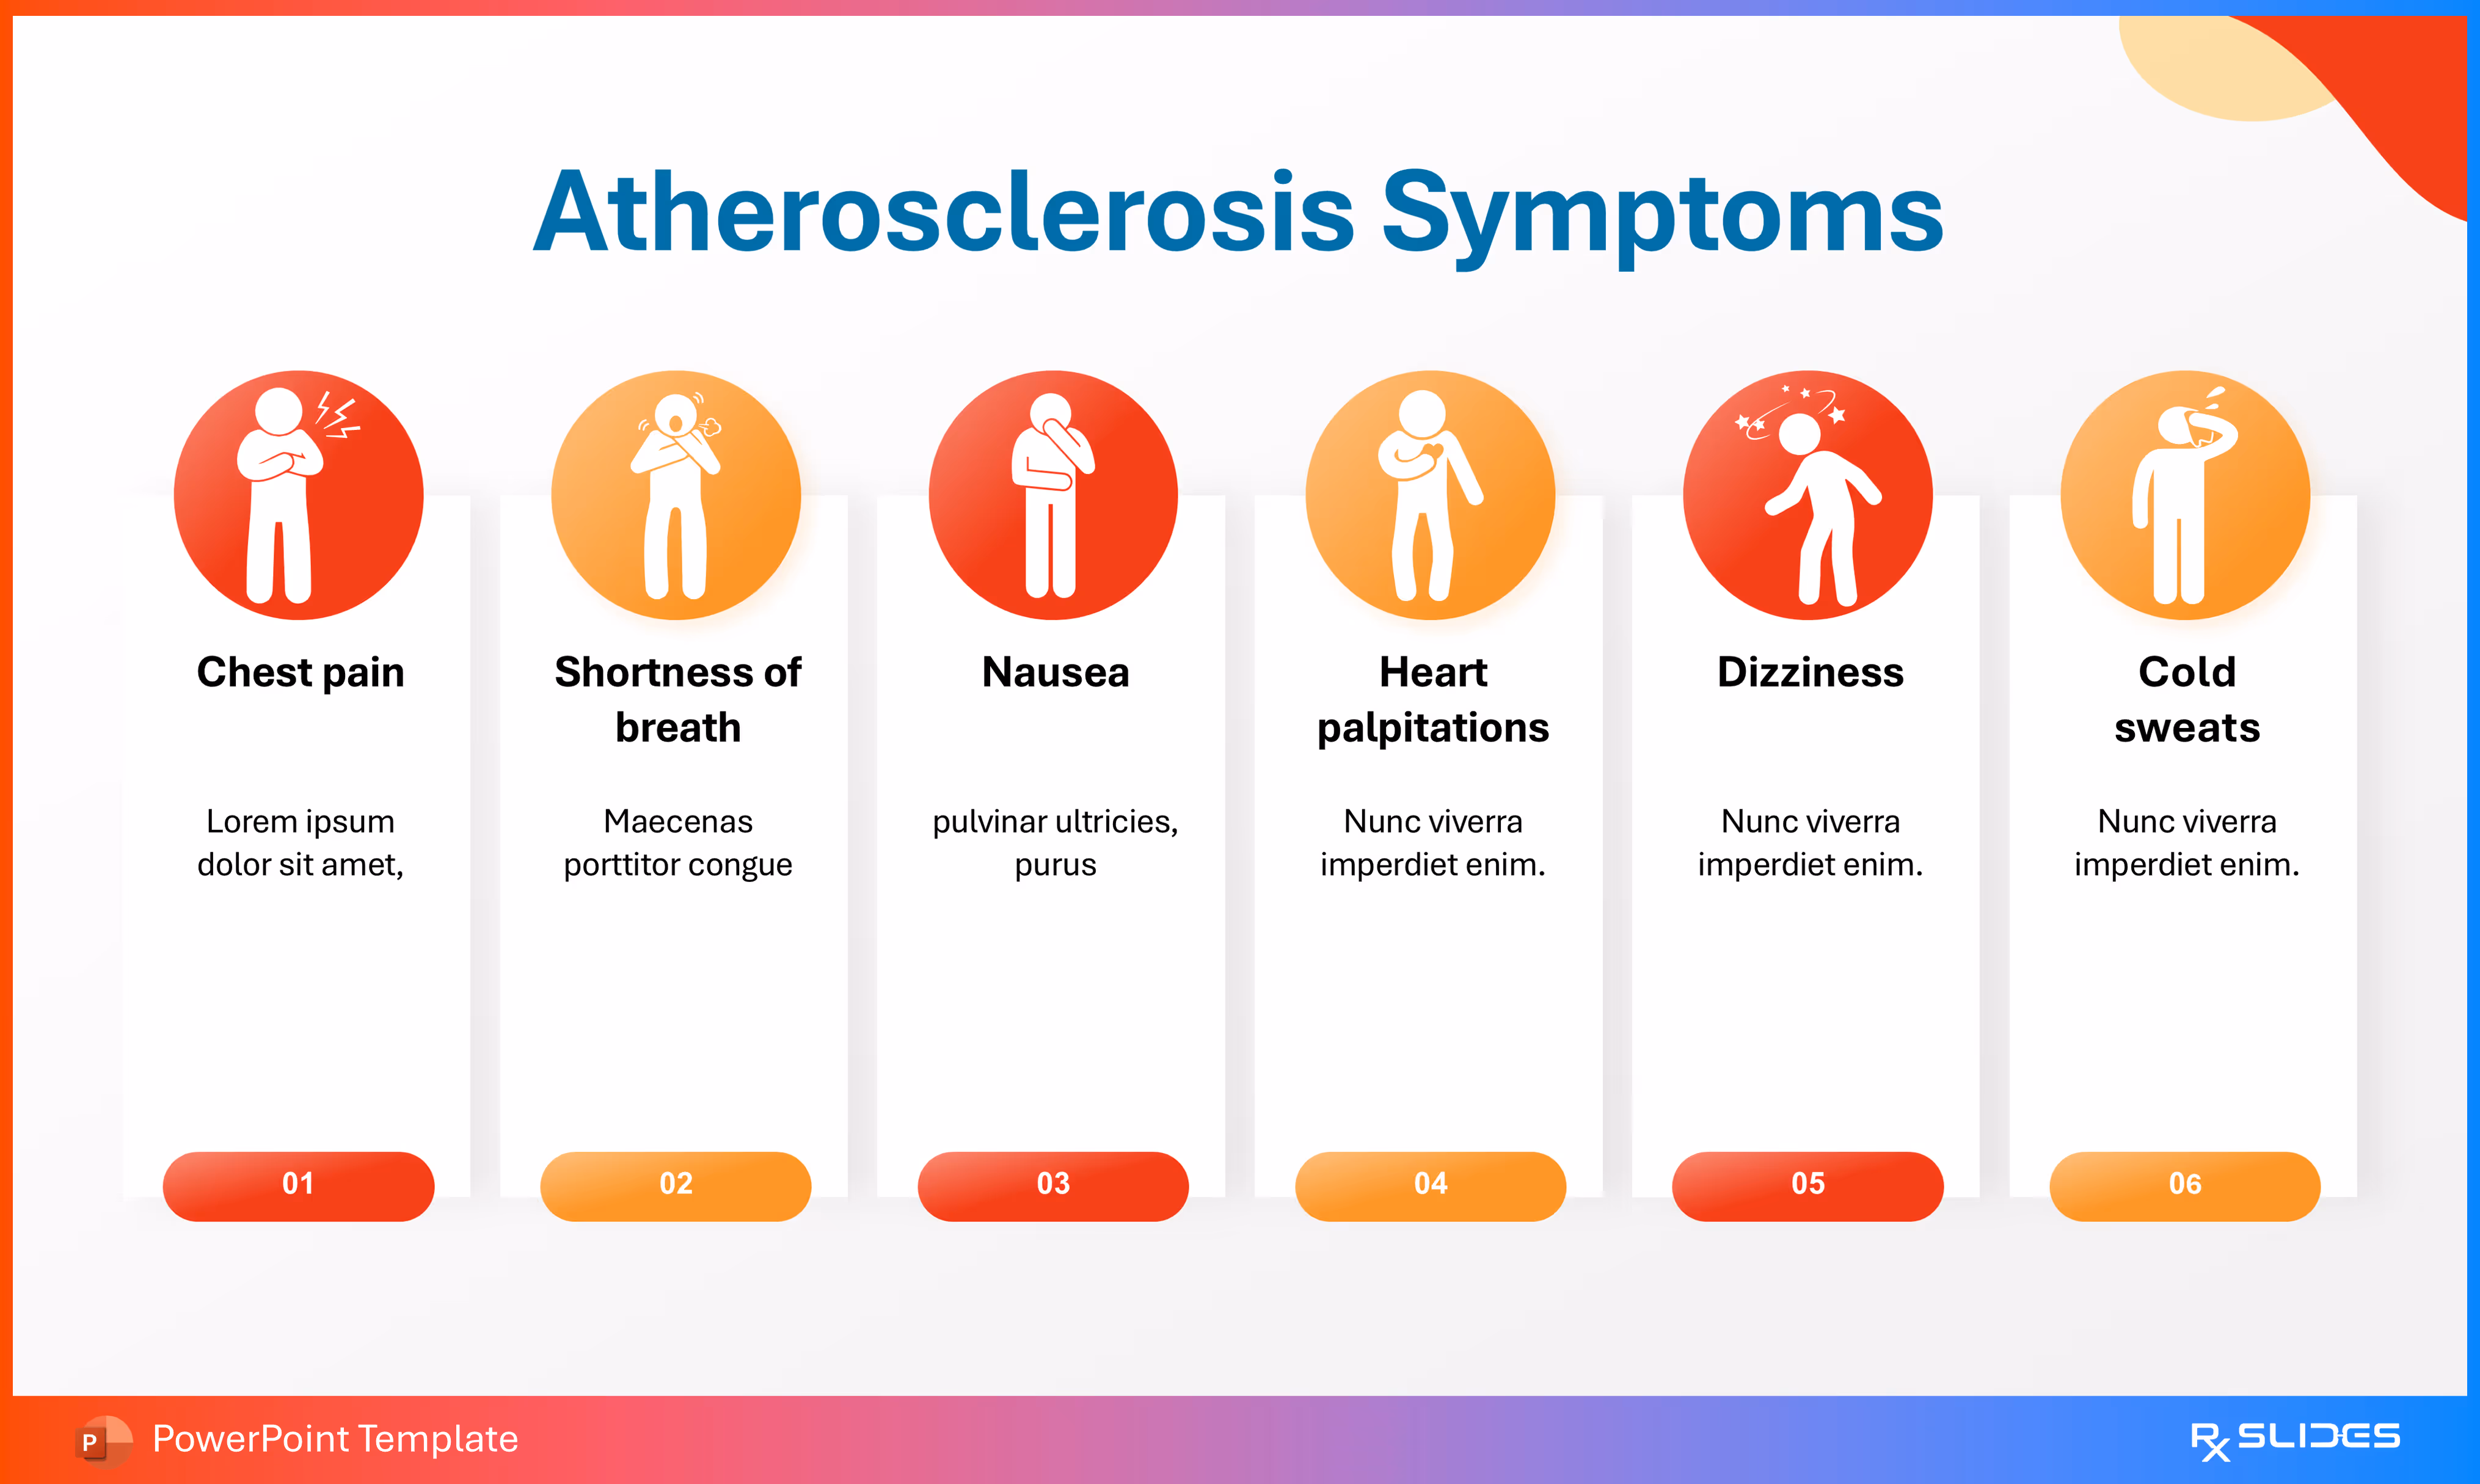
This slide lists six key symptoms that may occur when atherosclerosis affects different parts of the circulatory system, particularly the coronary arteries.
- Six distinct columns display an icon, a symptom title, and a placeholder text box. The colors transition from red to orange, matching the template theme.
- The Six Symptoms Listed:
- Chest pain.
- Shortness of breath.
- Nausea.
- Heart palpitations.
- Dizziness.
- Cold sweats.
Slide 24 - Atherosclerosis Symptoms (Infographic Flow)
.avif)
This slide provides an alternative, centralized infographic for listing the six key symptoms of atherosclerosis.
- A central circular hub labeled "Symptoms" is connected by arrows to six distinct callout boxes, each containing an icon and a symptom title.
- The layout emphasizes the relationship of all symptoms to the central disease state.
- The symptoms are the same as on the previous list slide, but presented in a flow: Chest pain, Shortness of breath, Nausea, Heart palpitations, Dizziness, and Cold sweats.
Slide 25 - Atherosclerosis: Diagnosis (Section Divider)
.avif)
This slide serves as a section divider, shifting the presentation's focus from symptoms to the medical procedures used to identify the disease.
- The icon features a stylized representation of three test tubes in a rack.
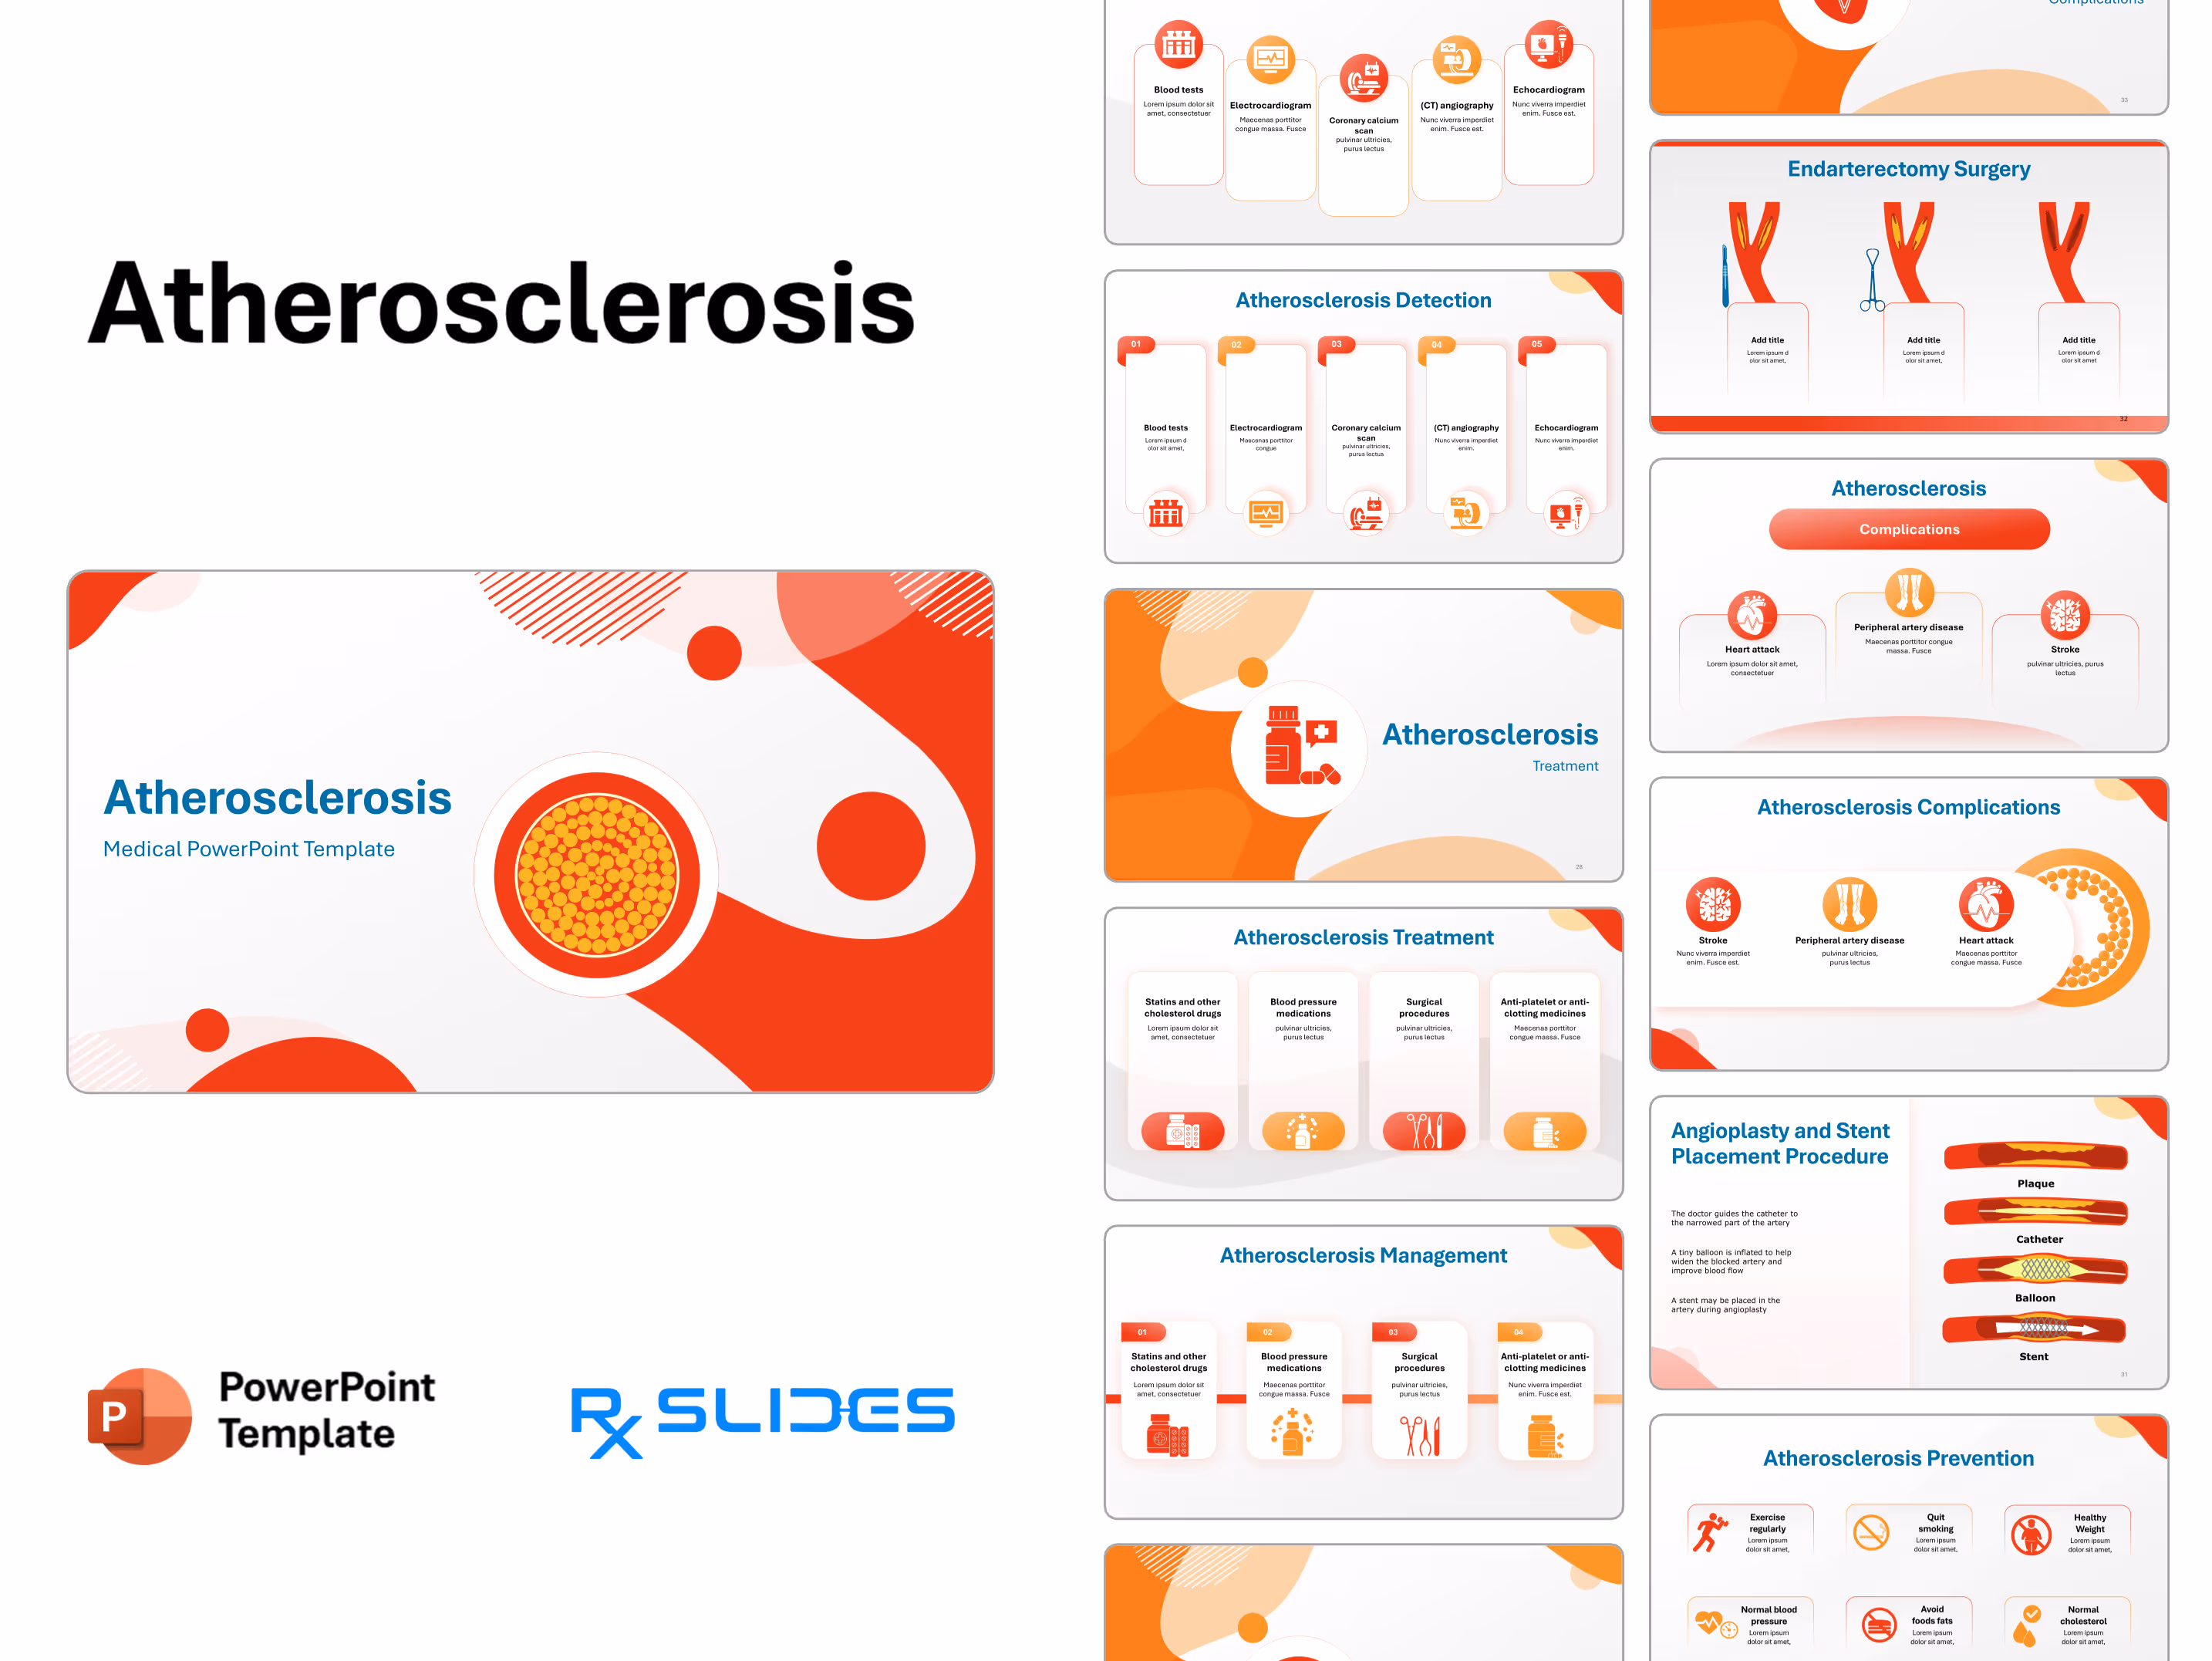
Slide 26 - Atherosclerosis Diagnosis
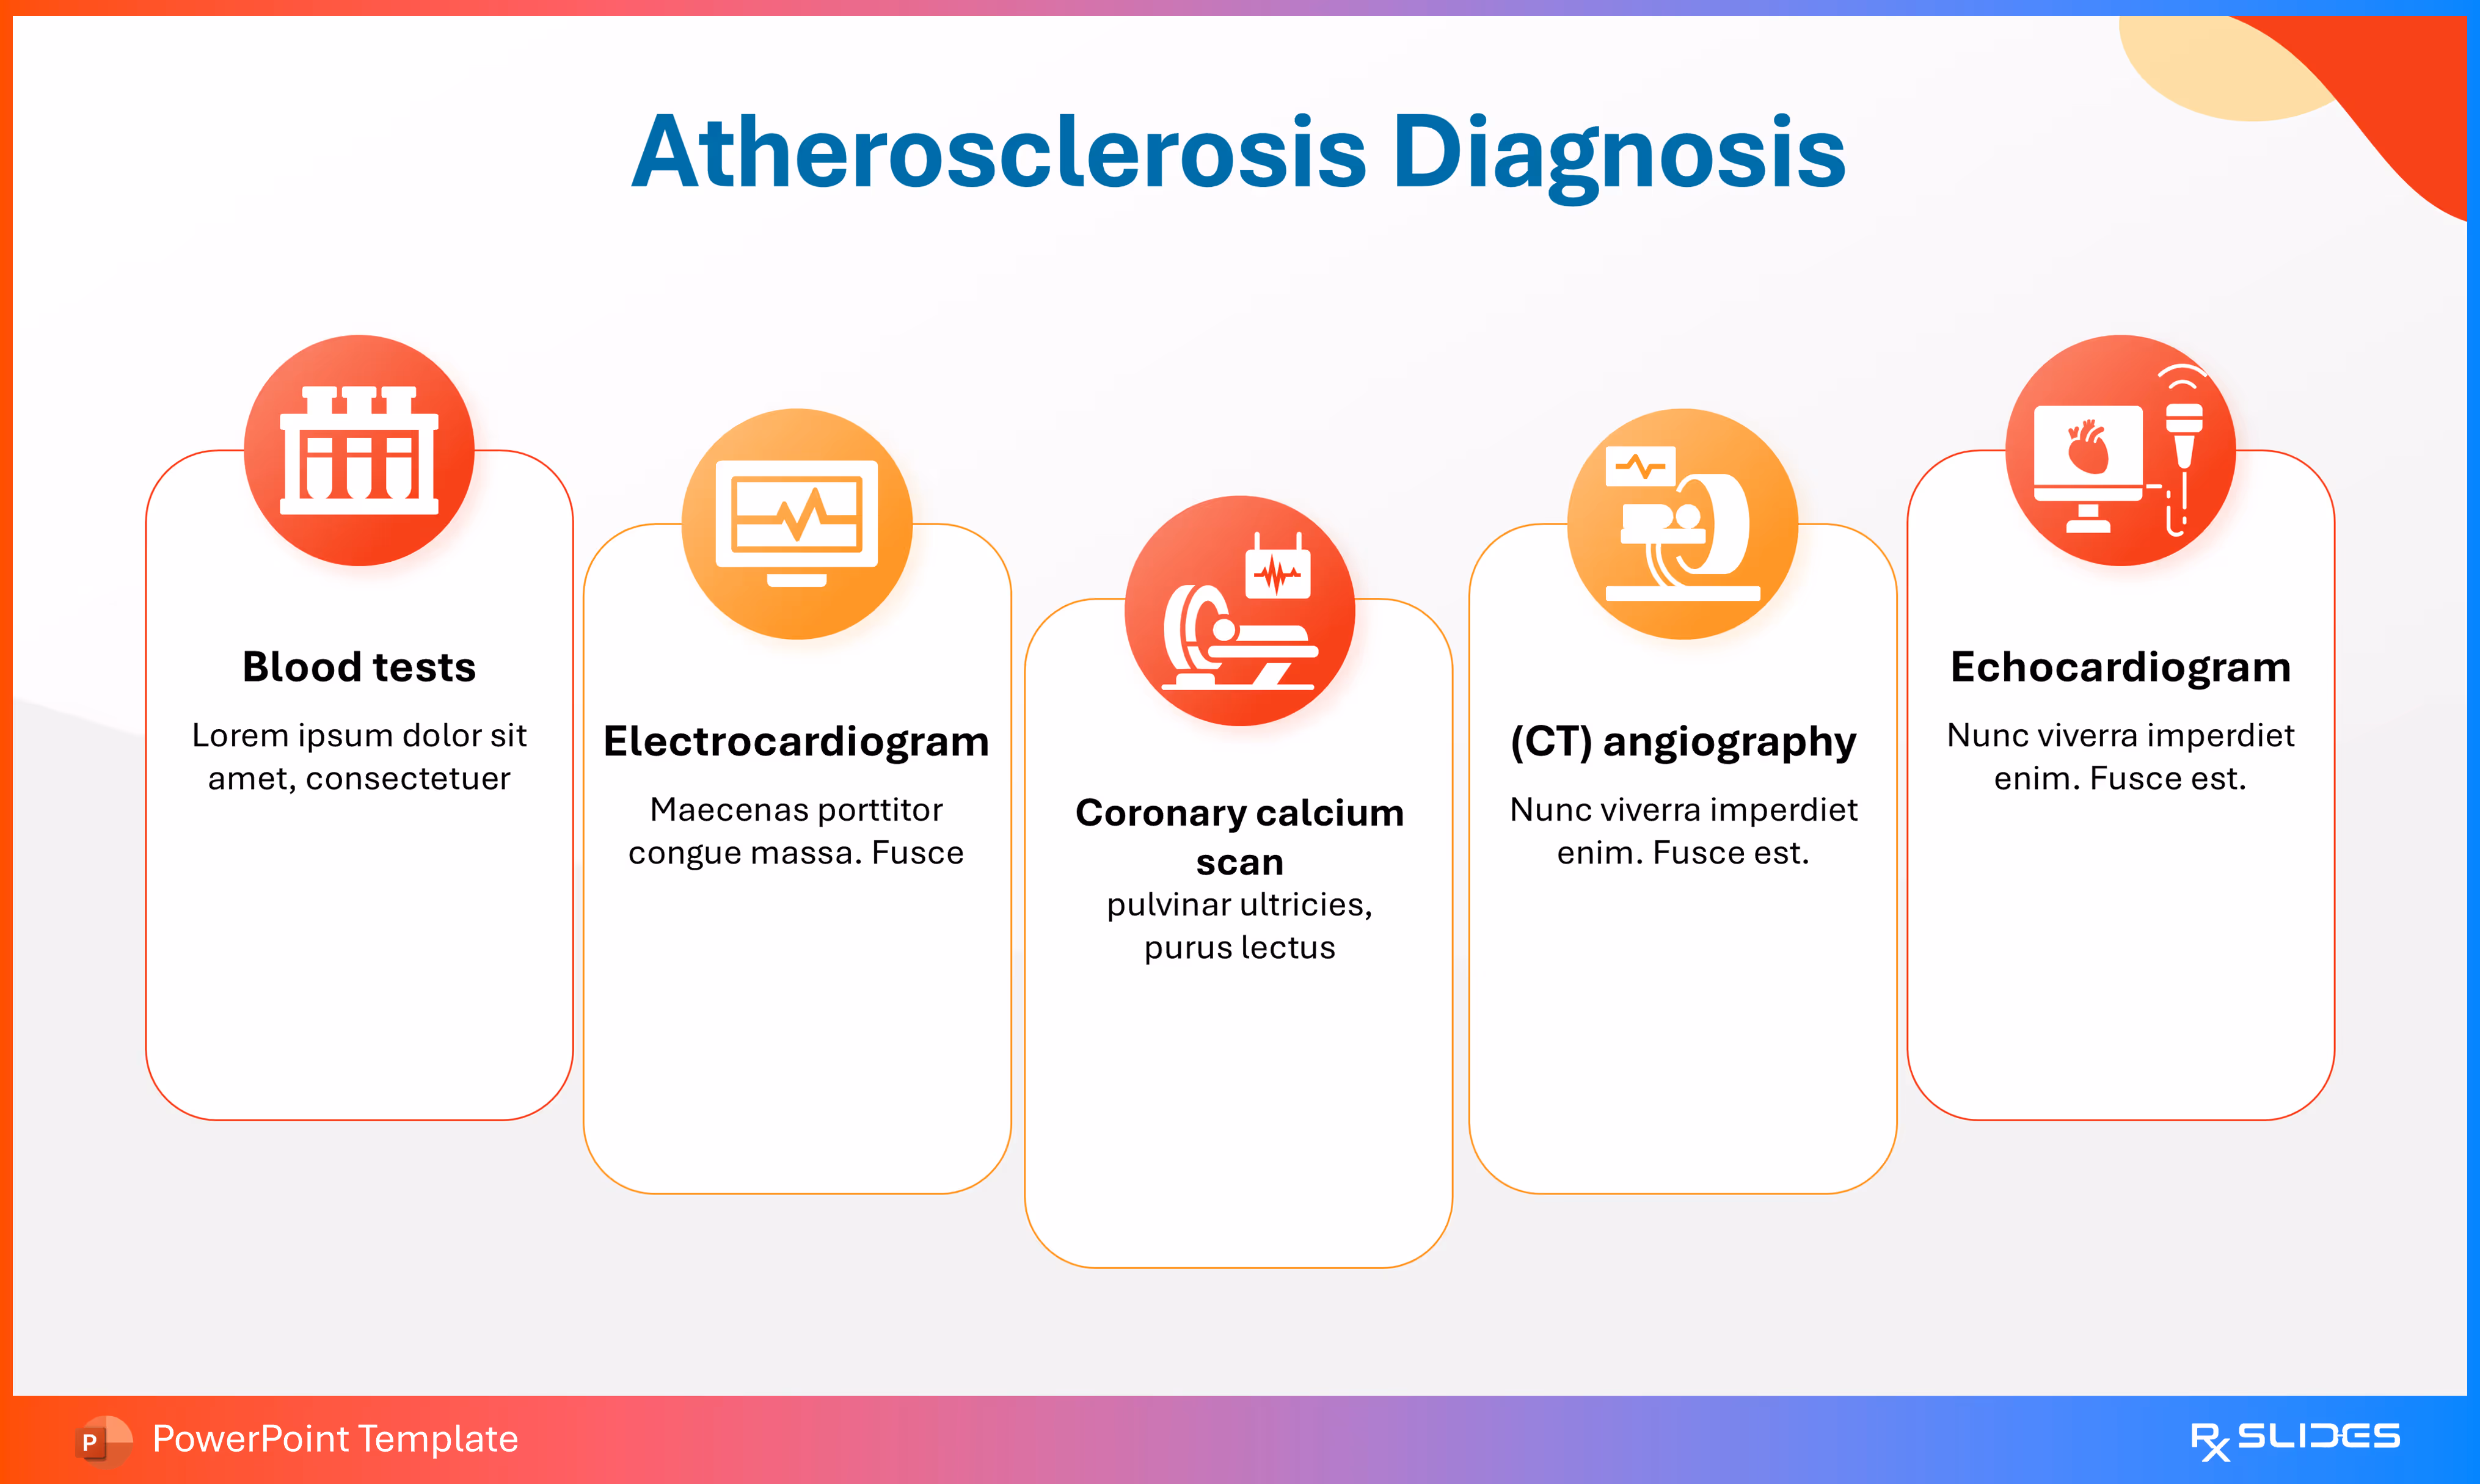
This slide lists five common diagnostic tools and procedures used to detect and assess the severity of atherosclerosis.
- Five columns display an icon, a procedure title, and placeholder text.
- The Five Diagnostic Methods Listed:
- Blood tests: Represented by test tubes, used to check cholesterol (lipid) levels.
- Electrocardiogram: Represented by an ECG/monitor, used to check the heart's electrical activity.
- Coronary calcium scan: Represented by a scanner with a heart, used to measure calcified plaque.
- (CT) angiography: Represented by a scanner with a heartbeat line, used to visualize vessel blockages.
- Echocardiogram: Represented by a computer with a heart/microphone, used to visualize the heart's function and blood flow.
Slide 27 - Atherosclerosis Detection (Alternative Diagnosis List)
.avif)
This slide offers an alternative visual style for listing the five common diagnostic methods for atherosclerosis.
Slide 28 - Atherosclerosis: Treatment (Section Divider)
.avif)
This slide introduces the section of the atherosclerosis presentation, focusing on therapeutic options.
- The icon features a pill bottle with a medical cross and surrounding capsules.
- This strongly suggests a focus on medication (e.g., statins, antiplatelets) as a primary treatment strategy.
Slide 29 - Atherosclerosis Treatment
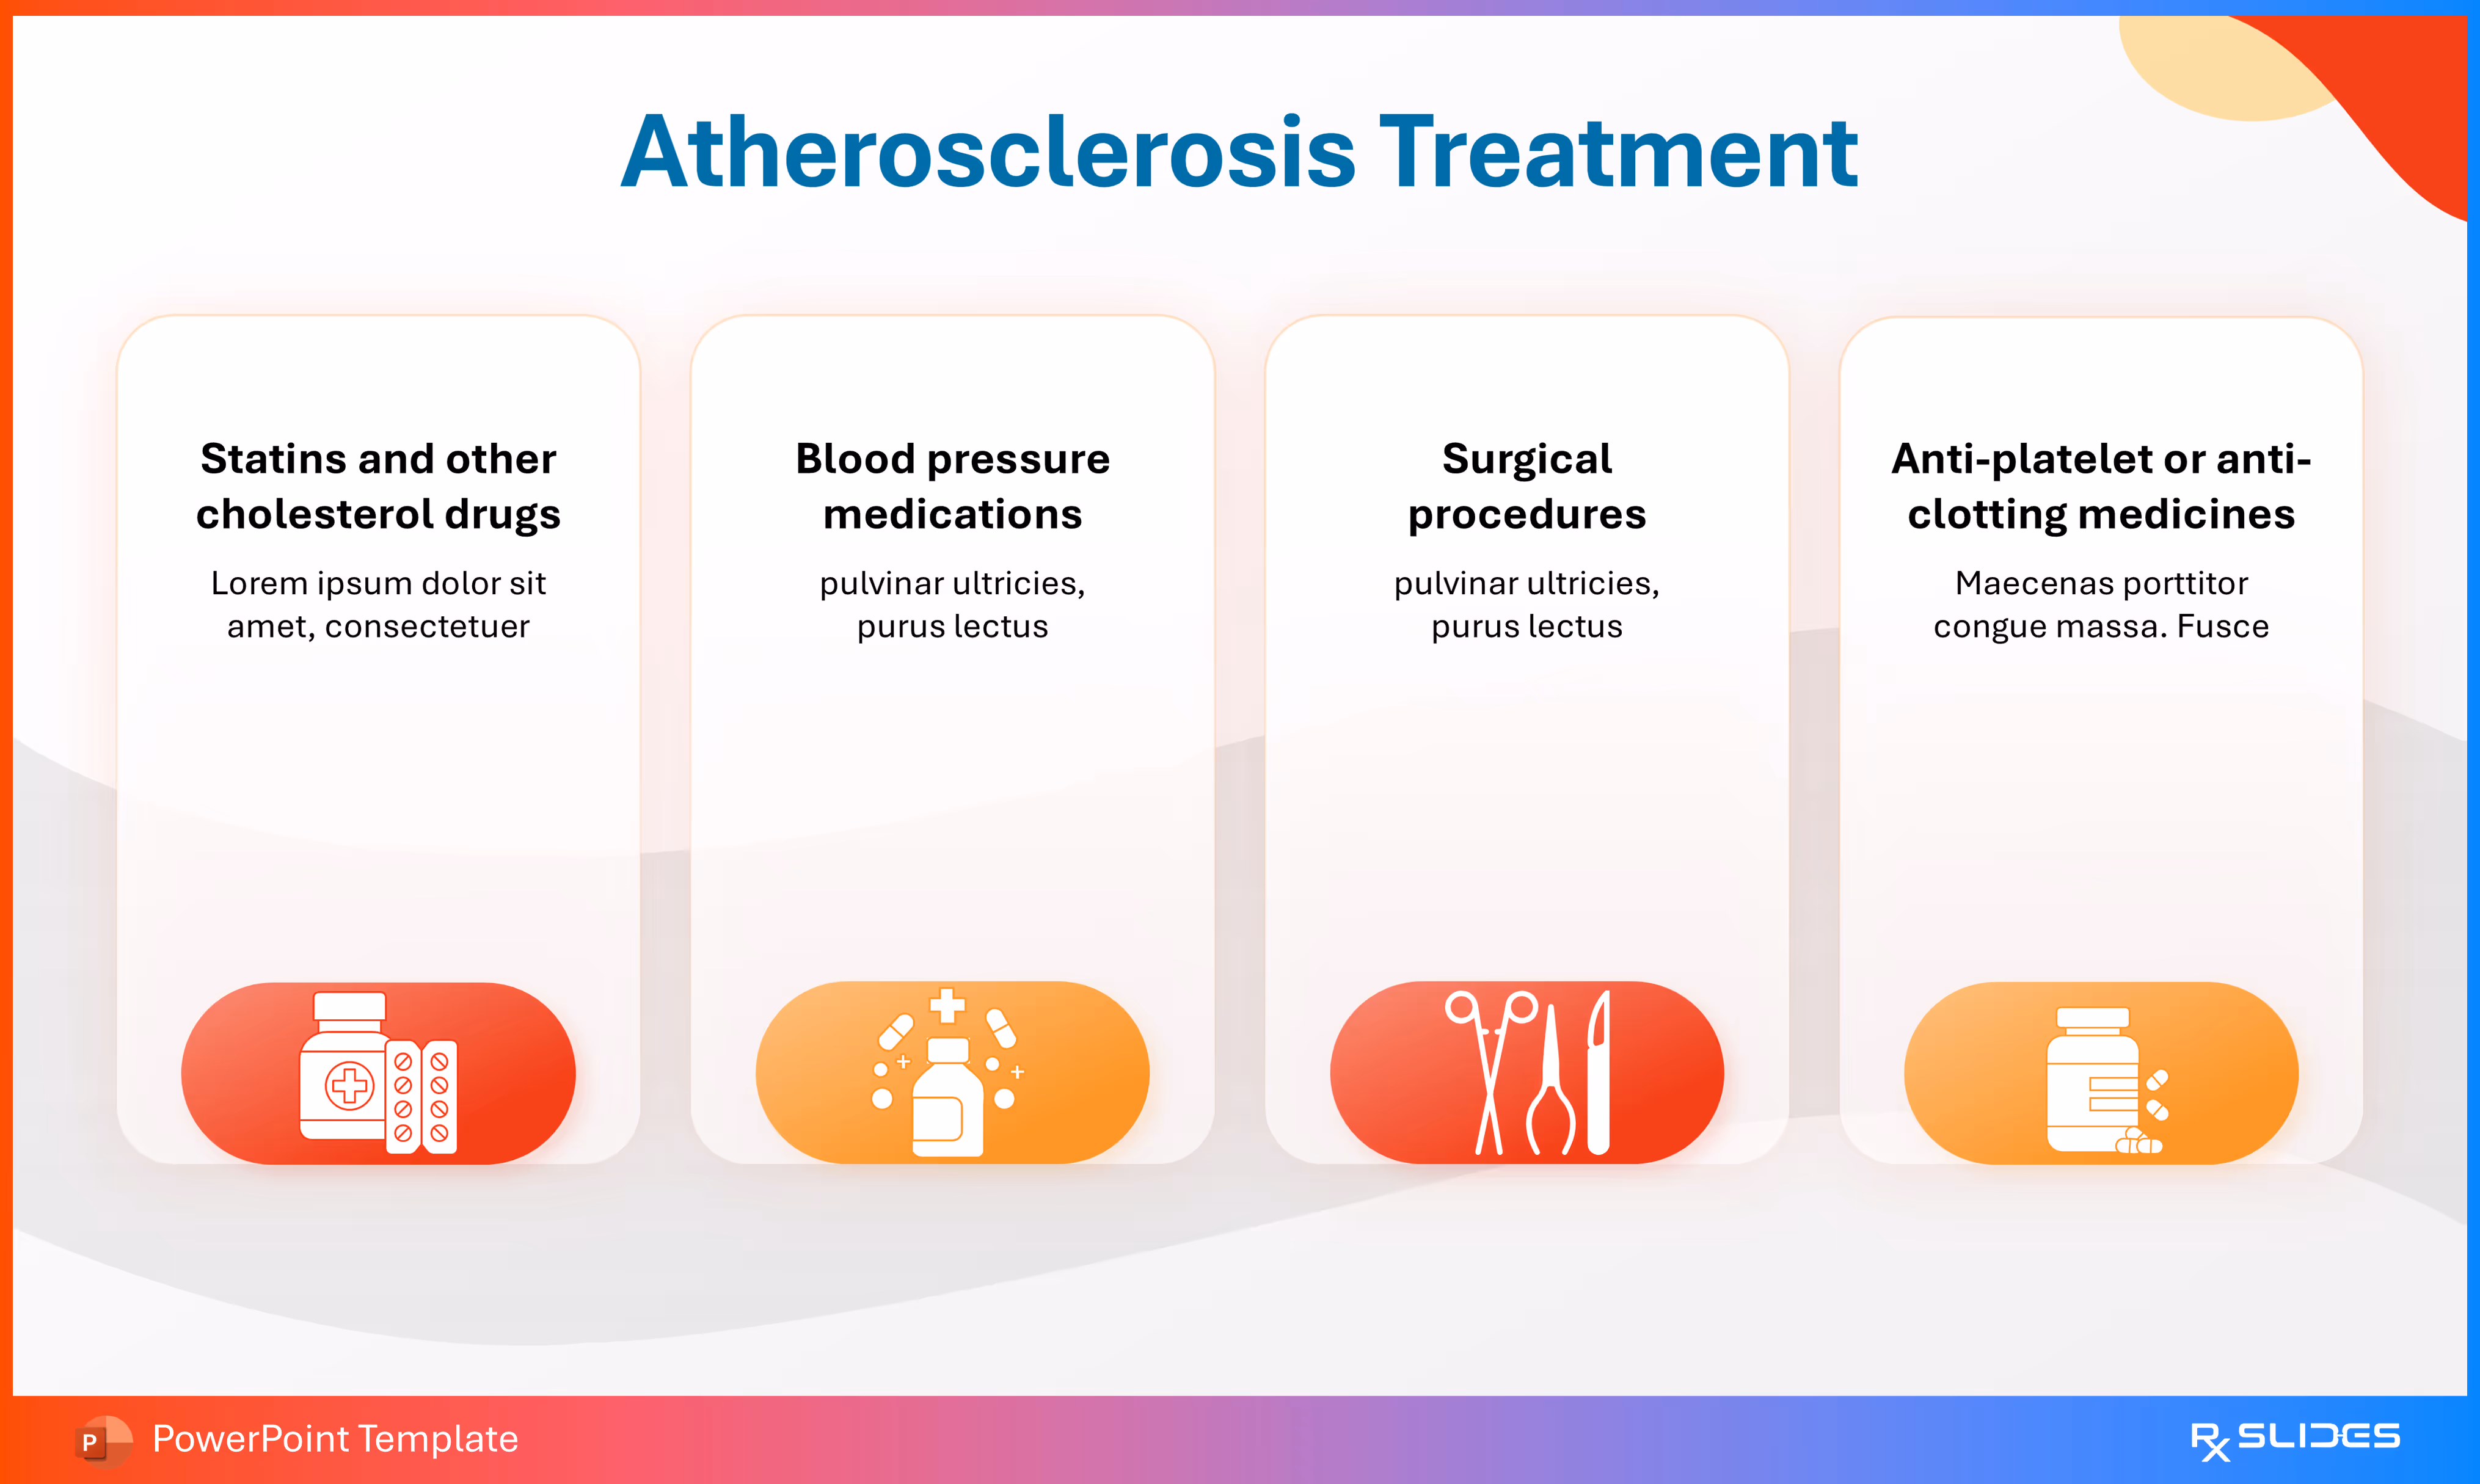
This slide lists four primary categories of treatment for atherosclerosis, ranging from medication to surgical intervention.
- Four vertical callout boxes, each with a different color scheme (red, orange/yellow, orange/red, orange) and a distinct icon representing a category of treatment.
- The Four Treatment Categories Listed:
- Statins and other cholesterol drugs (Icon: Pill bottle and pills).
- Blood pressure medications (Icon: Pill bottle and medical cross).
- Surgical procedures (Icon: Scissors and a scalpel).
- Anti-platelet or anti-clotting medicines (Icon: Pill bottle with multiple pills).
Slide 30 - Atherosclerosis Management (Alternative Treatment List)
.avif)
This slide provides an alternative, numbered layout for the four primary categories of atherosclerosis treatment.
- Title: "Atherosclerosis Management".
- Visual Elements: Four numbered columns (01 to 04) with icons and corresponding text placeholders.
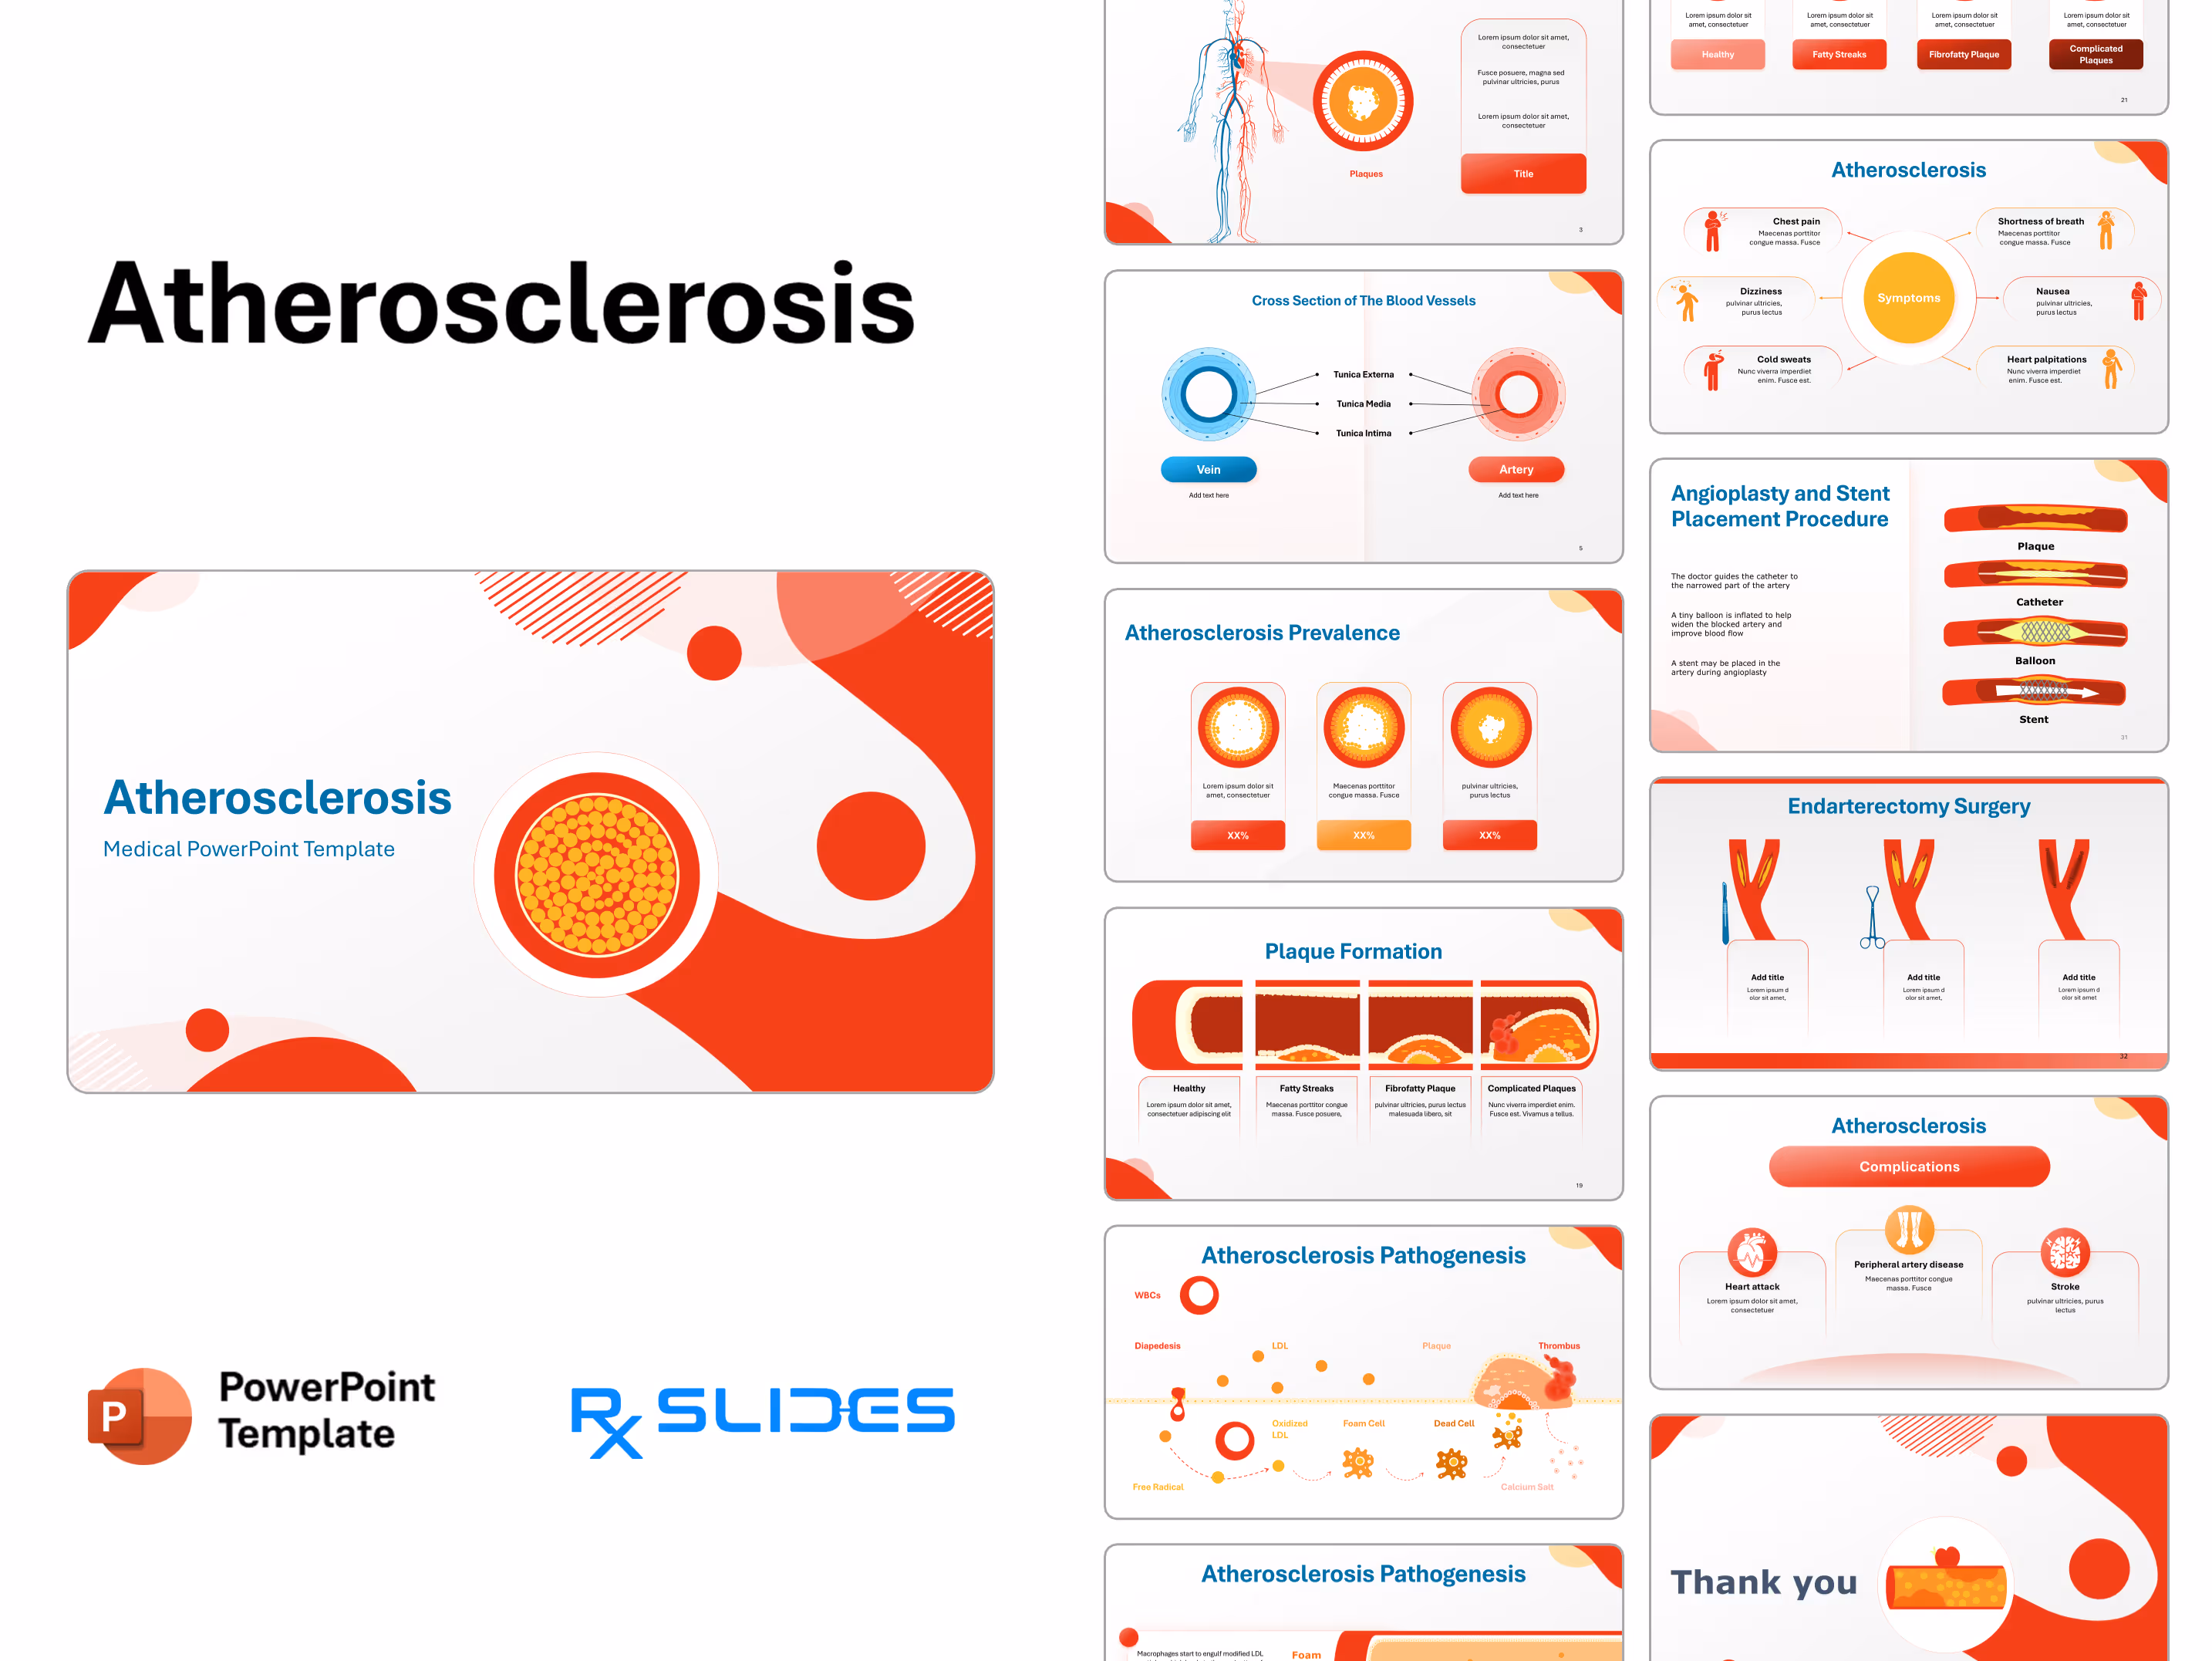
Slide 31 - Angioplasty and Stent Placement Procedure
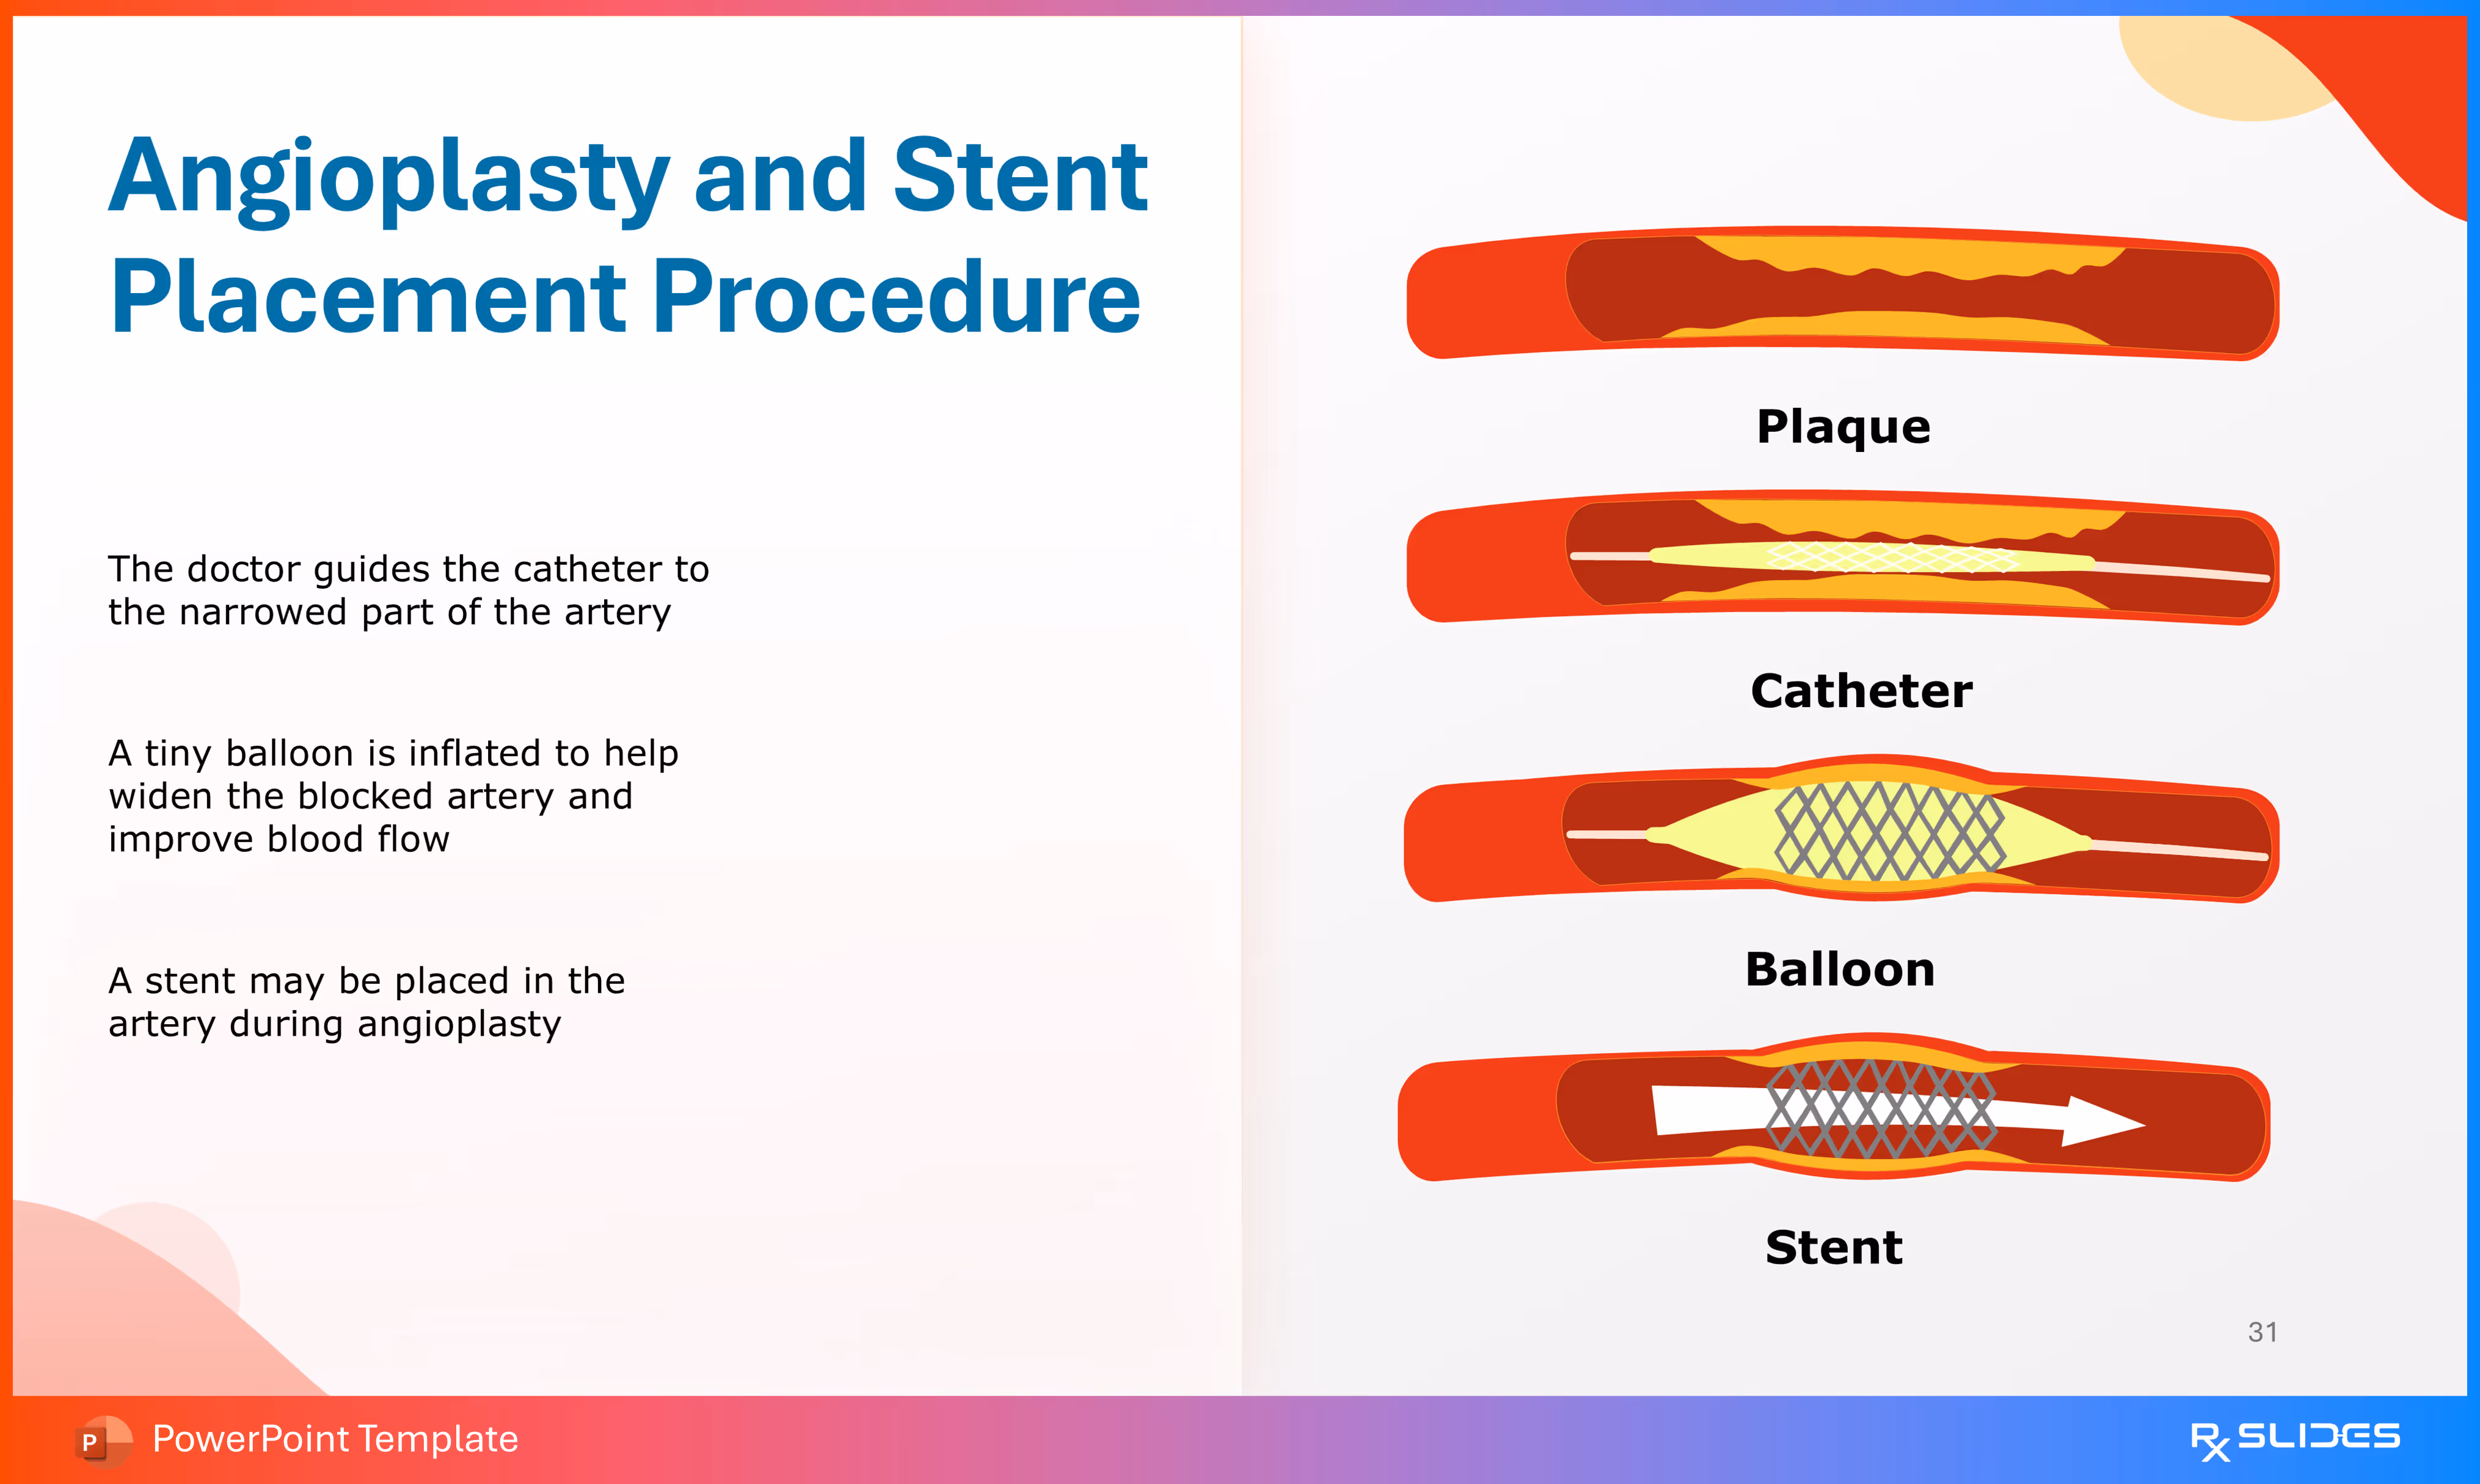
This slide provides a visual and textual explanation of a common surgical procedure used to treat advanced atherosclerosis.
- Four sequential illustrations show the steps of the procedure on an artery with plaque.
- The Procedure Steps Listed:
- The doctor guides the catheter to the narrowed part of the artery.
- A tiny balloon is inflated to help widen the blocked artery and improve blood flow.
- A stent may be placed in the artery during angioplasty
Slide 32 - Endarterectomy Surgery

This slide illustrates the process of an endarterectomy, a surgical technique to physically remove plaque buildup from an artery.
- The slide features three sequential illustrations of a bifurcating artery (like the carotid artery).
- The first illustration shows a scalpel next to an artery with severe plaque buildup.
- The second illustration shows surgical forceps/clamp, suggesting the removal process.
- The third illustration shows a cleaned artery with sutures, indicating the completion of the procedure.
Slide 33 - Atherosclerosis Complications Section Divider

This slide serves as the section divider for the Atherosclerosis template, introducing the topic of complications.
- The slide features a prominent icon of a red heart with an ECG rhythm line running through it, signifying cardiovascular health issues.
Slide 34 - Atherosclerosis Complications
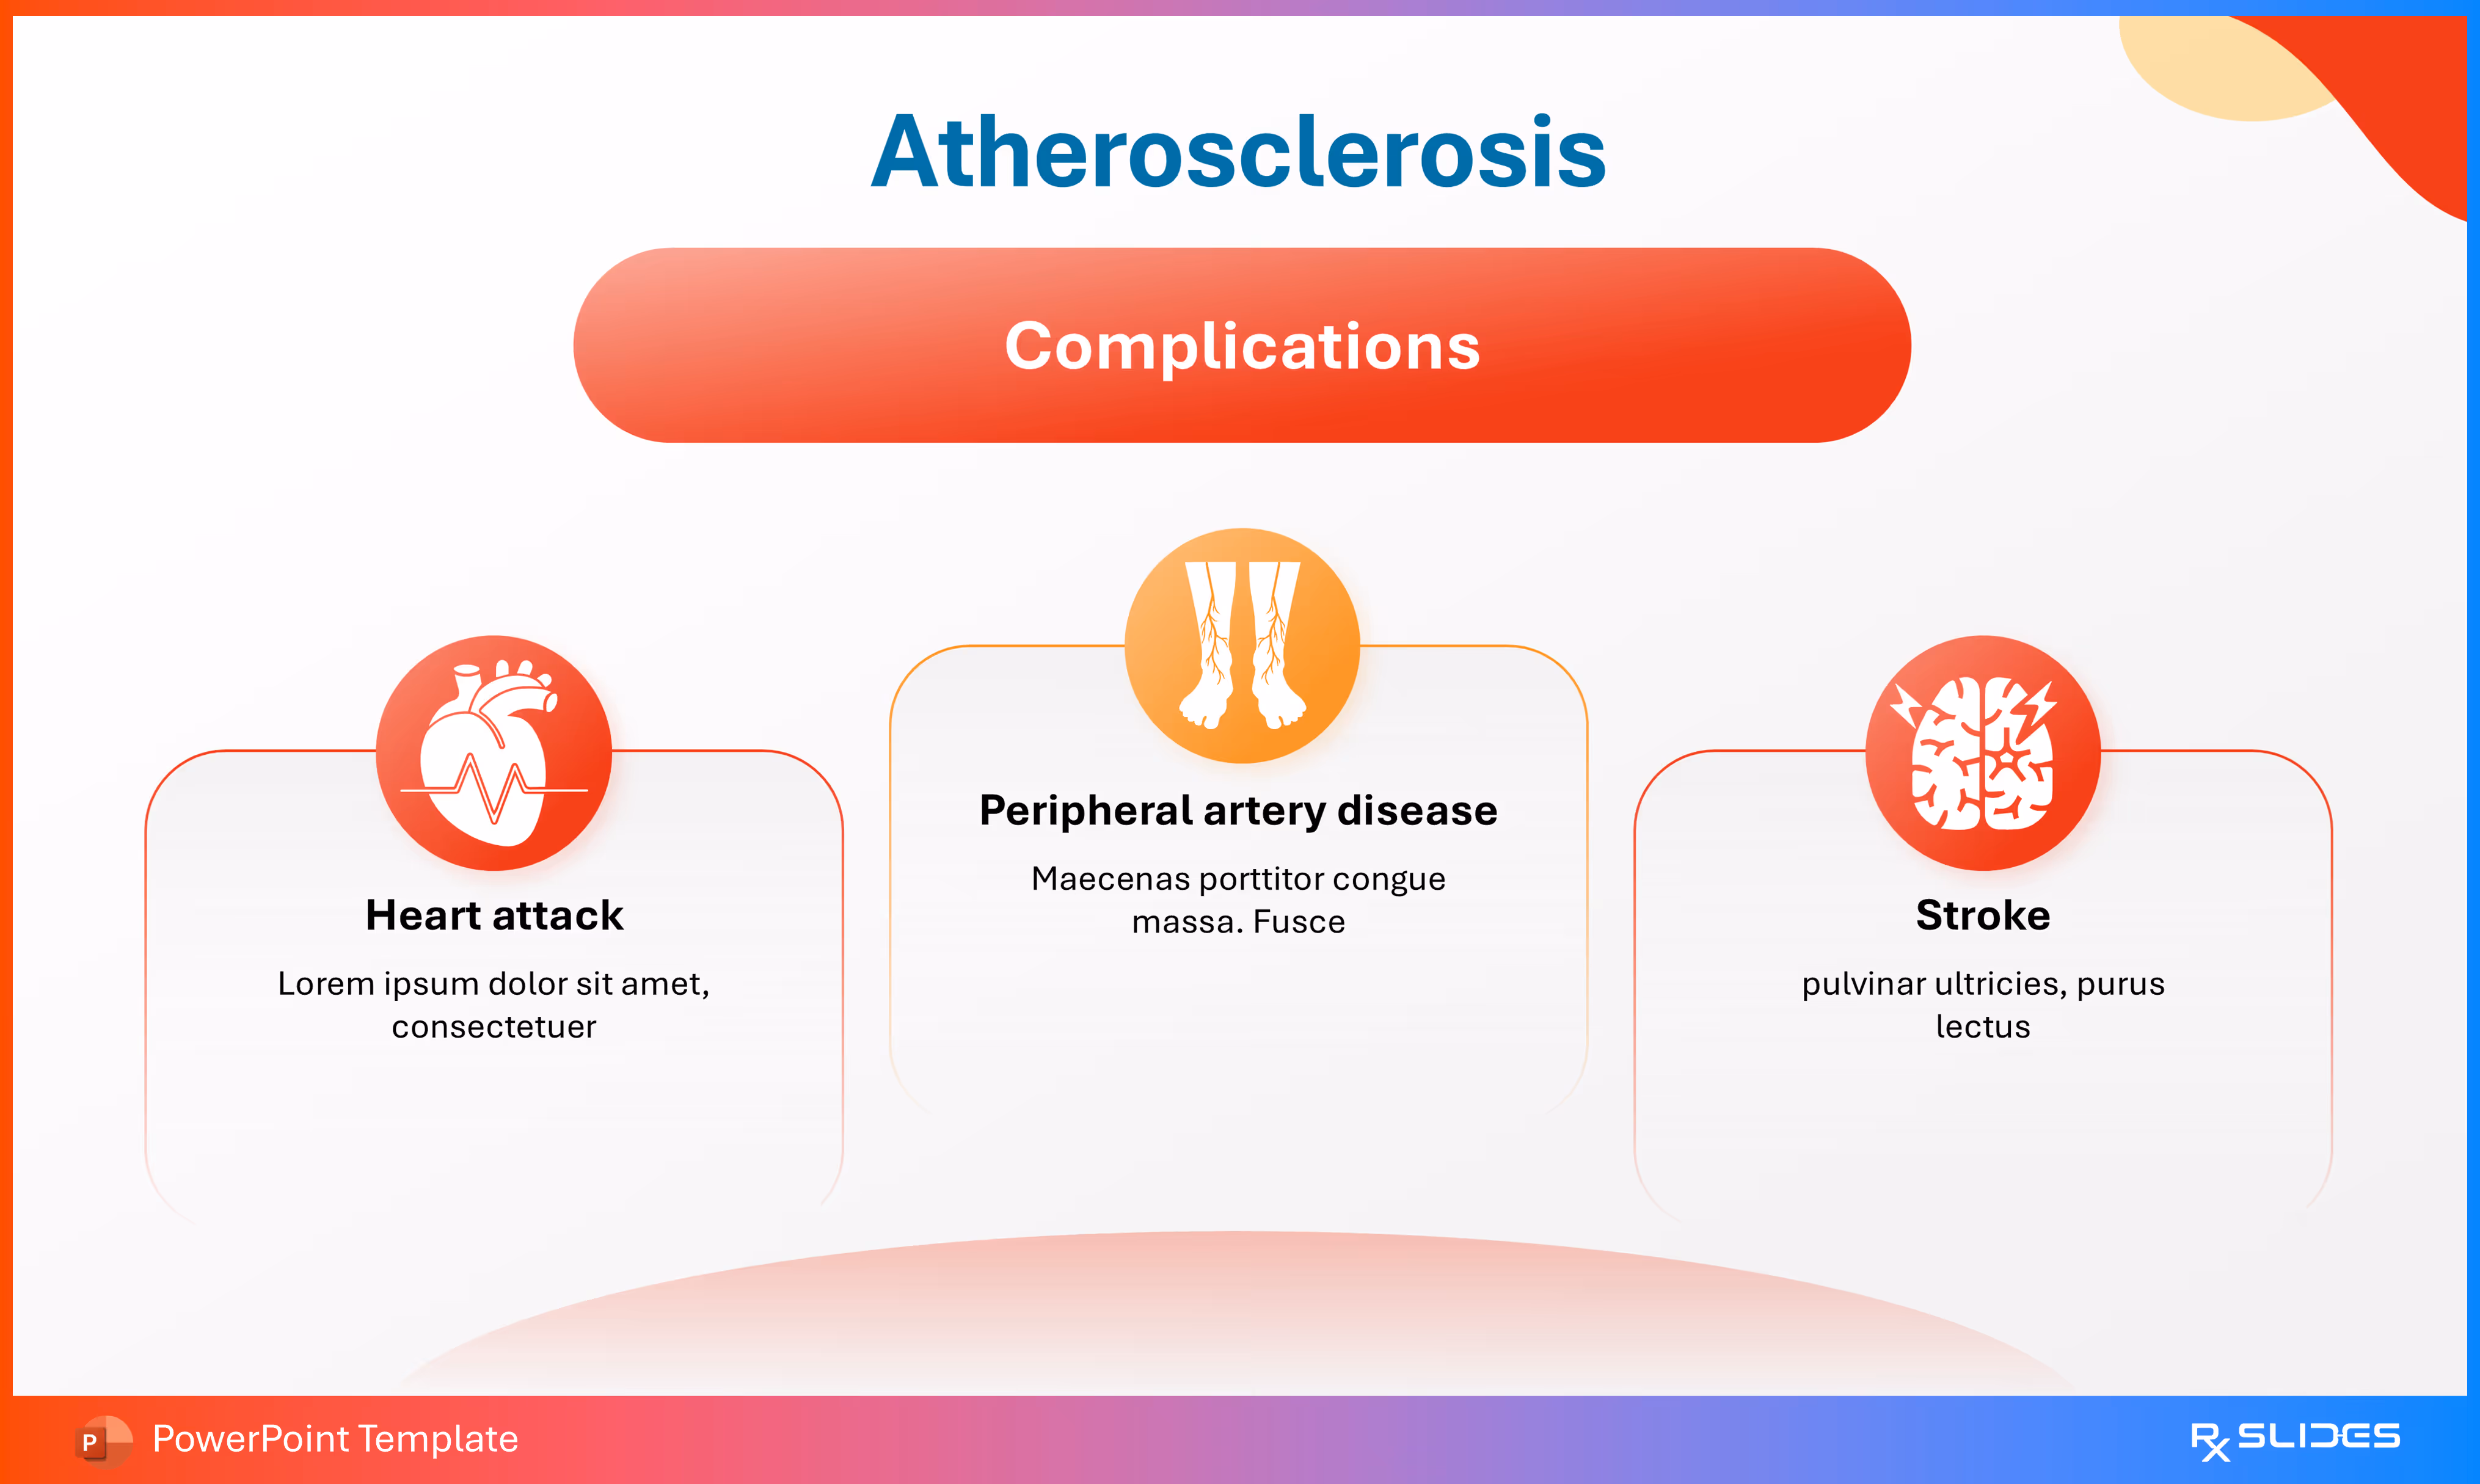
This slide lists the three major consequences of advanced atherosclerosis.
- Three Listed Complications:
- Heart attack: Represented by an icon of a heart with an ECG line.
- Peripheral artery disease: Represented by an icon of the lower legs and arteries.
- Stroke: Represented by an icon of an affected brain.
Slide 35 - Atherosclerosis Complications
.avif)
This slide is an alternative visualization of the three primary complications, featuring a large circular illustration of plaque buildup on the right.
- It lists Stroke, Peripheral artery disease, and Heart attack with placeholder text beneath each.
- A large orange and yellow graphic illustrates an artery cross-section completely blocked by plaque.
Slide 36 - Atherosclerosis Prevention Section Slide

This final slide of the Atherosclerosis deck acts as a section divider, transitioning the focus to methods of prevention.
The central icon is a large red "No Smoking" sign, directly addressing a major modifiable risk factor for the disease.
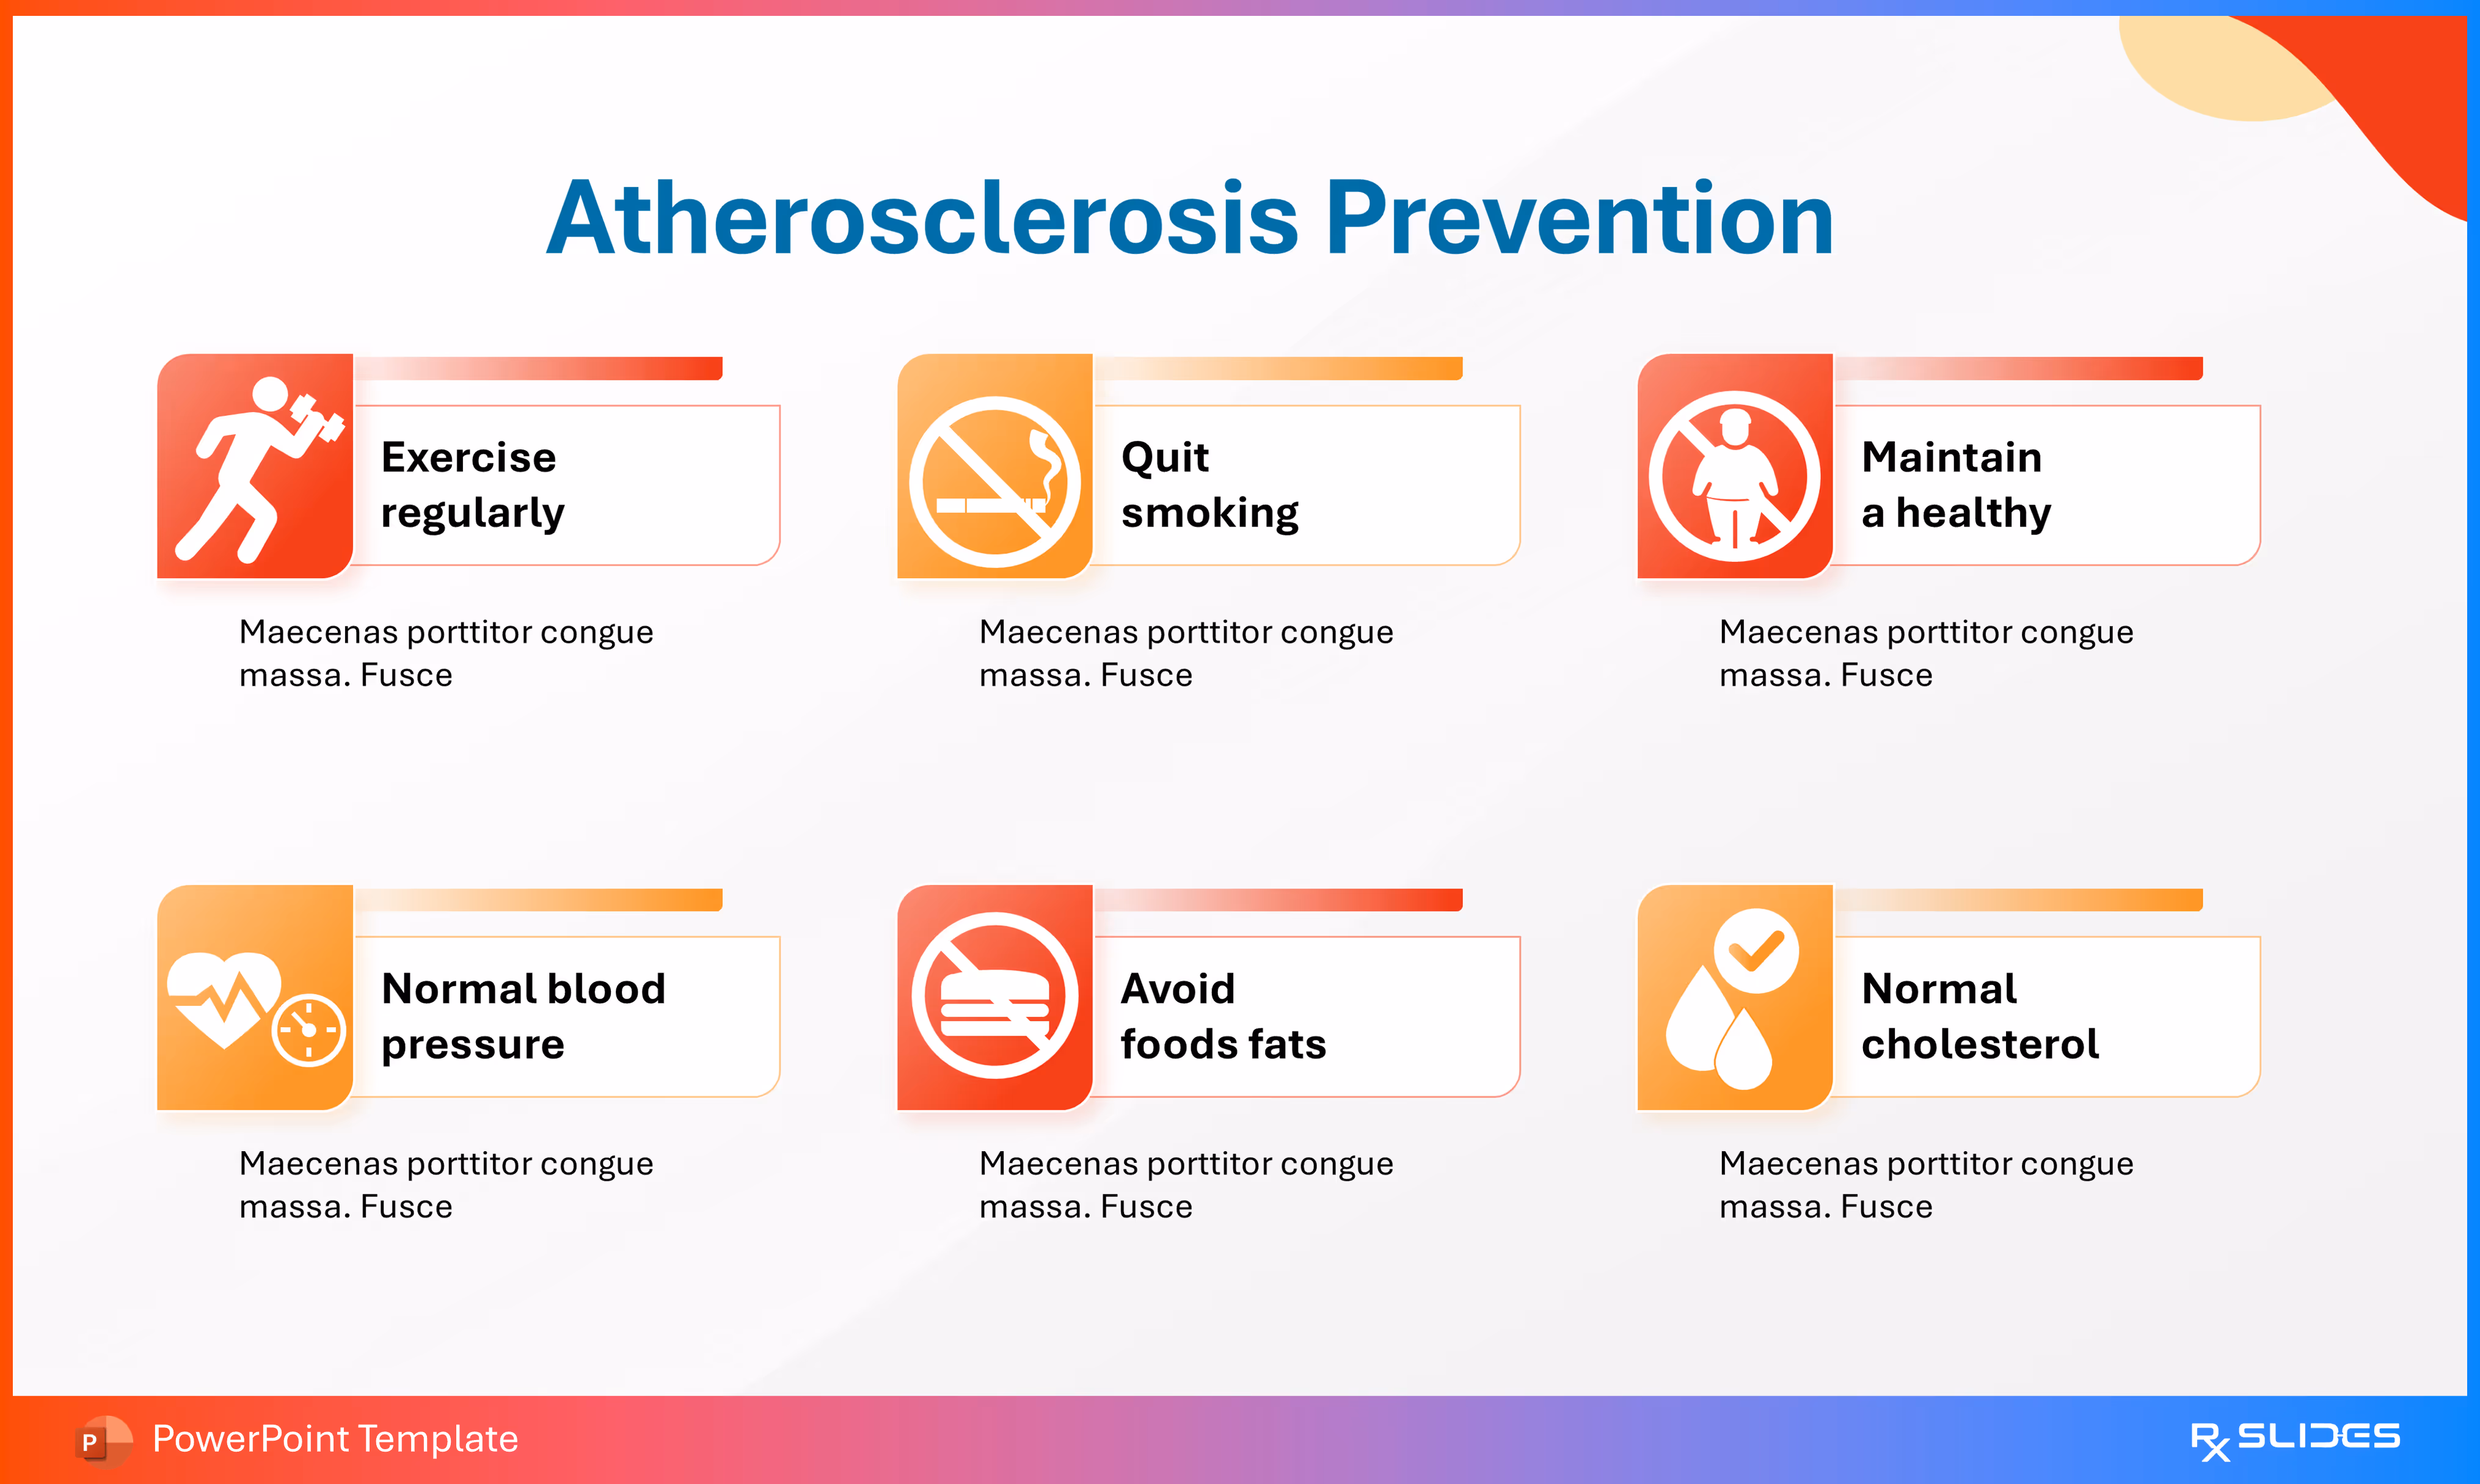
Slide 37 - Atherosclerosis Prevention
.avif)
This slide provides six key prevention strategies in an easy-to-read, icon-based grid format.
- The slide is organized into six distinct modules detailing prevention methods.
- Exercise regularly (with a running icon).
- Quit smoking (with a "No Smoking" icon).
- Healthy Weight (with a restrictive diet/person icon).
- Normal blood pressure (with a heart and clock icon).
- Avoid foods fats (with a "No Fast Food" icon).
- Normal cholesterol (with a dripping blood/liquid icon).
Slide 38 - Atherosclerosis Prevention alternative layout
This slide presents an alternative layout for the six key prevention strategies, using placeholder text and a different visual style.
- The slide features six modules detailing methods to prevent atherosclerosis.
Slide 39 - Thank you

This slide serves as the concluding "Thank you" slide for the entire Atherosclerosis presentation template.
- The slide features a large illustration of a cross-section of a plaque-filled artery.
- A small red heart with a crown rests on top of the vessel, possibly symbolizing a healthy heart or the coronary artery.
Features of the Template
- 100% editable PowerPoint template.
- Editable colors, you can change according to your presentation style and company branding guidelines.

%20animation.avif)