Brain Tumor PowerPoint Template
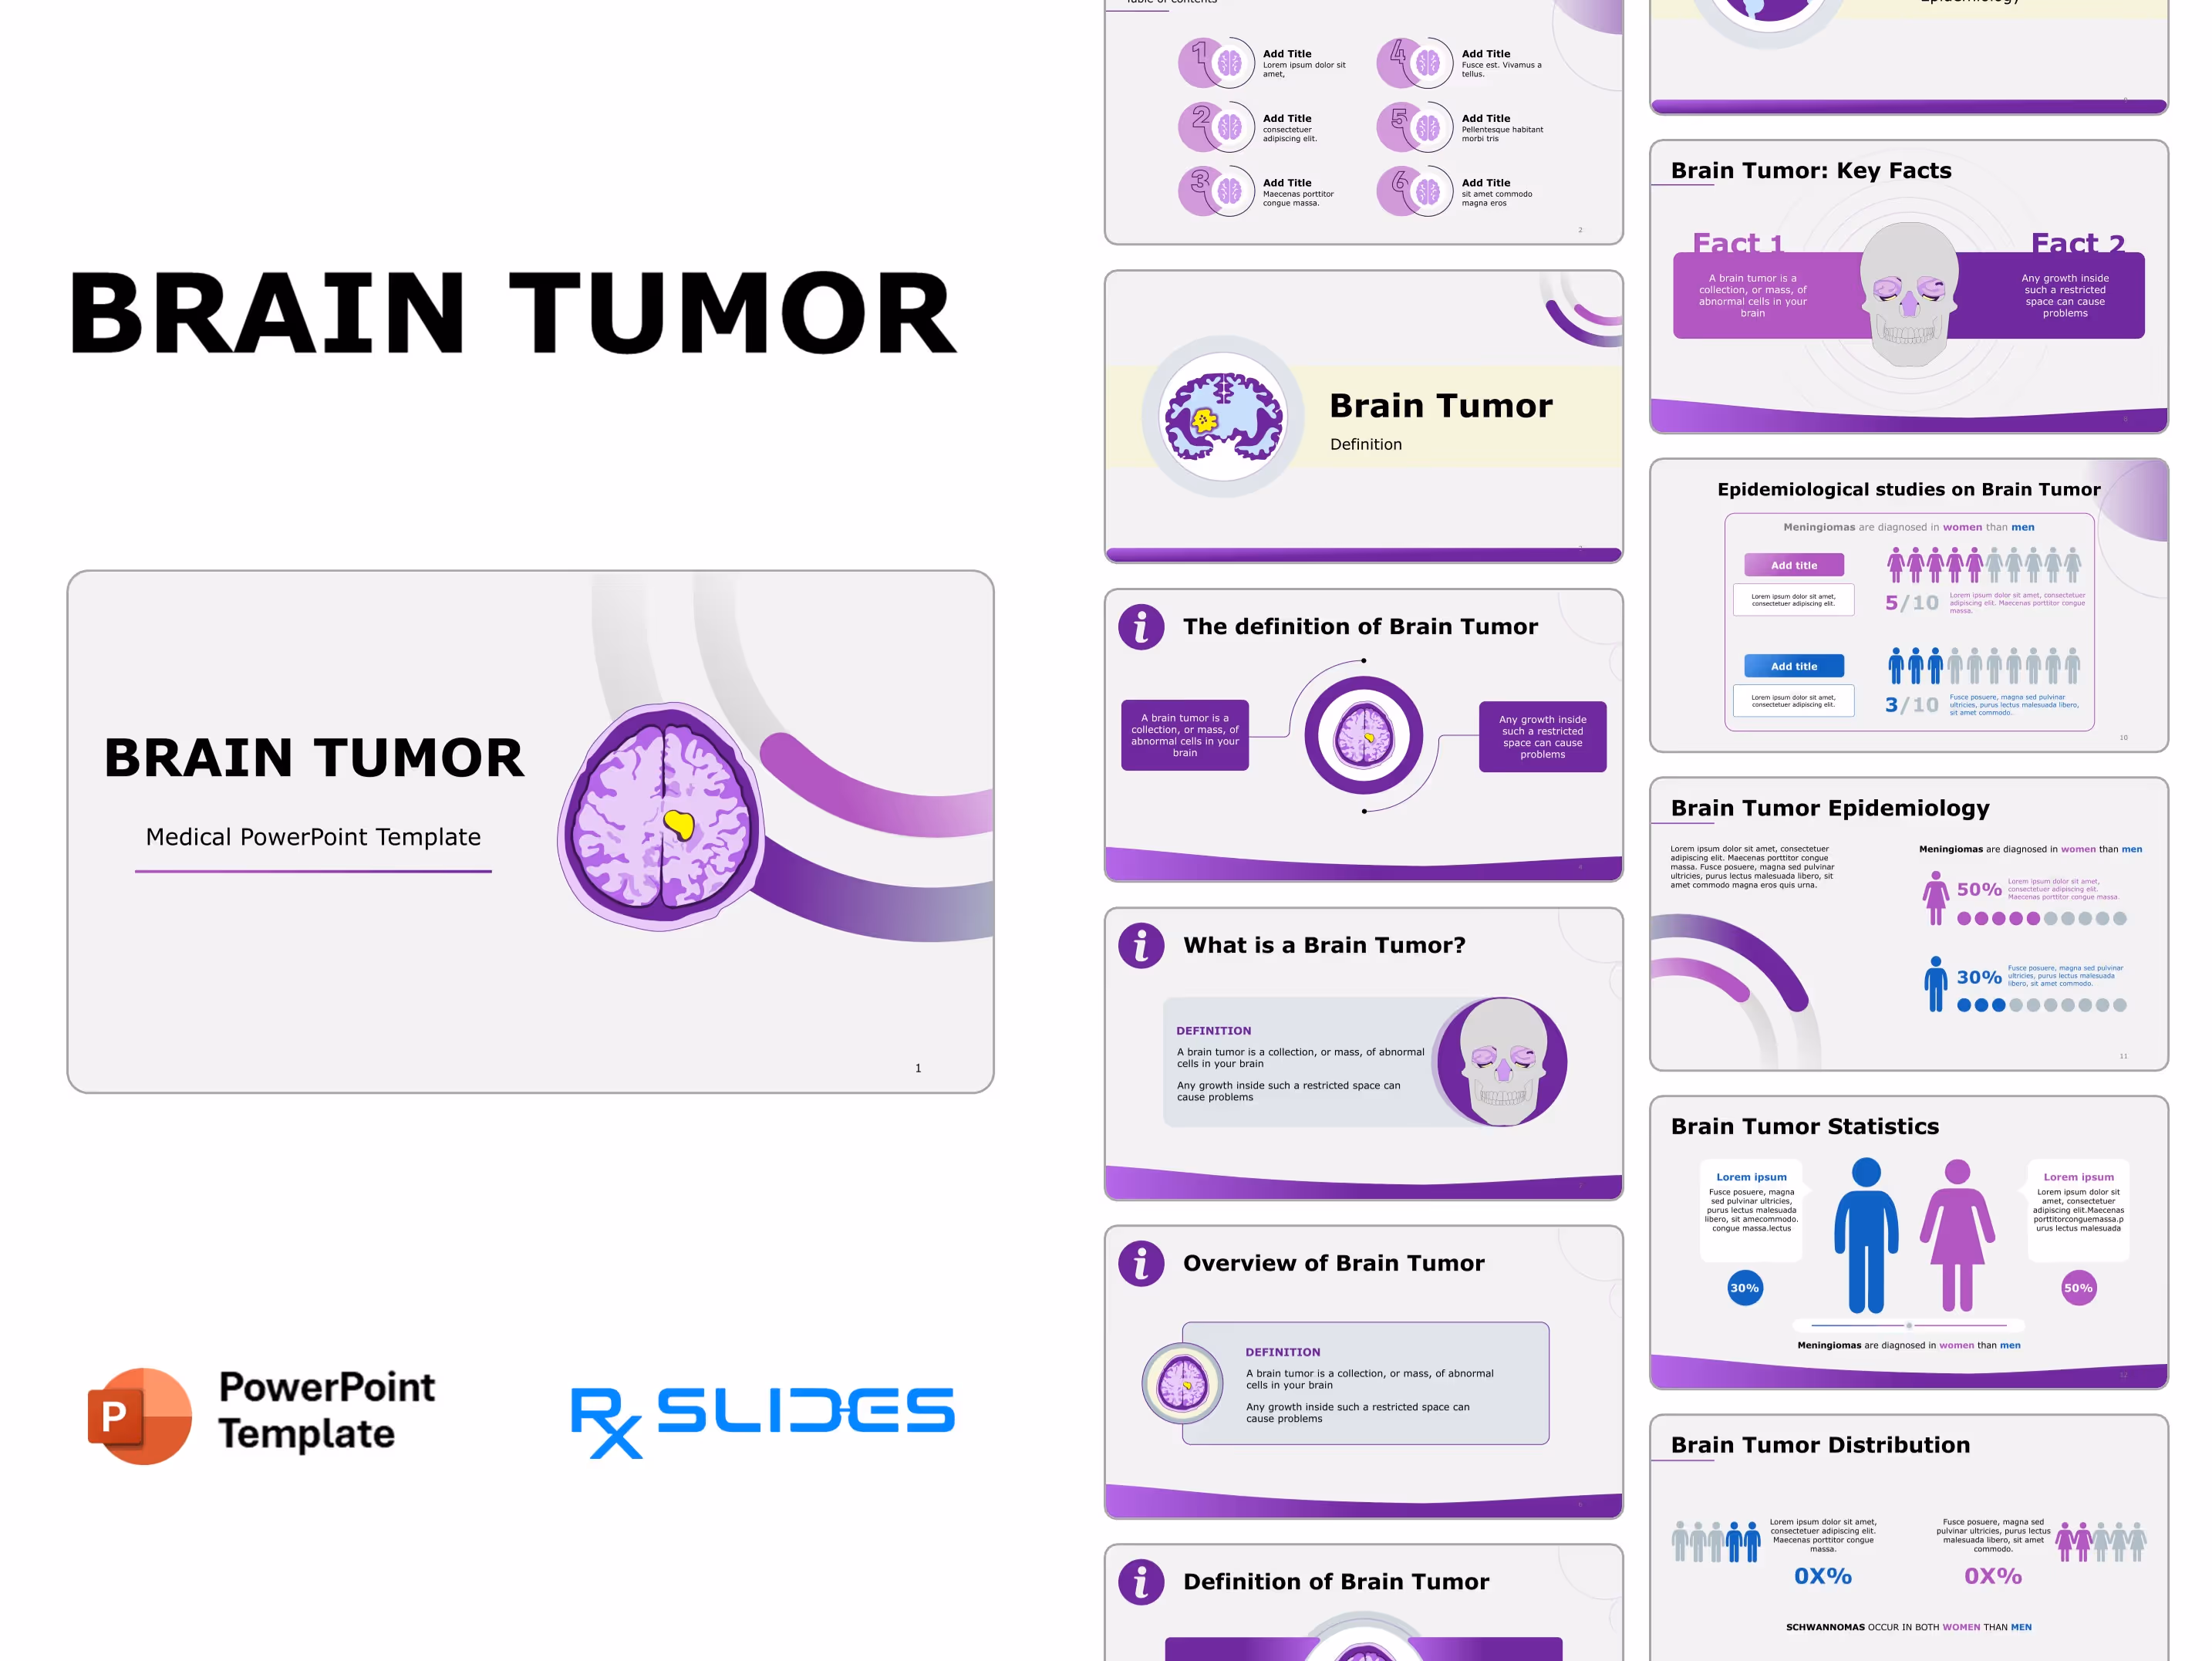
Brain Tumor PowerPoint Template: Medical Animated Slides
- The Brain Tumor PPT template offers an animated medical slides template designed by RxSlides professionals.
- Our carefully designed slides, which include medical animations and infographics, will attract your audience.
- Our demonstrated infographics will give your audience a dynamic and appealing brain tumor PPT presentation.
- Looking for more engaging templates and illustrations for your presentations on oncology or CNS topics? Look no further! Our animated Cancer and Neurology PowerPoint Templates will not only inform your audience but also keep them engaged.
Brain Tumor PowerPoint Template Preview
The Brain Tumor PowerPoint Template Content
Slide 1 - Title Slide
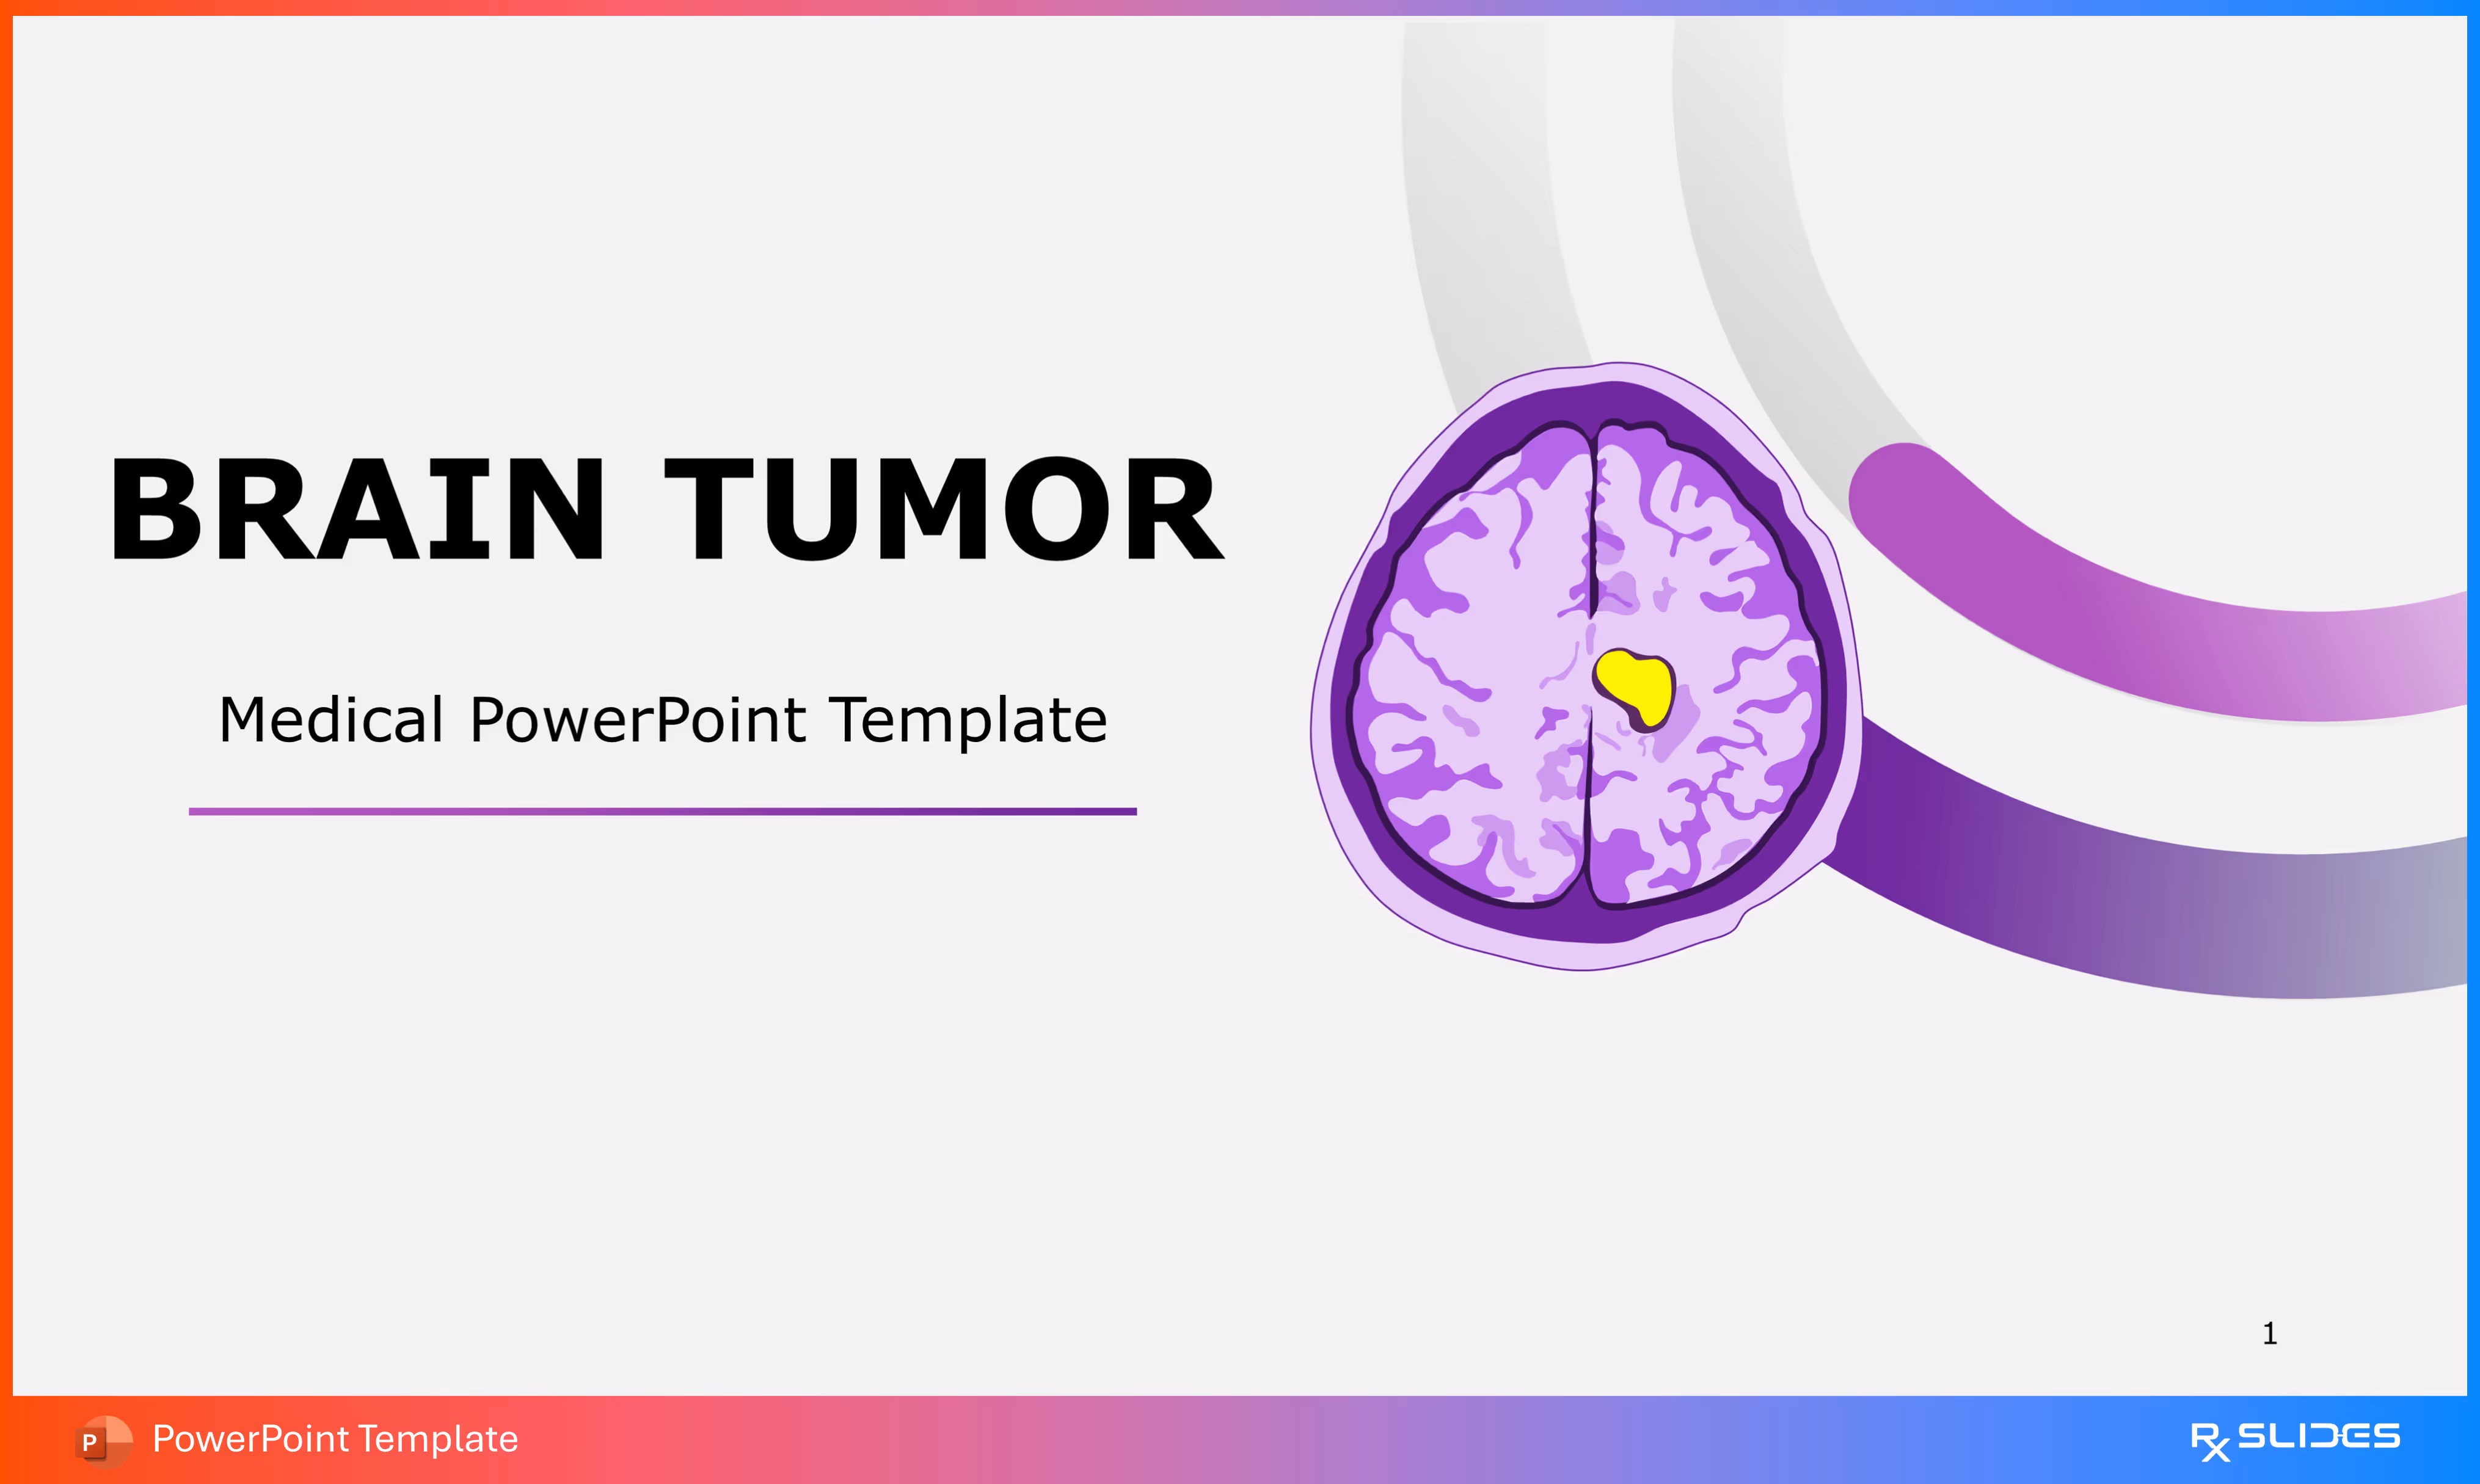
This slide introduces the entire presentation template, focusing on the serious medical topic of Brain Tumors.
- A striking, stylized diagram of the human brain viewed in a cross-section, contained within a purple circle. A prominent yellow shape is overlaid on the brain tissue, clearly indicating the location of the tumor.
- The template uses a bold color palette featuring various shades of purple and yellow accents, setting a professional and medically-focused tone.
Slide 2 - Table of Contents / Agenda
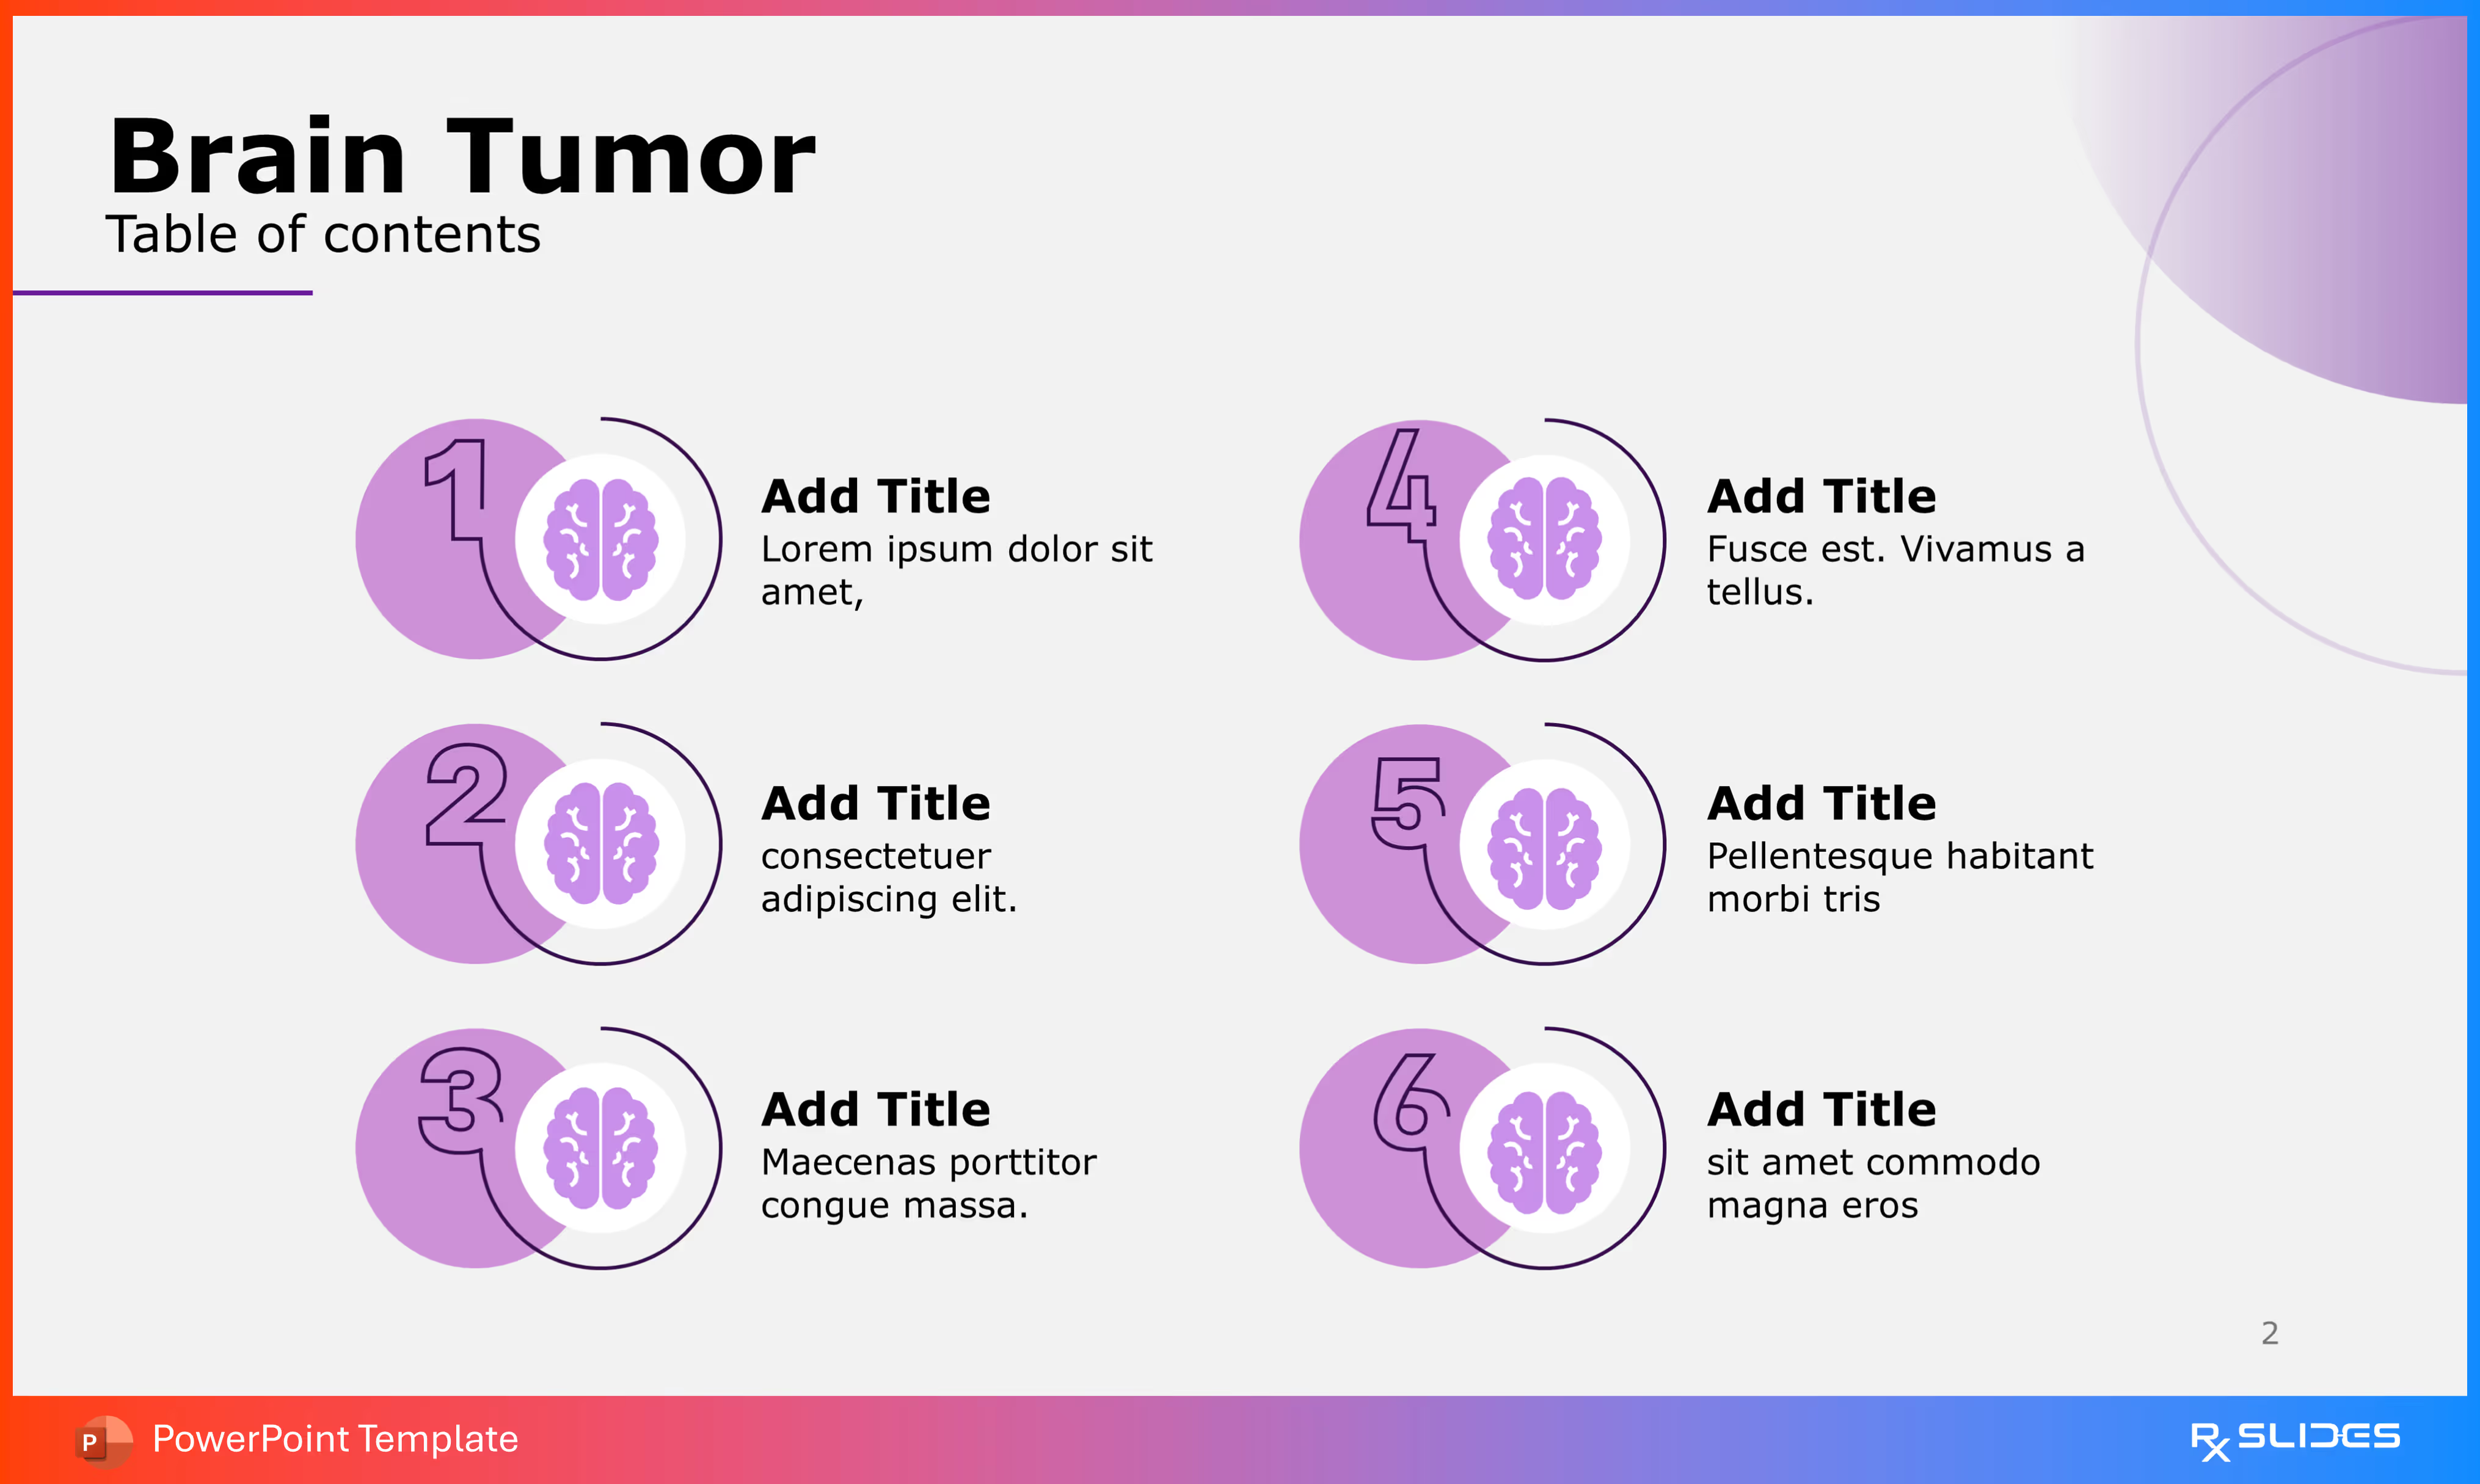
This slide provides the Table of Contents for the presentation, outlining the six major sections that follow.
- The agenda uses a six-point numbered list arranged in two vertical columns (1-3 on the left, 4-6 on the right).
- Each numbered point is housed within a purple and white circular graphic that prominently features a stylized brain icon, maintaining the template's core visual theme.
- All six points currently use placeholder text, such as "Add Title".
Slide 3 - Section Divider: Definition
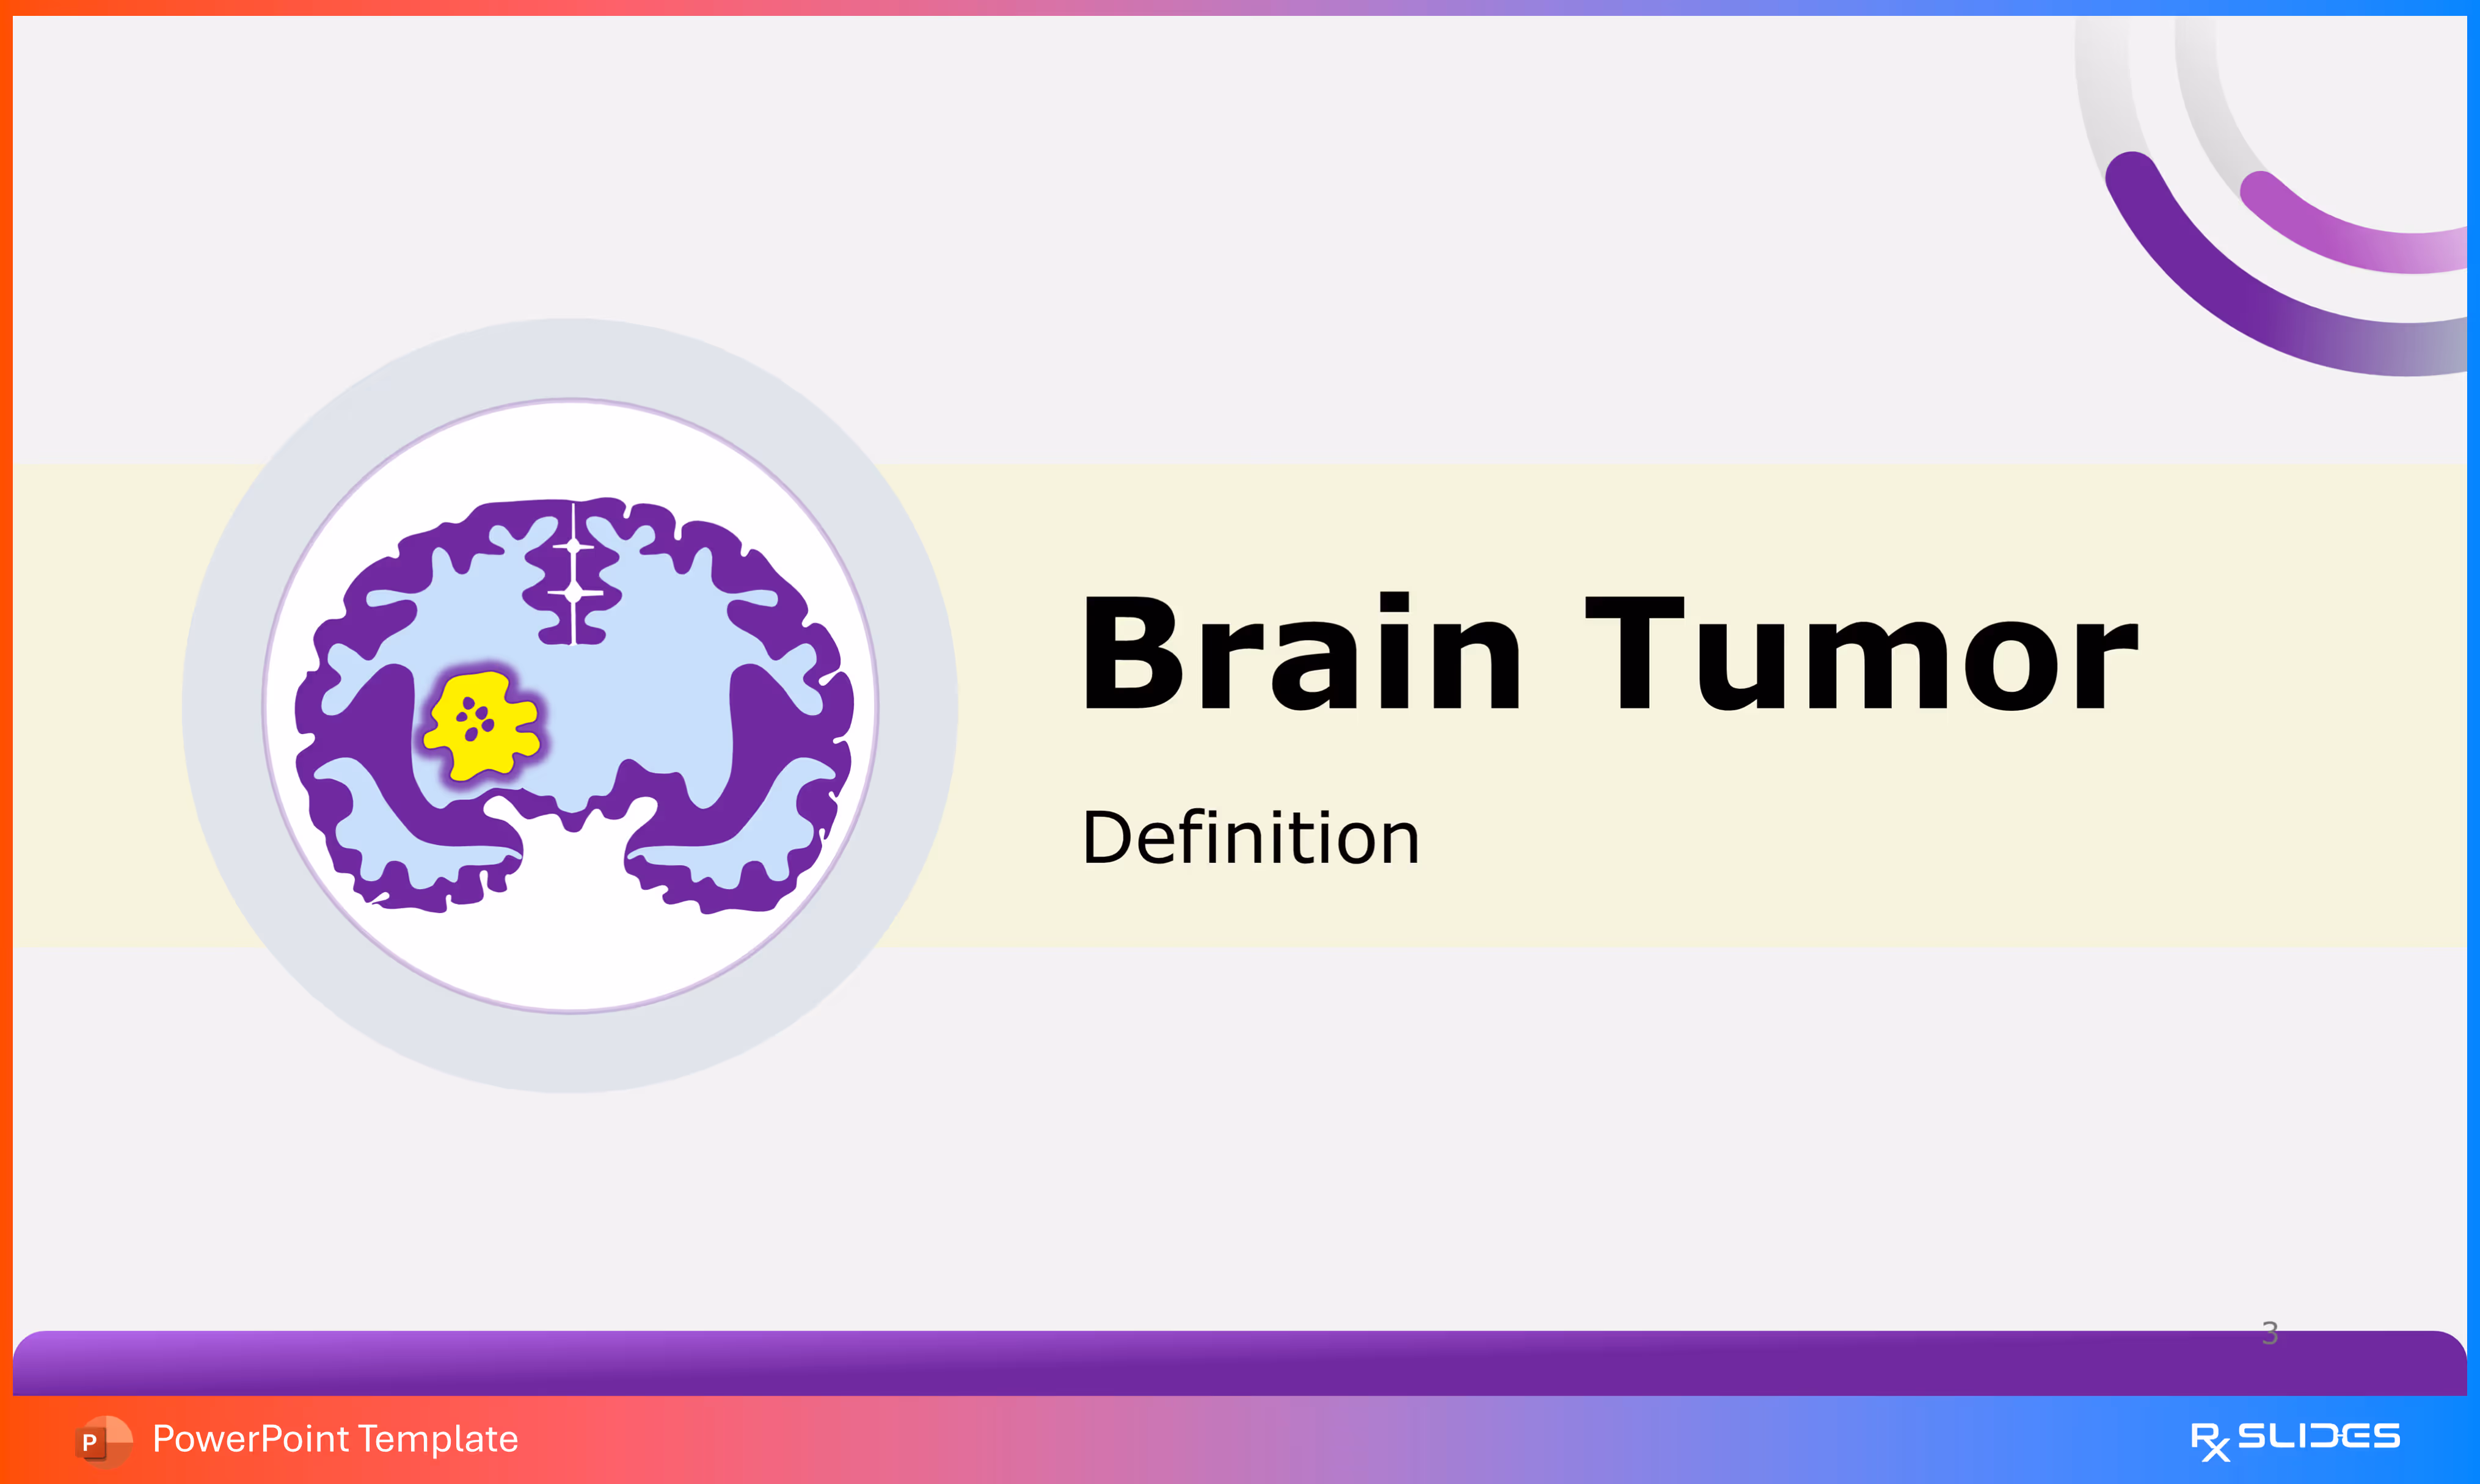
This slide serves as a section divider, introducing the first major content area of the presentation: the definition of a brain tumor.
- A simplified, horizontal layout featuring a stylized circular inset of the brain with a yellow tumor, identical to the title slide's main icon. This visual reinforces the topic and breaks up the flow from the agenda.
Slide 4 - The definition of Brain Tumor
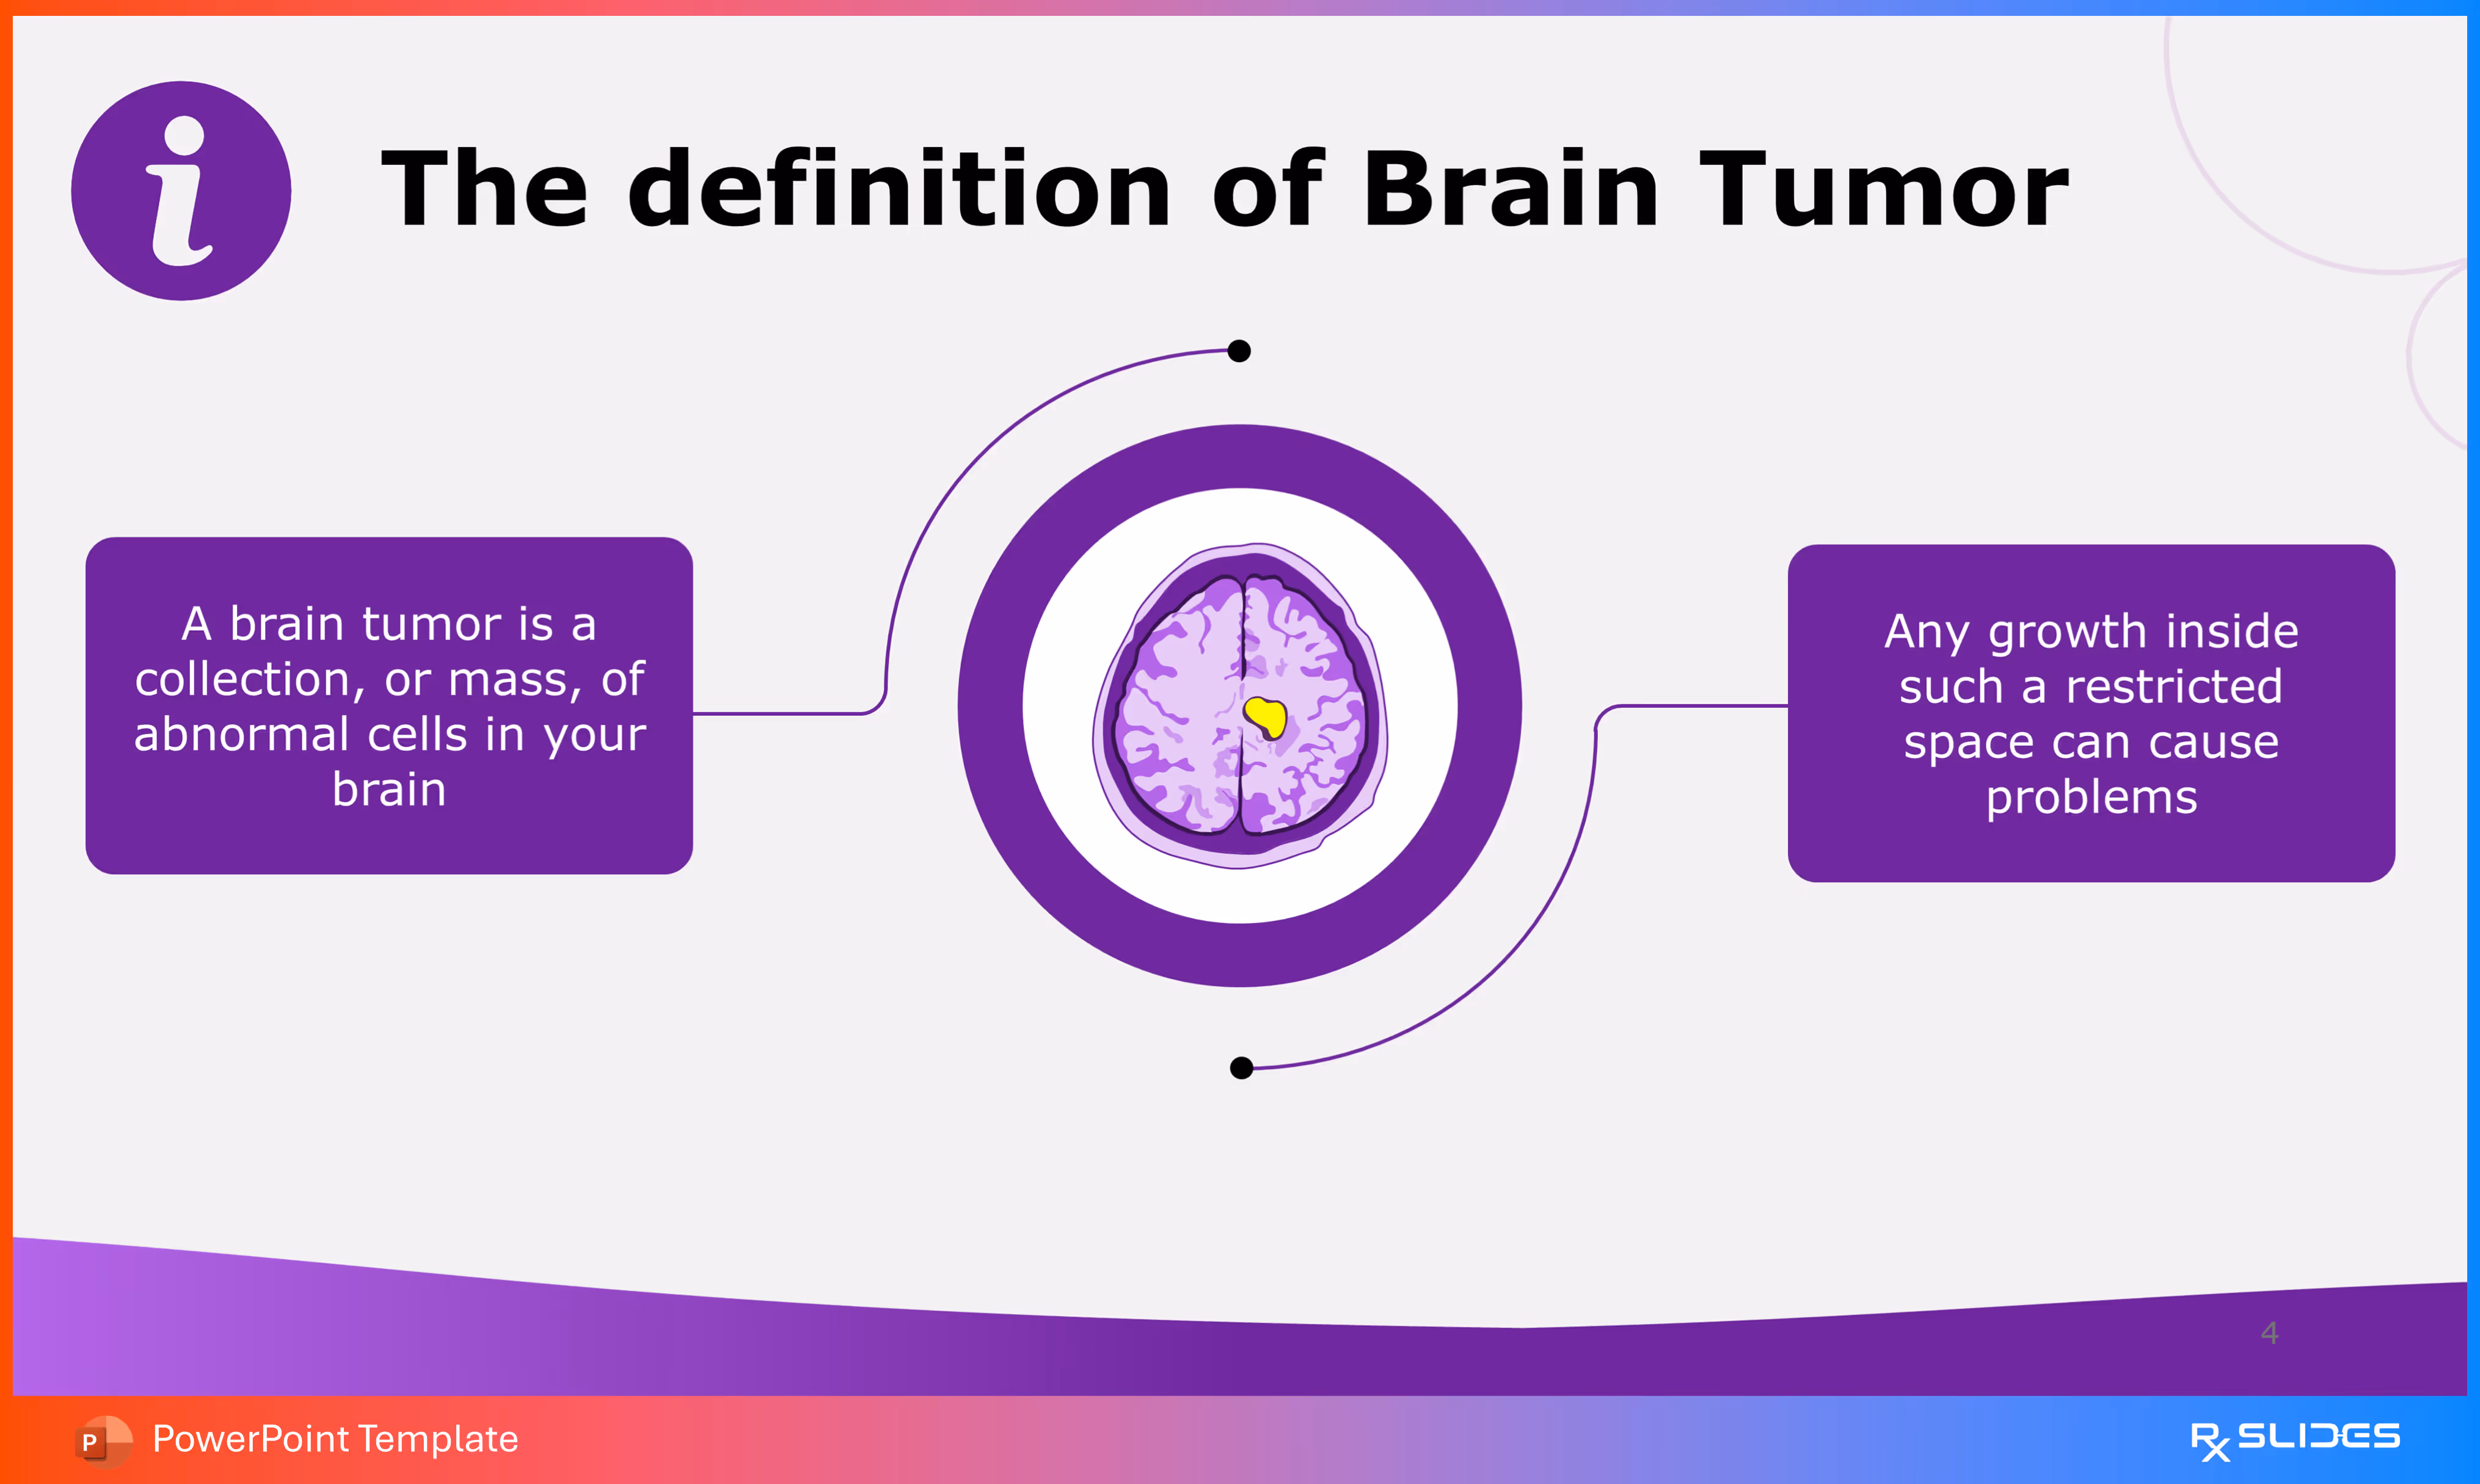
This slide provides a clear, concise definition of a Brain Tumor, utilizing a central visual and two supporting text boxes.
- Definition:
- Text Box 1 (Left): "A brain tumor is a collection, or mass, of abnormal cells in your brain".
- Text Box 2 (Right): "Any growth inside such a restricted space can cause problems".
- The central feature is a circular diagram of the brain cross-section with a yellow tumor. This visual reinforces the concept of a growing mass in a confined space.
Slide 5 - Definition of Brain Tumor (Alternative Layout)
.avif)
This slide provides an alternative, high-contrast layout for the definition of a Brain Tumor, utilizing a central visual and two supporting text boxes.
Slide 6 - Overview of Brain Tumor
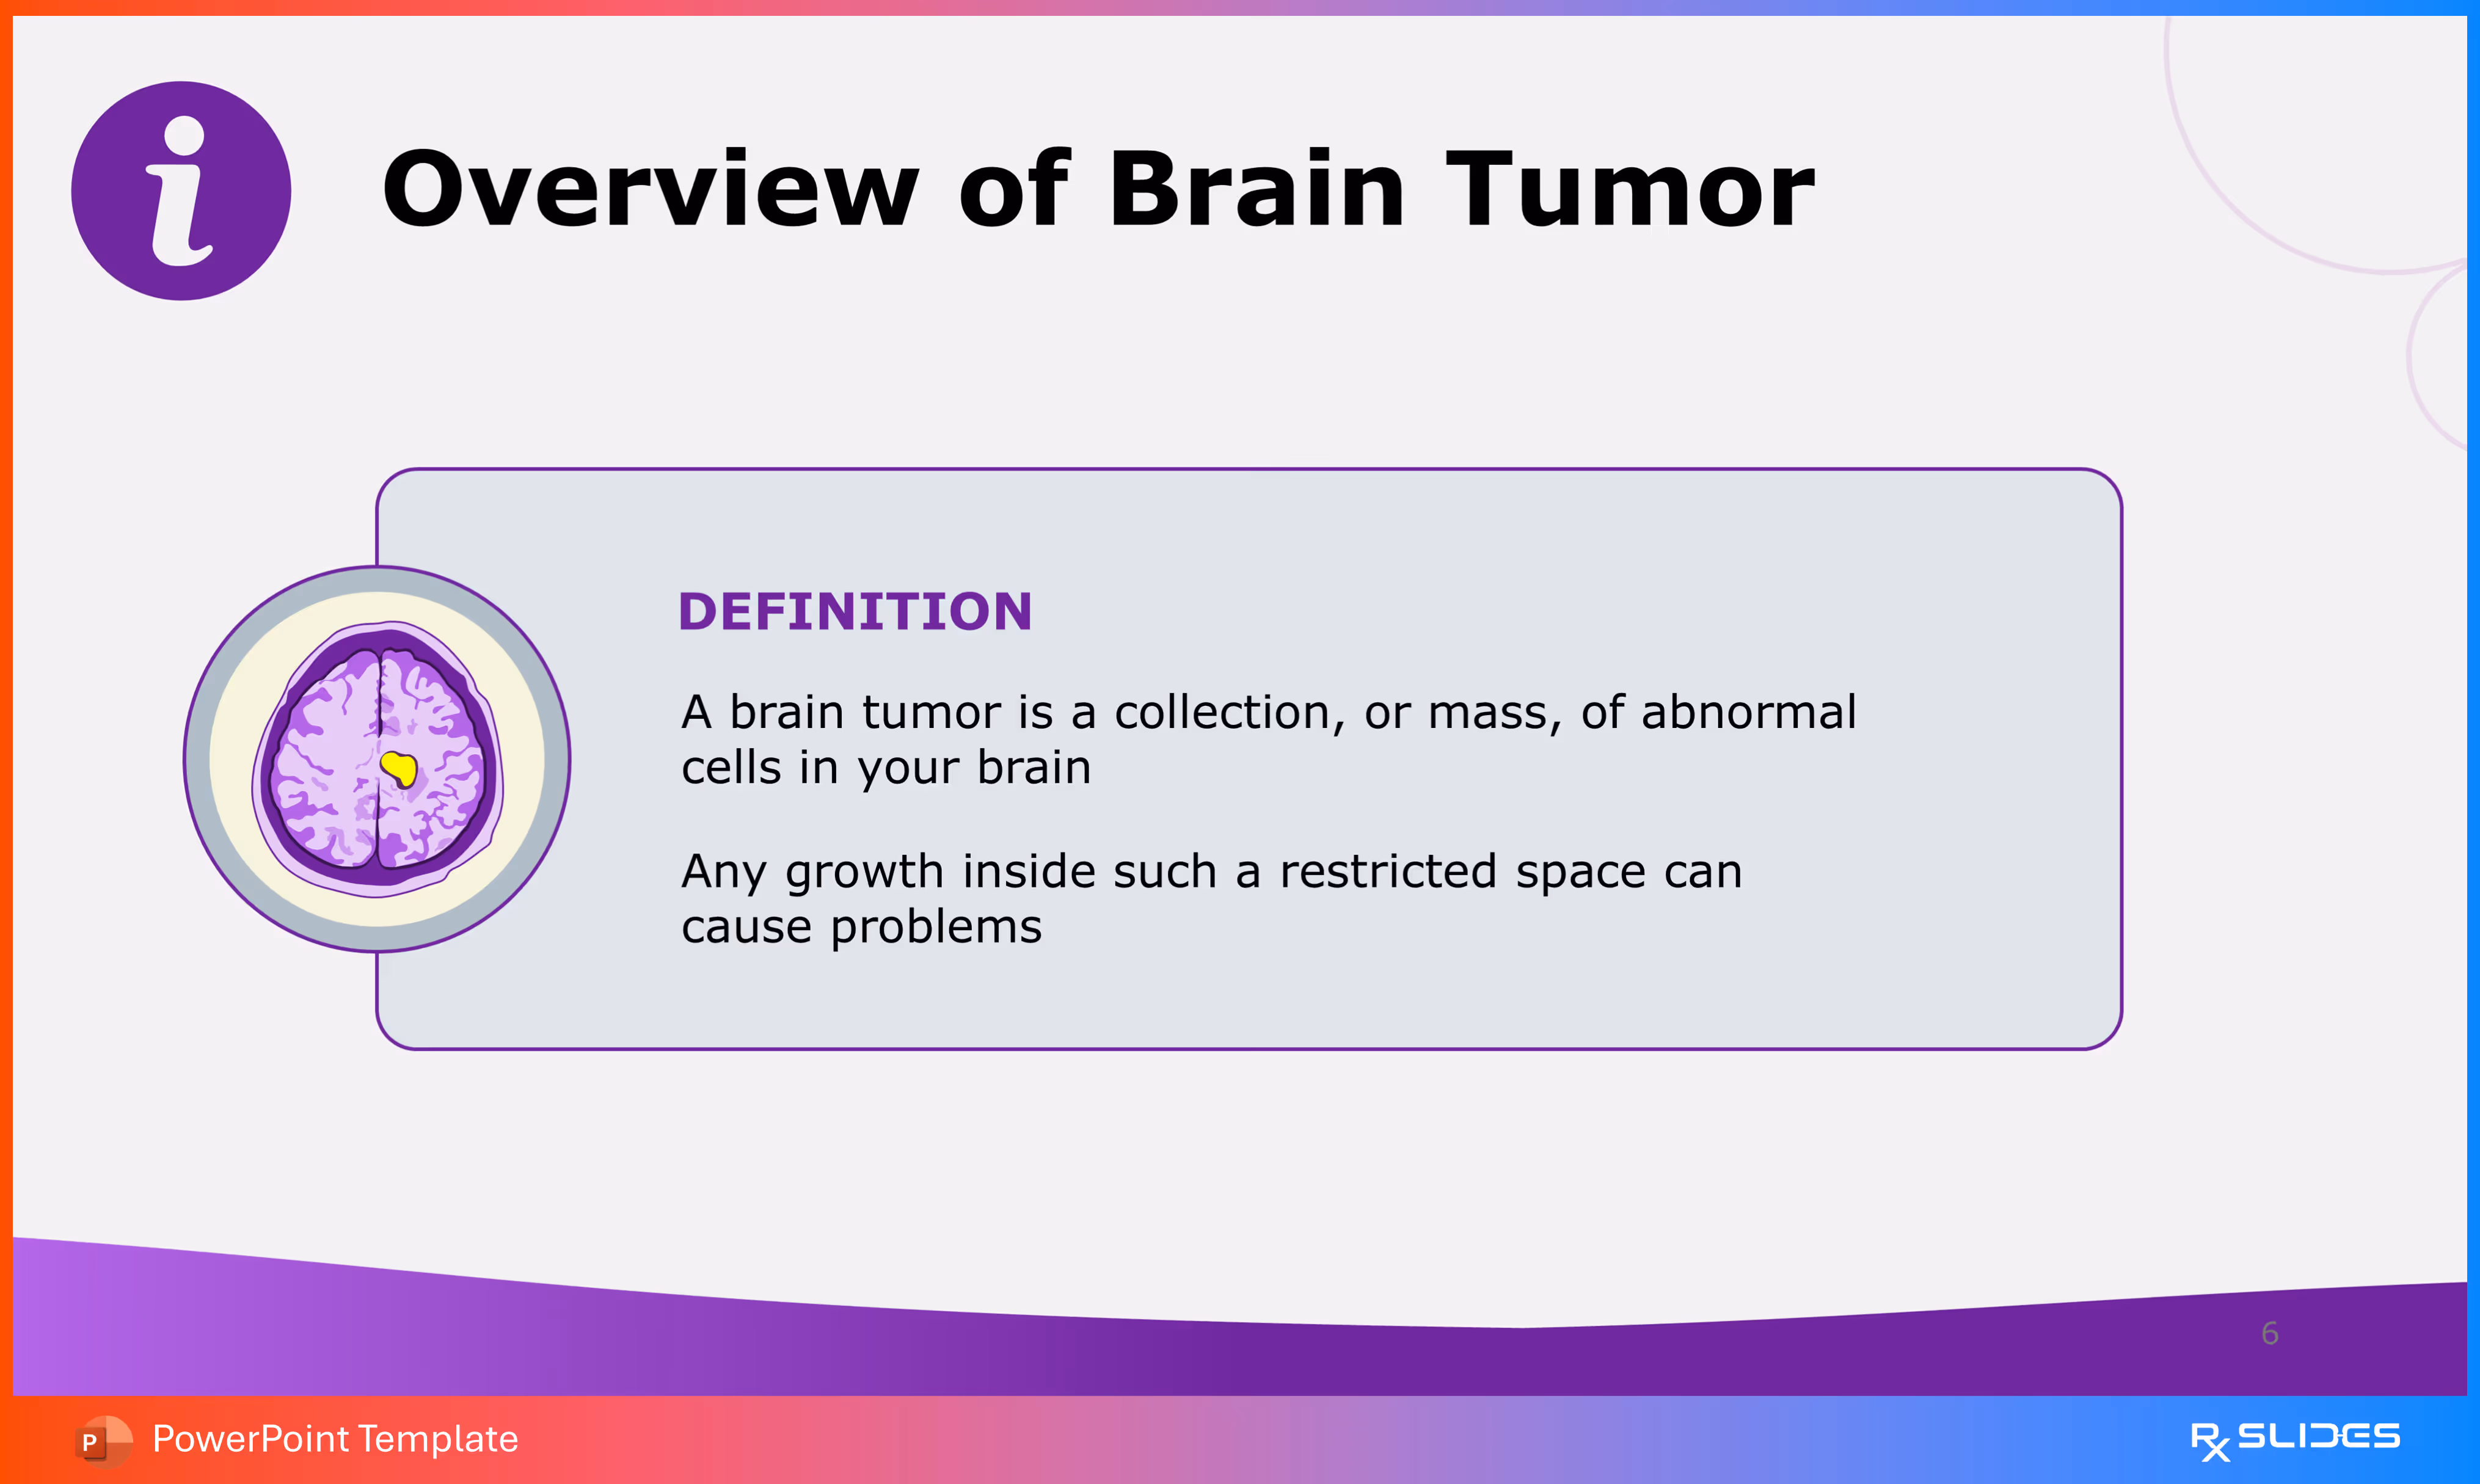
This slide provides a clean, self-contained summary of the Brain Tumor definition established in the previous slides, acting as an overview or a more concise informational slide.
- The slide features a large, purple-bordered rectangle that groups the main points together.
- Content:
- The section is clearly labeled "DEFINITION".
- The definition states a brain tumor is a collection, or mass, of abnormal cells in your brain.
- It also notes that any growth inside the brain's restricted space can cause problems.
- A small, consistent brain cross-section icon with a yellow tumor is placed inside the bounding box, reiterating the visual identity. A large purple 'i' icon is also present next to the main title.
Slide 7 - What is a Brain Tumor?
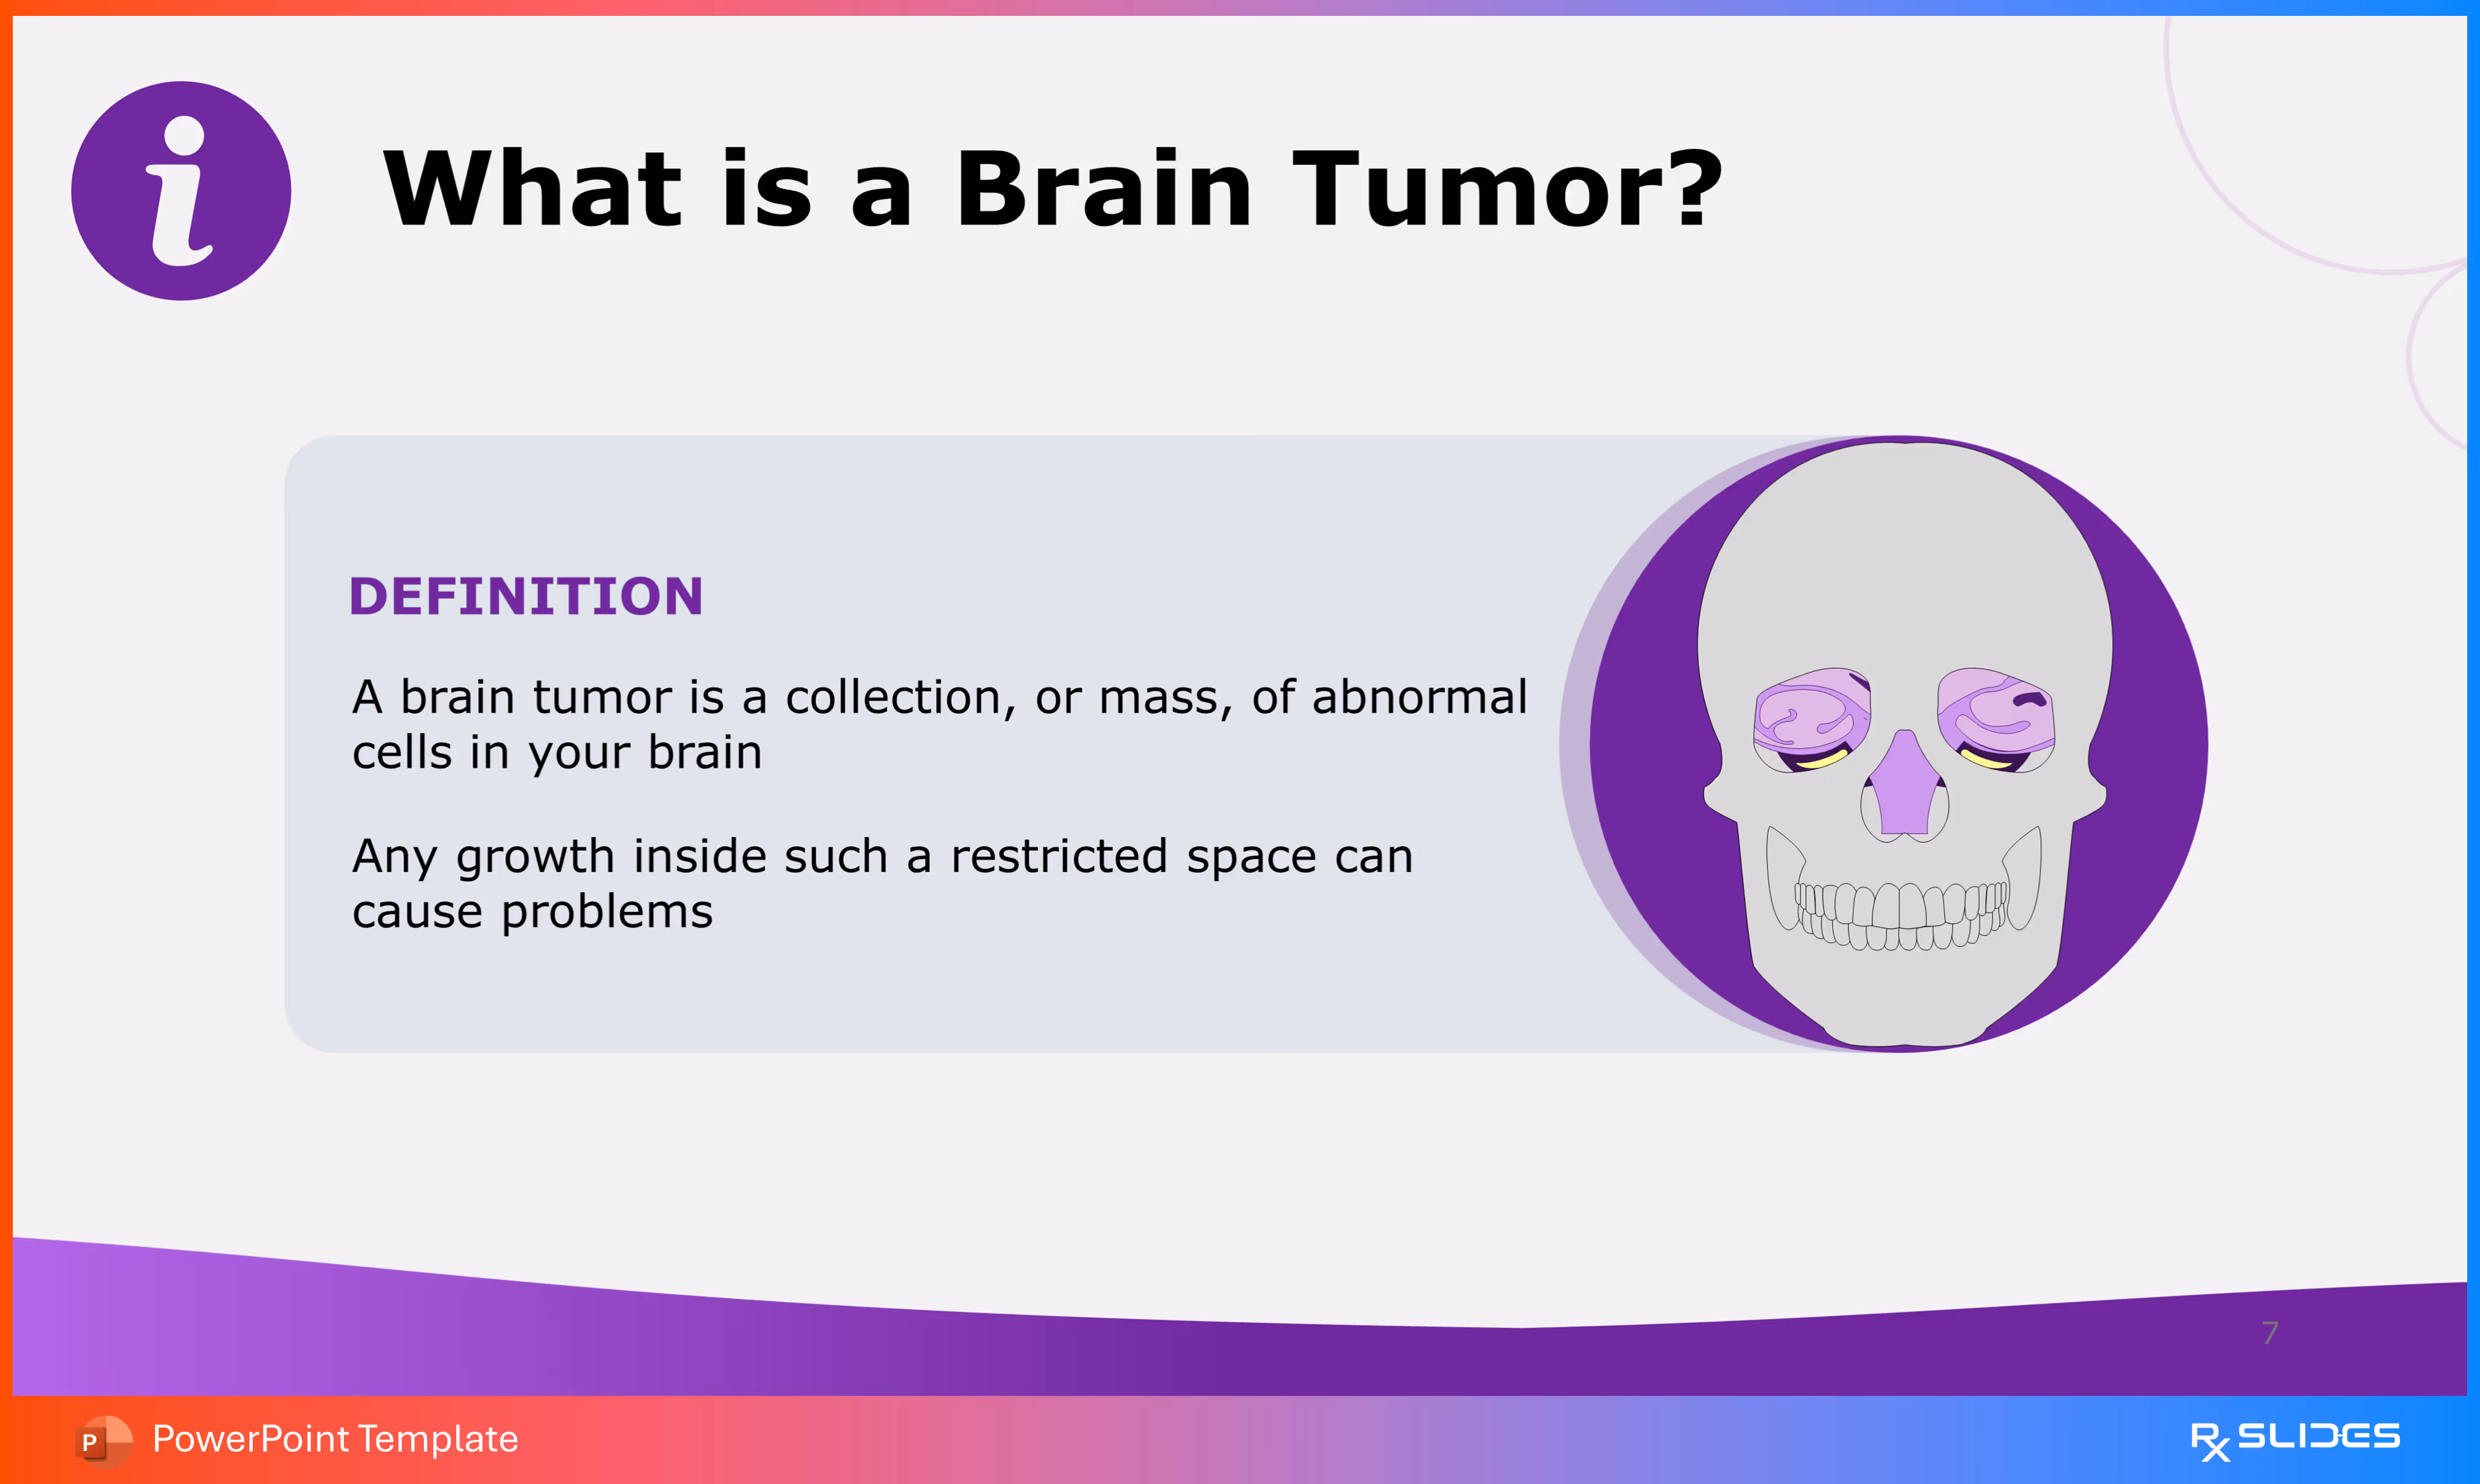
This slide provides another alternative layout for presenting the foundational definition of a Brain Tumor, this time featuring a large skull diagram to emphasize the anatomical location.
- A large purple 'i' icon is used again next to the title, signifying the informational nature of the content.
- The definition is contained within a large rectangular box with rounded corners.
- Content (DEFINITION):
- A brain tumor is defined as a collection, or mass, of abnormal cells in your brain.
- It reiterates the critical point that any growth inside a restricted space can cause problems.
- A simplified, large diagram of a skull is positioned to the right of the definition text. This visual variation grounds the definition within the skull, the restricted space mentioned in the text.
Slide 8 - Brain Tumor: Key Facts
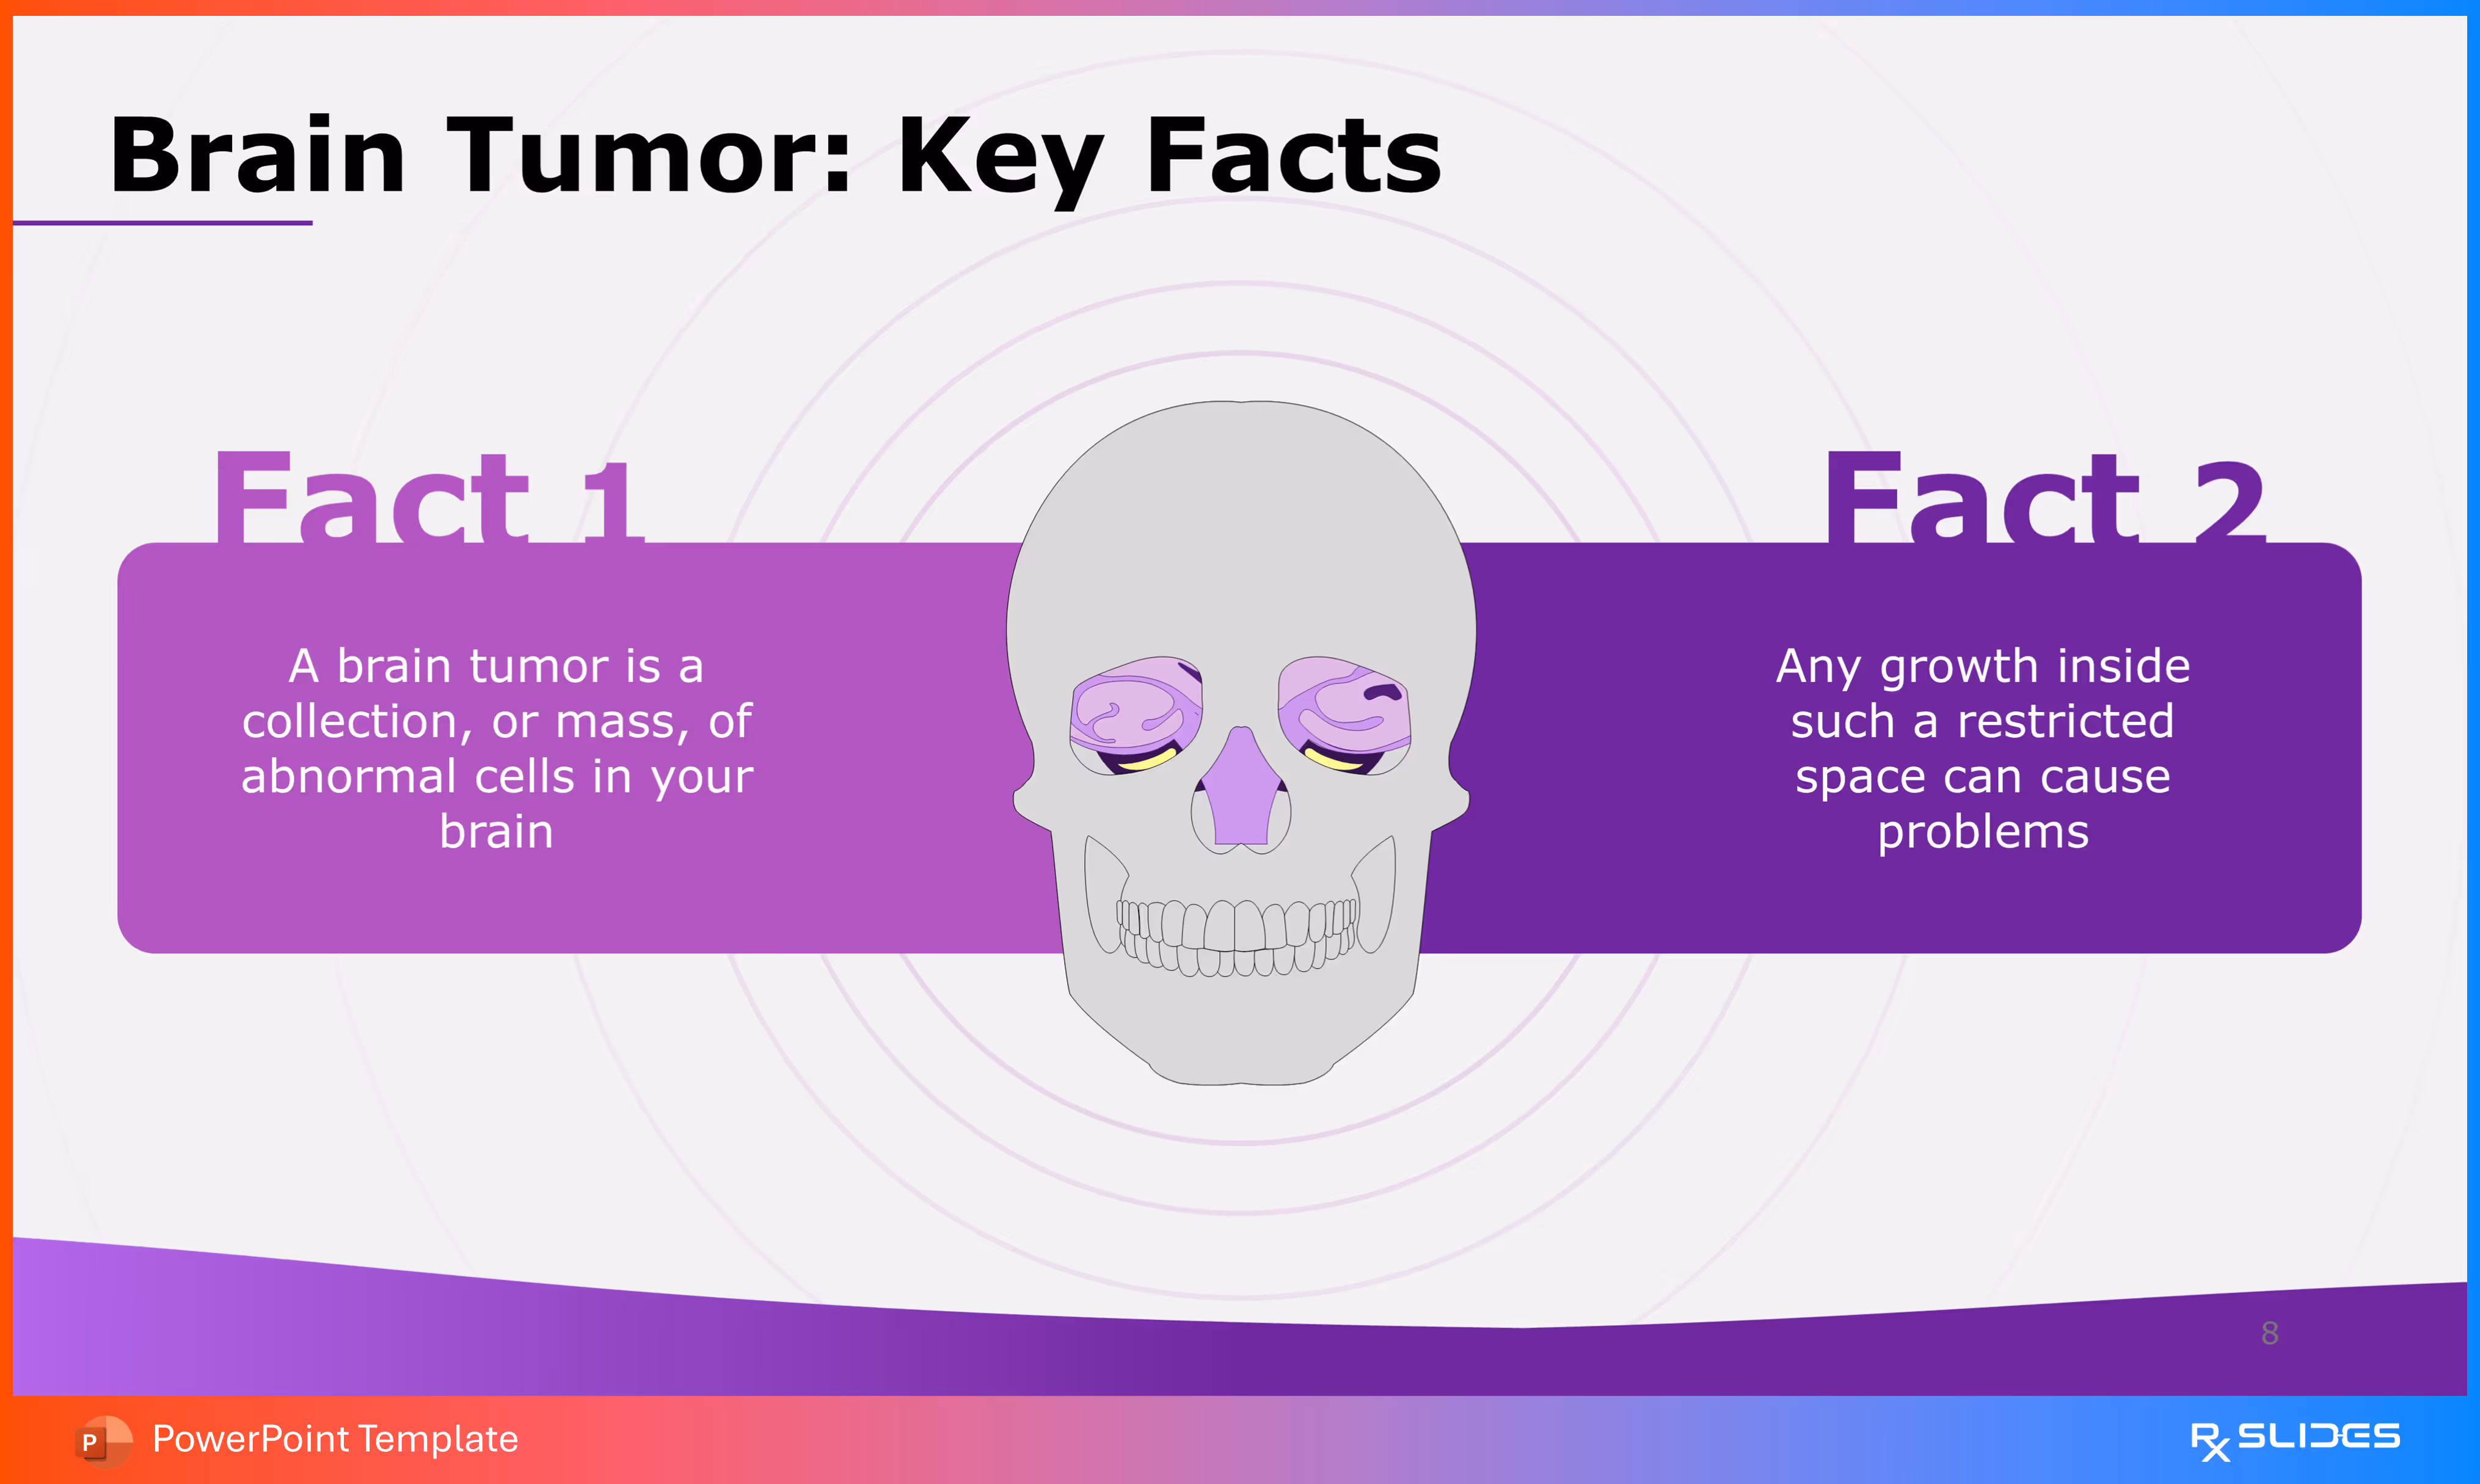
This slide consolidates the information from the previous slides (4, 5, and 7) into two primary Key Facts, using a high-impact horizontal layout centered on the skull visual.
- Key Fact 1: Labeled "Fact 1," it defines a brain tumor as a collection, or mass, of abnormal cells in your brain.
- Key Fact 2: Labeled "Fact 2," it explains the consequence: any growth inside such a restricted space can cause problems.
- The two facts are displayed within a long, purple horizontal block, separated by a central diagram of the skull. This design ensures the audience understands the definition and the anatomical challenge simultaneously.
Slide 9 - Section Divider: Epidemiology
This slide serves as a section divider, introducing the second major content area of the presentation: the Epidemiology (prevalence and incidence) of brain tumors.
- A large, circular graphic of the Earth (globe) is featured on the left, rendered in the template's signature purple color scheme. Yellow location pins are placed on various continents, symbolizing the global nature of the disease and setting the stage for statistical data.
Slide 10 - Epidemiological studies on Brain Tumor
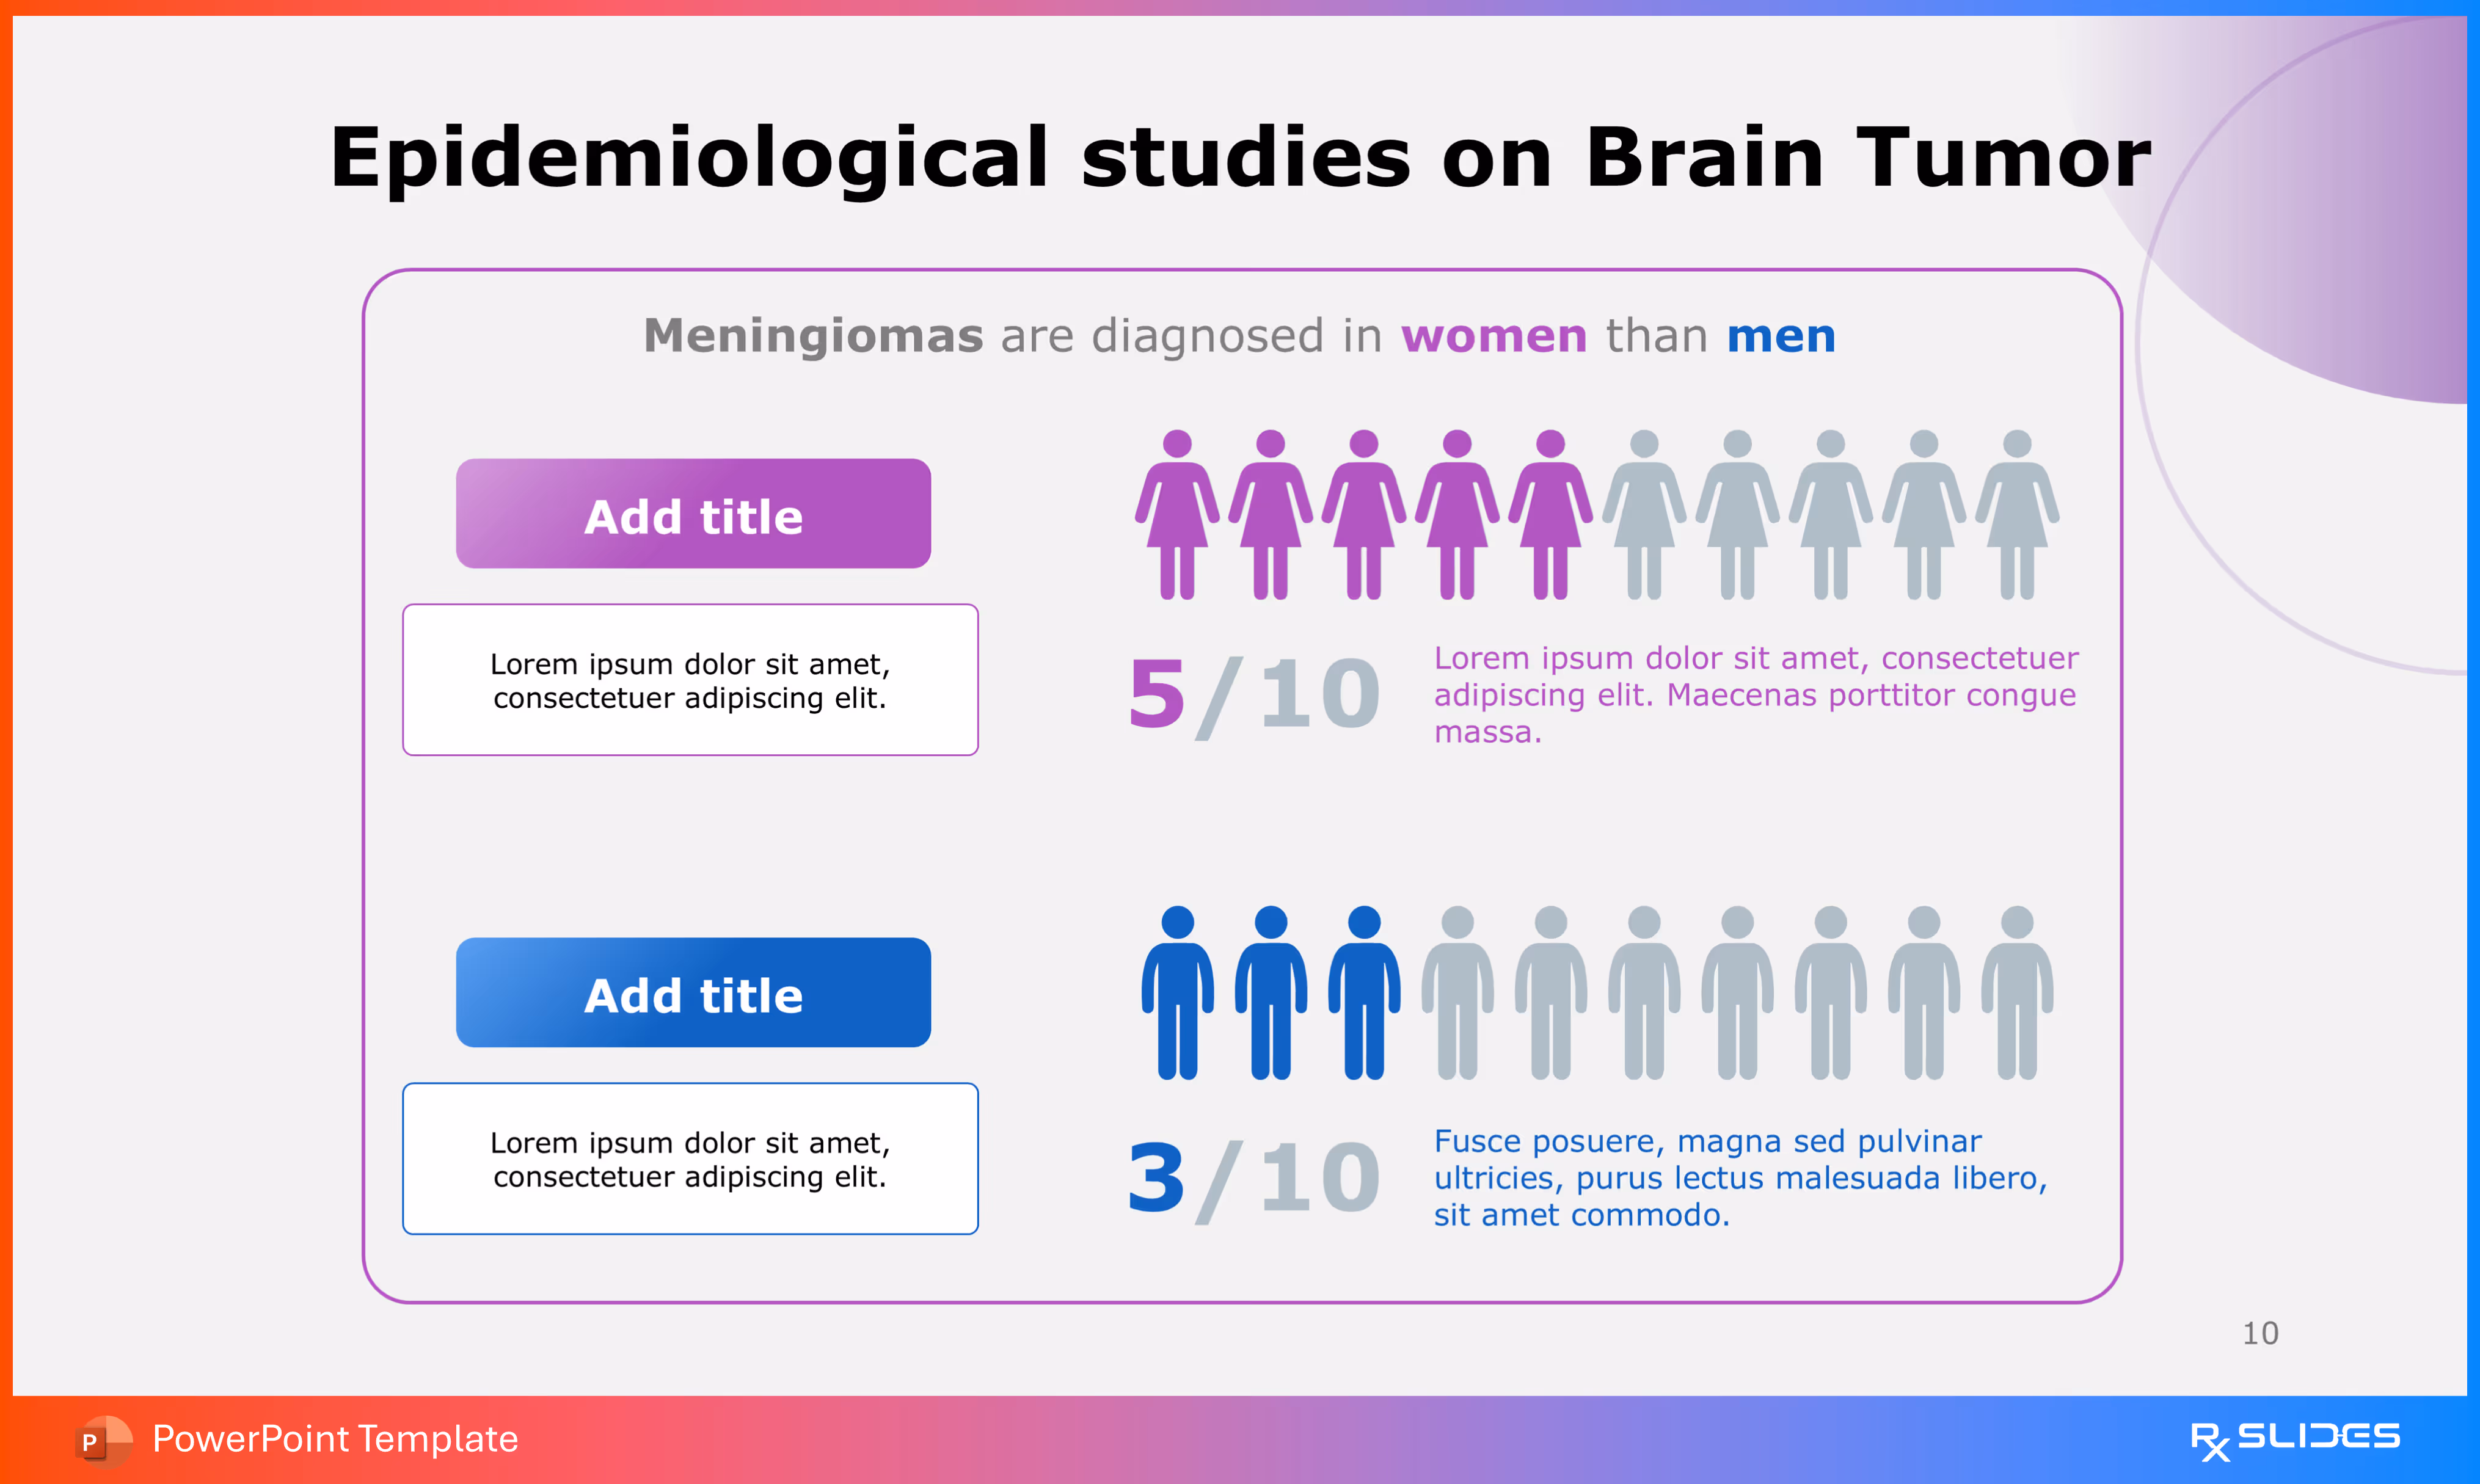
This slide provides a compelling visual breakdown of the gender distribution for one common type of brain tumor, likely Meningiomas, based on the headline.
- The slide highlights that Meningiomas are diagnosed more often in women than men.
- The slide uses icon arrays to visually communicate the gender ratio, paired with placeholder text boxes (Add title) for the presenter to insert specific data, context, or conclusions related to the highlighted statistics.
Slide 11 - Brain Tumor Epidemiology (Alternative Layout)
.avif)
This slide presents epidemiological data, specifically focusing on the gender distribution of Meningiomas, using a slightly different visual approach than Slide 10, including percentage figures.
- The slide reiterates that Meningiomas are diagnosed more frequently in women than men.
- Gender Statistics (Percentage & Icon Array):
- Women (Top, Purple): Shows ْْX0% and five purple circles out of ten filled in, representing the ratio.
- Men (Bottom, Blue): Shows X0% and three blue circles out of ten filled in.
- This layout features two separate icon arrays and percentages for a direct, high-contrast comparison. Placeholder text is included on the left for the presenter to add descriptive context, source data, or a key takeaway.
Slide 12 - Brain Tumor Statistics (Alternative Layout 3)
.avif)
This slide provides a third, high-impact alternative layout for presenting the gender distribution statistics for brain tumors, specifically noting the higher diagnosis rate for Meningiomas in women.
- The footer confirms the slide focuses on the fact that Meningiomas are diagnosed in women than men.
- Gender Statistics:
- Male (Blue): Represented by a large blue figure, with a 30% placeholder.
- Female (Purple): Represented by a large purple figure, with a 50% placeholder.
- This is the most visually bold statistical slide, using large, full-body icon graphics and prominent percentage circles. It includes text boxes on both the left and right for adding specific contextual information or data sources.
- A central gradient bar visually connects and compares the two percentages.
Slide 13 - Brain Tumor Distribution (Schwannomas)
.avif)
This slide provides another data point in the Epidemiology section, using a clear icon array comparison to discuss the distribution of Schwannomas.
- The slide explicitly states that Schwannomas occur in both women than men, suggesting a more balanced or similar incidence rate between genders compared to the previous slides on Meningiomas.
- The layout uses two distinct icon arrays and percentage placeholders for men and women, positioned side-by-side with separate text boxes to provide context or specific data points for Schwannomas.
Slide 14 - Brain Tumor Facts & Global Patterns
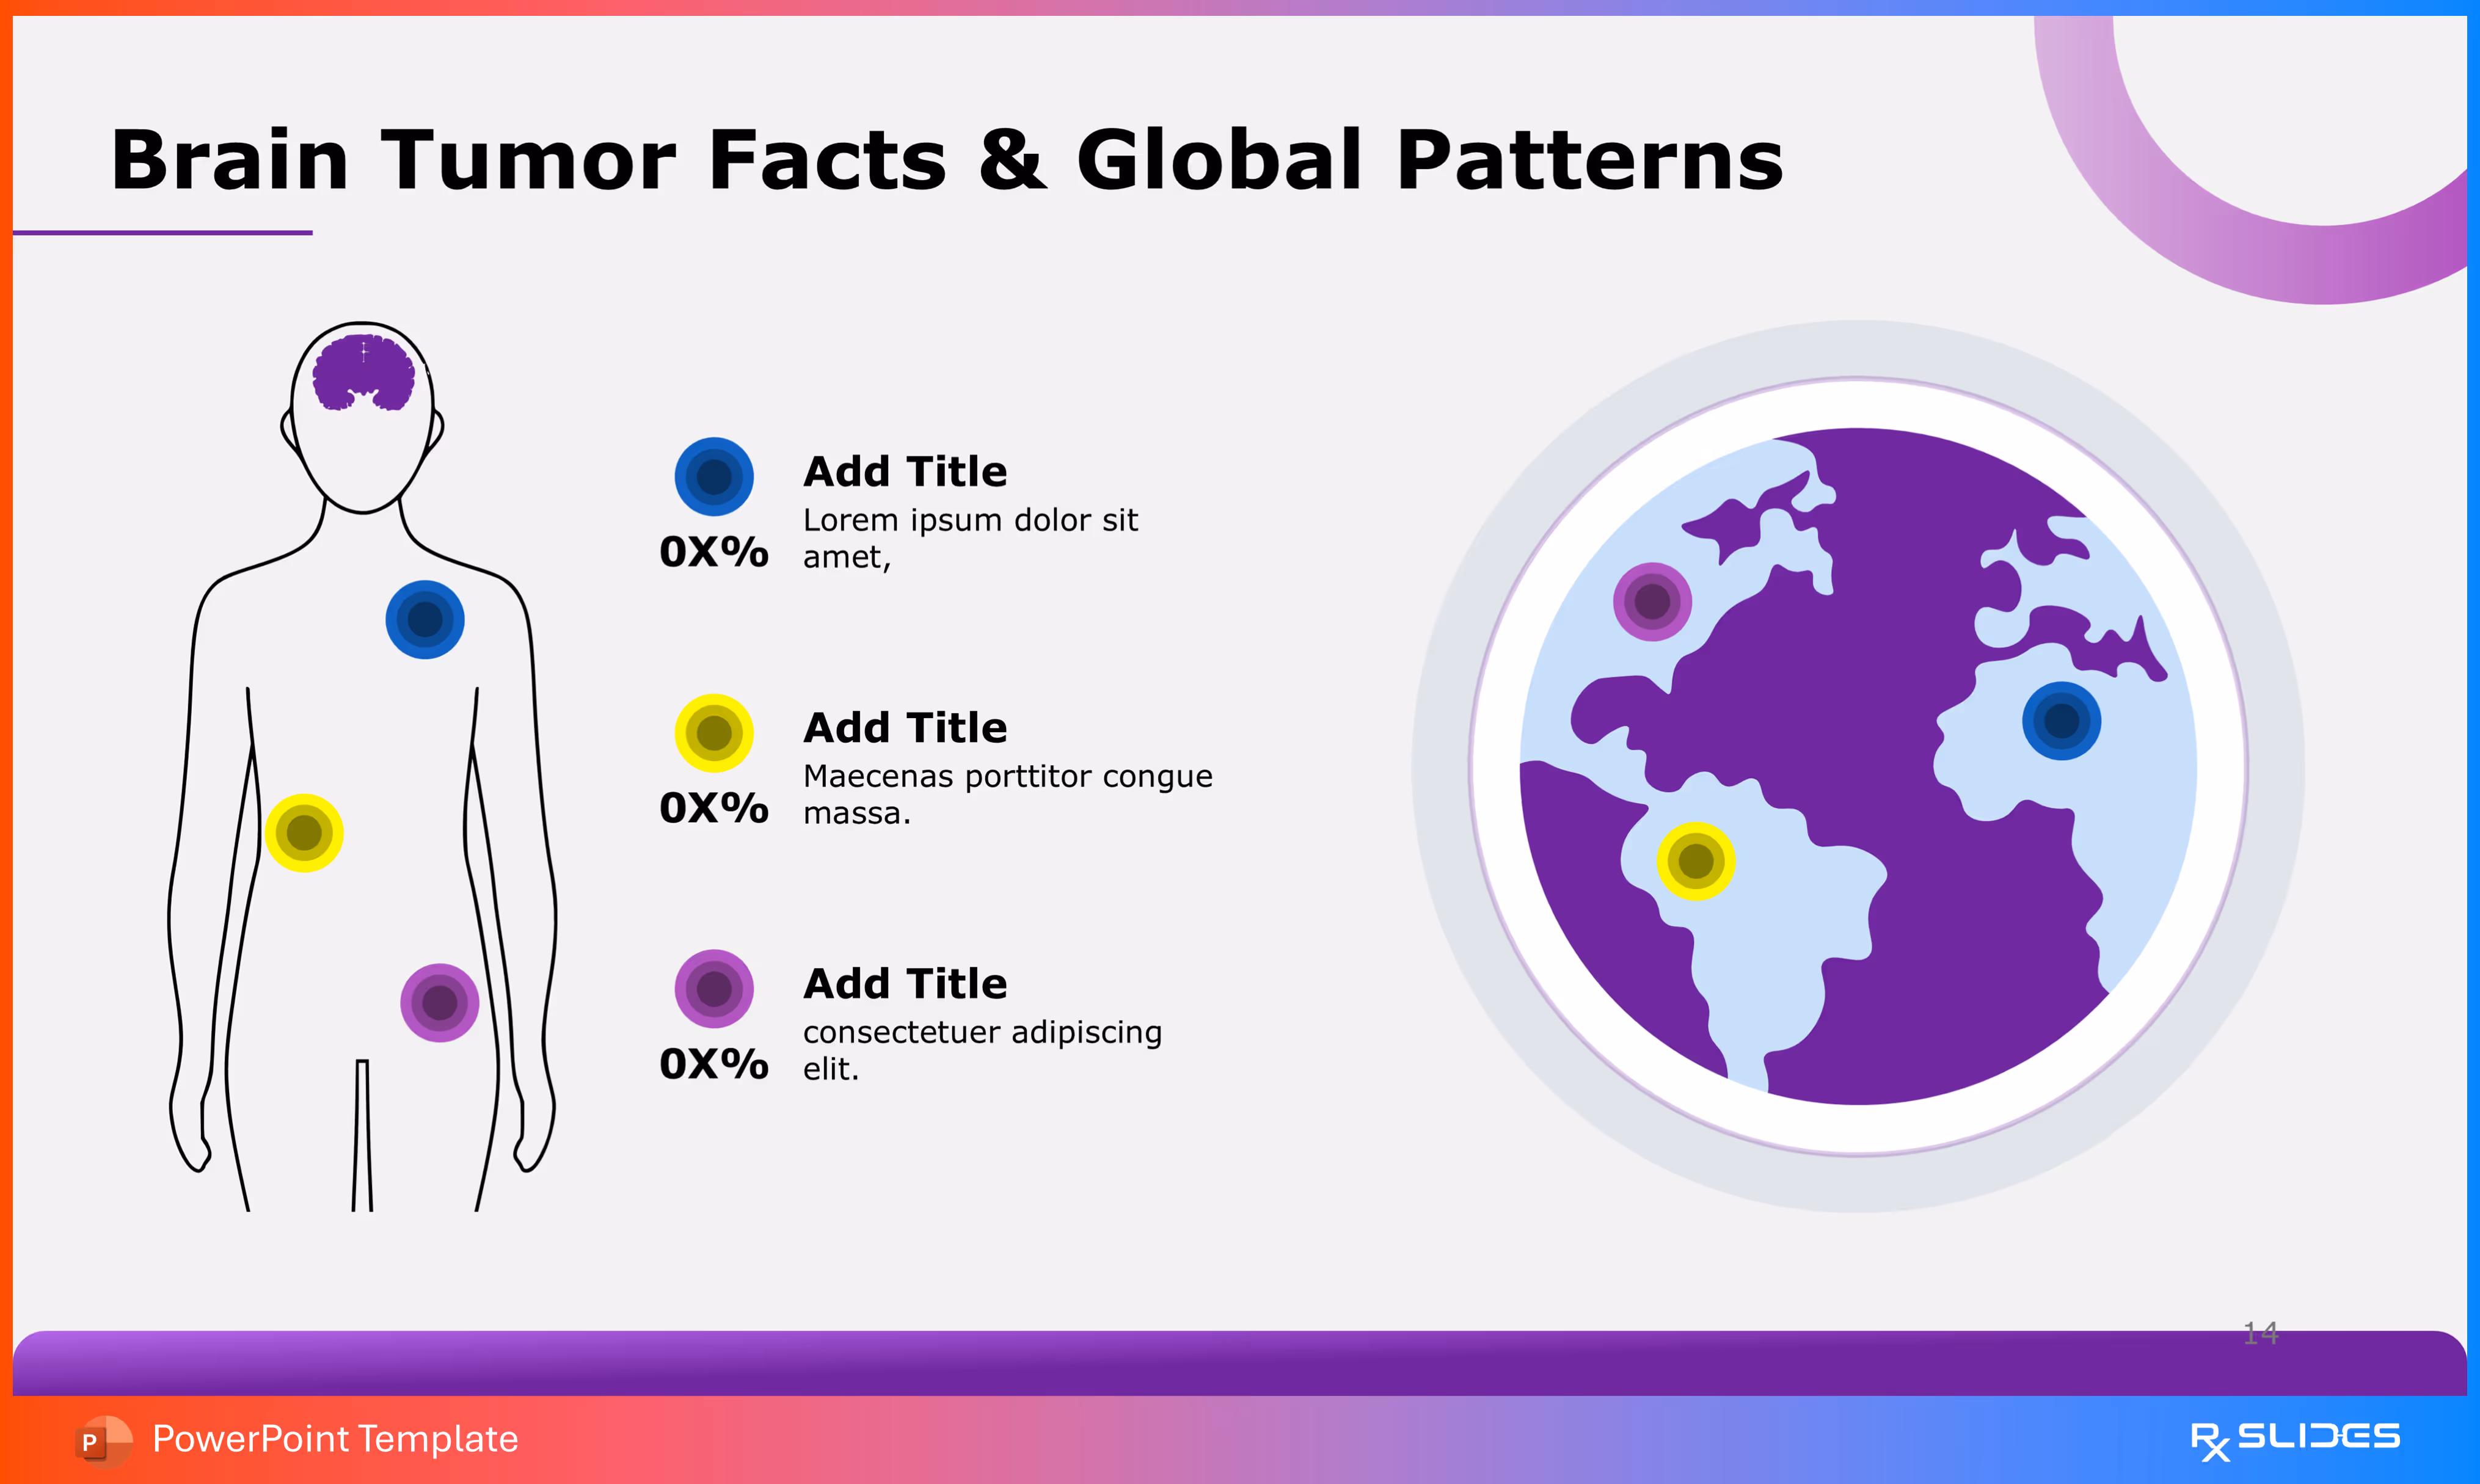
This slide provides a high-level, dual-focus visual layout for discussing both the geographical prevalence and the anatomical distribution of different types of tumors or cancers.
- Anatomical Distribution (Left):
- A stylized outline of a human body is featured, with three distinct colored circles (Blue, Yellow, Purple) placed at the head, chest, and lower abdomen, symbolizing different cancer or tumor types/locations across the body.
- Each circle is associated with a text box for an "Add Title" and a percentage placeholder "0X%," allowing the presenter to specify the prevalence of tumors in these anatomical regions or of these specific types.
- Global Patterns (Right):
- A large, circular graphic of the Earth (globe) is shown in the template's purple scheme.
- The same three colored circles (Blue, Yellow, Purple) are placed over different continents, illustrating the global pattern or distribution of the tumors being discussed.
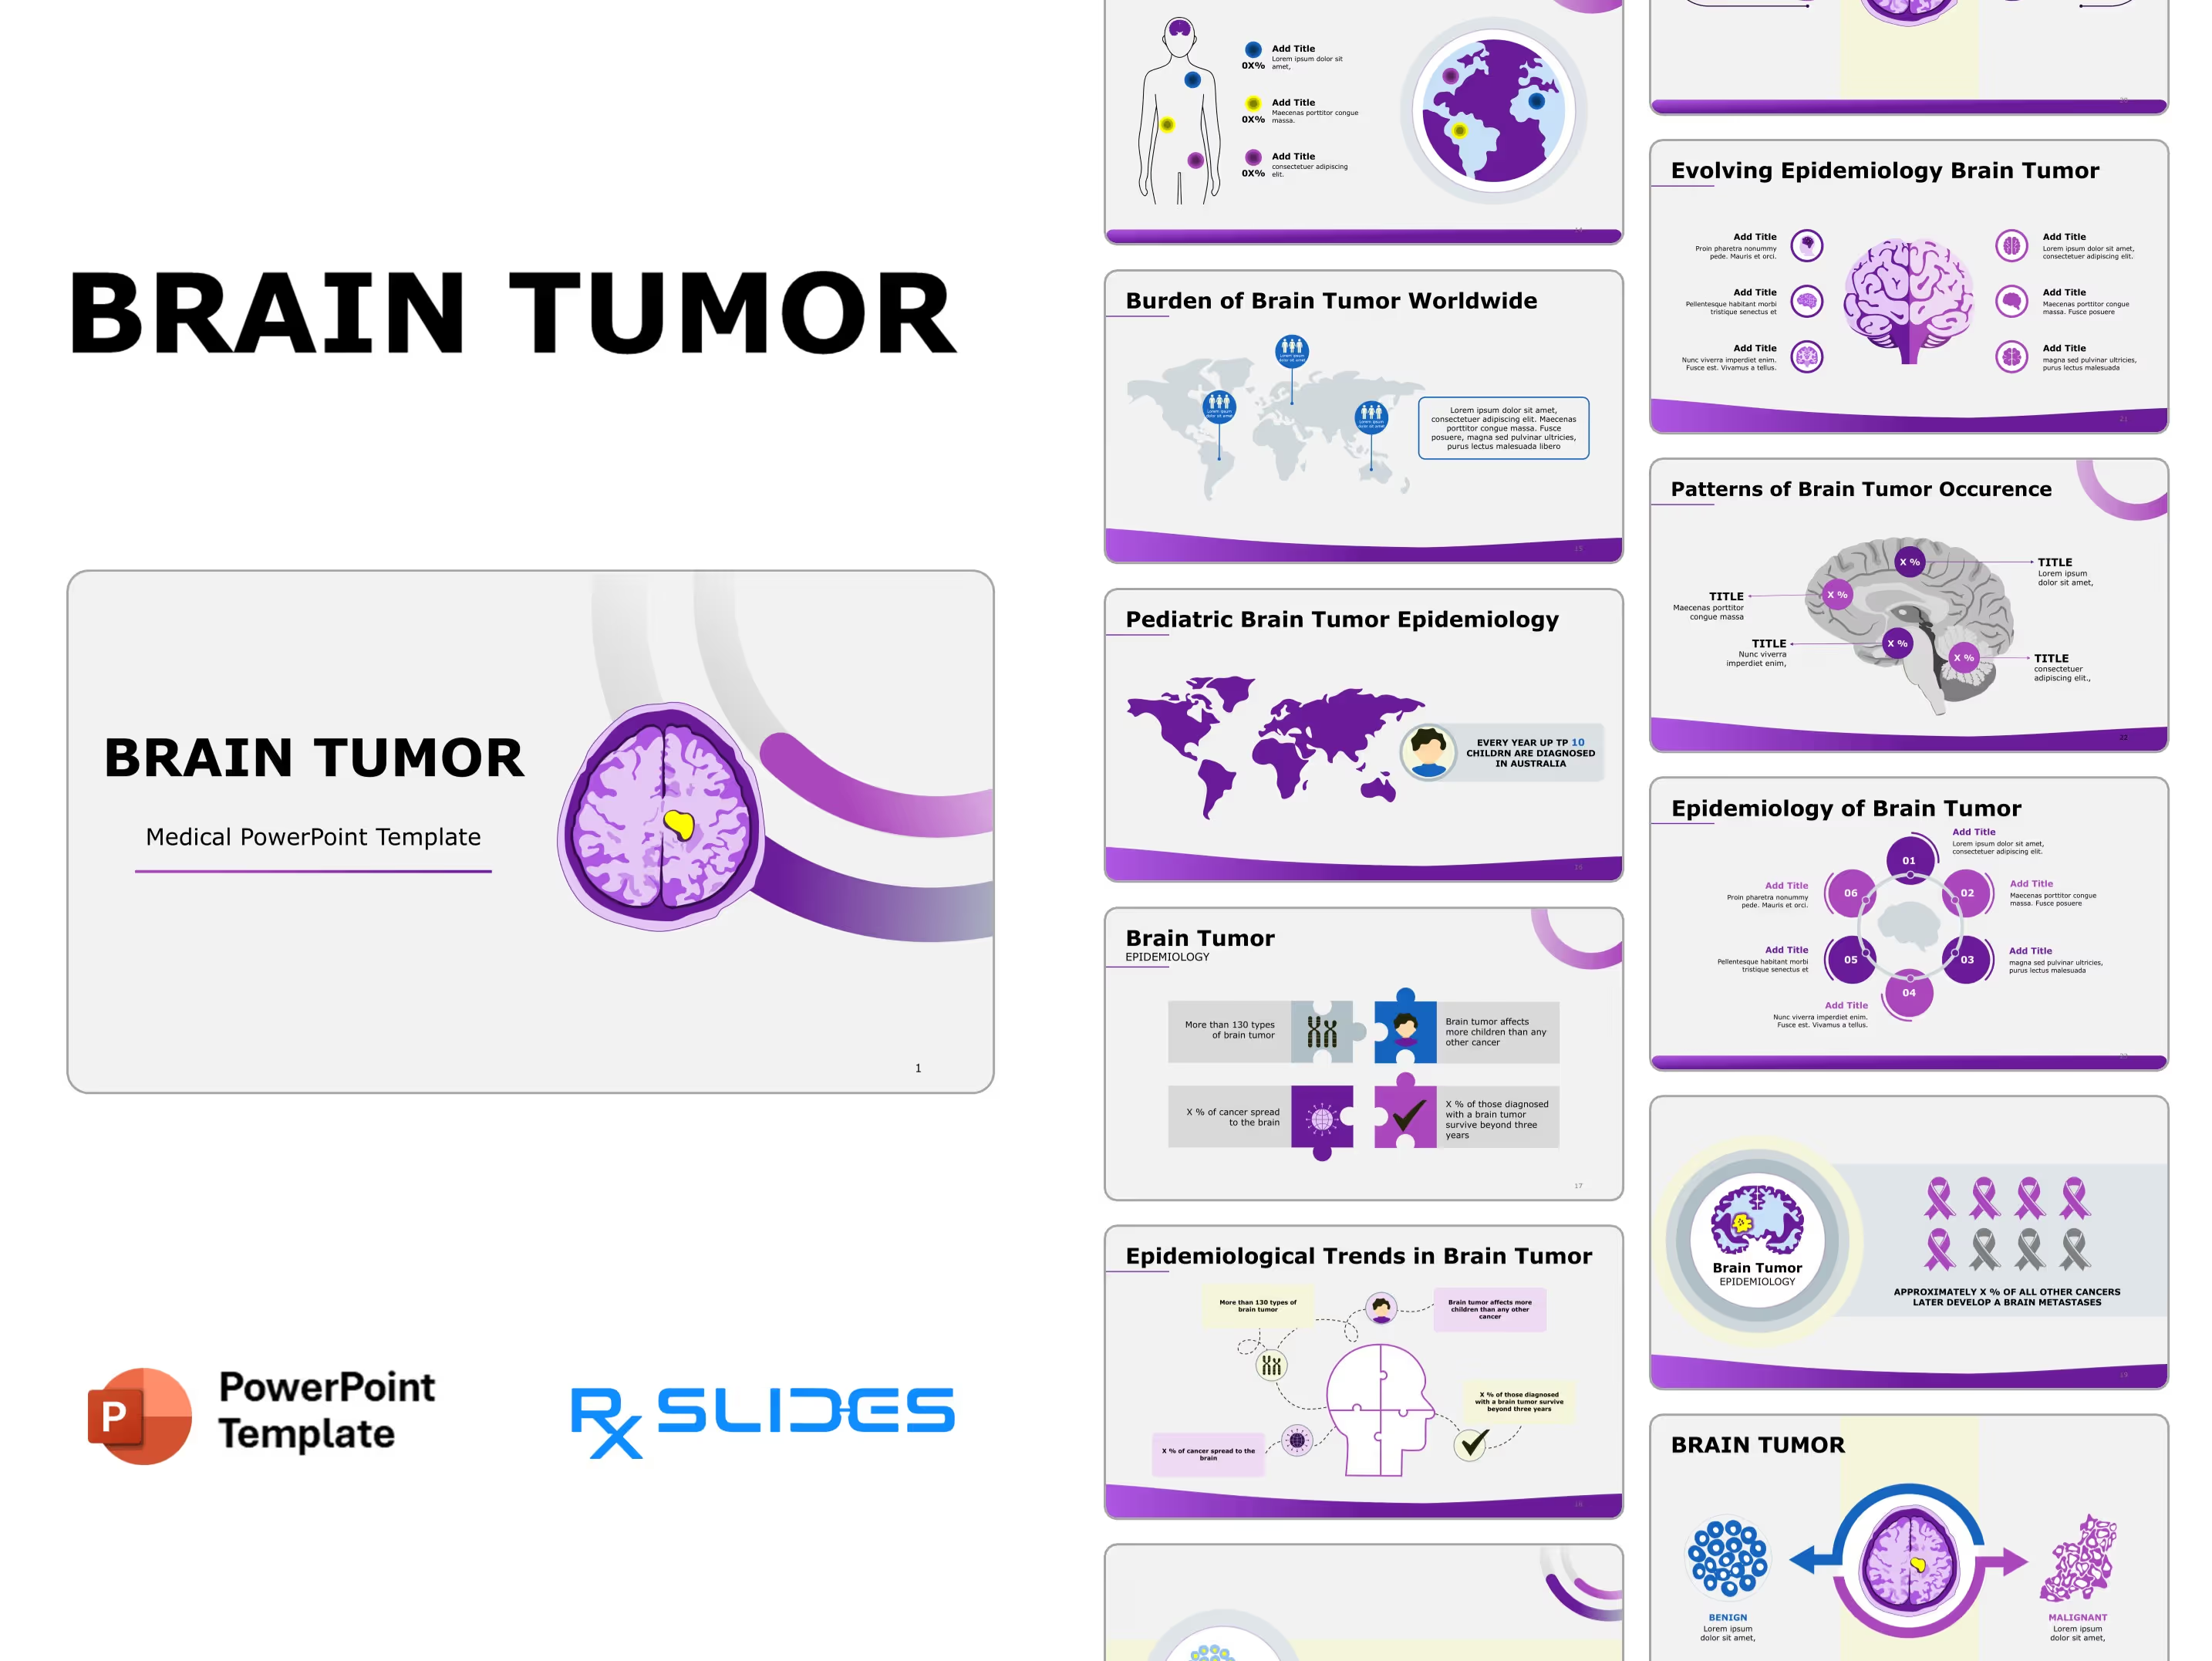
Slide 15 - Burden of Brain Tumor Worldwide
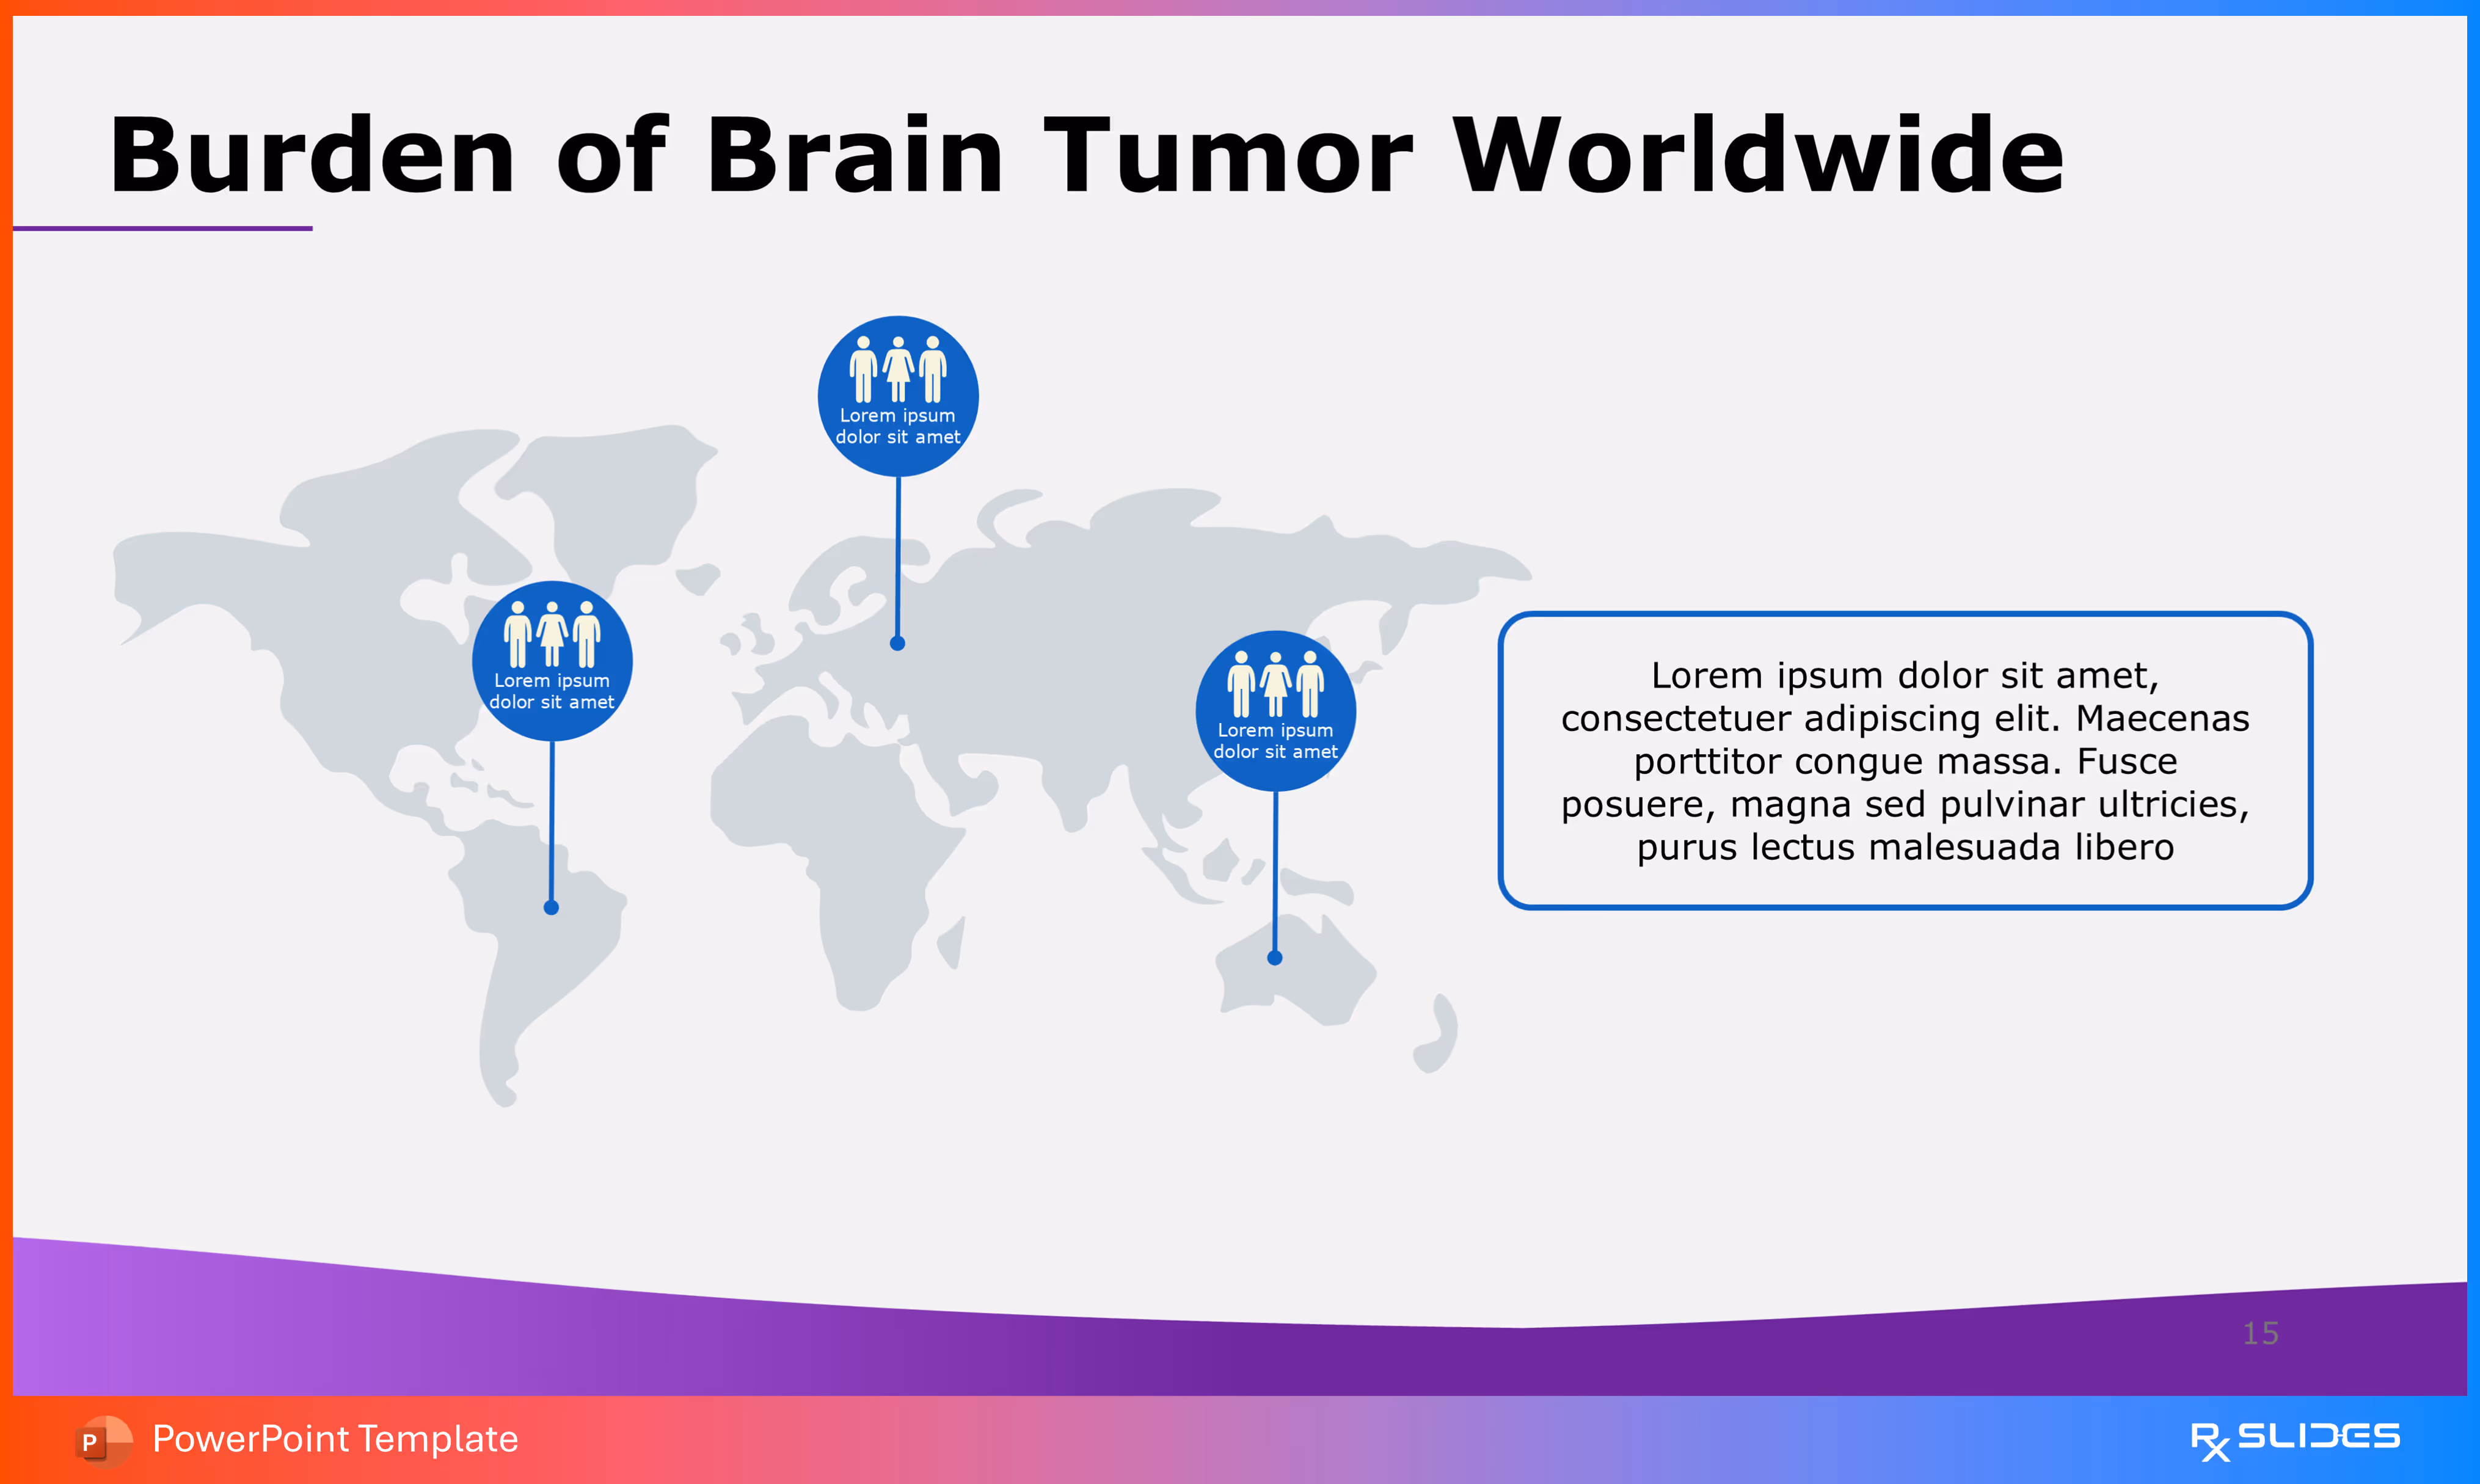
This slide is designed to visually present the global impact and distribution of brain tumors, allowing the presenter to highlight key regions or demographic statistics.
- The centerpiece is a large, grey-and-white world map.
- Data Points:
- There are three blue location pins placed on different continents (North America, Africa/Europe, Asia).
- Each pin features a circular icon with small male and female figures, indicating that the data relates to a specific population statistic or a gender-balanced demographic.
- A large text box on the right is provided for the presenter to insert the main contextual summary, conclusion, or a detailed explanation of the global burden.
Slide 16 - Pediatric Brain Tumor Epidemiology
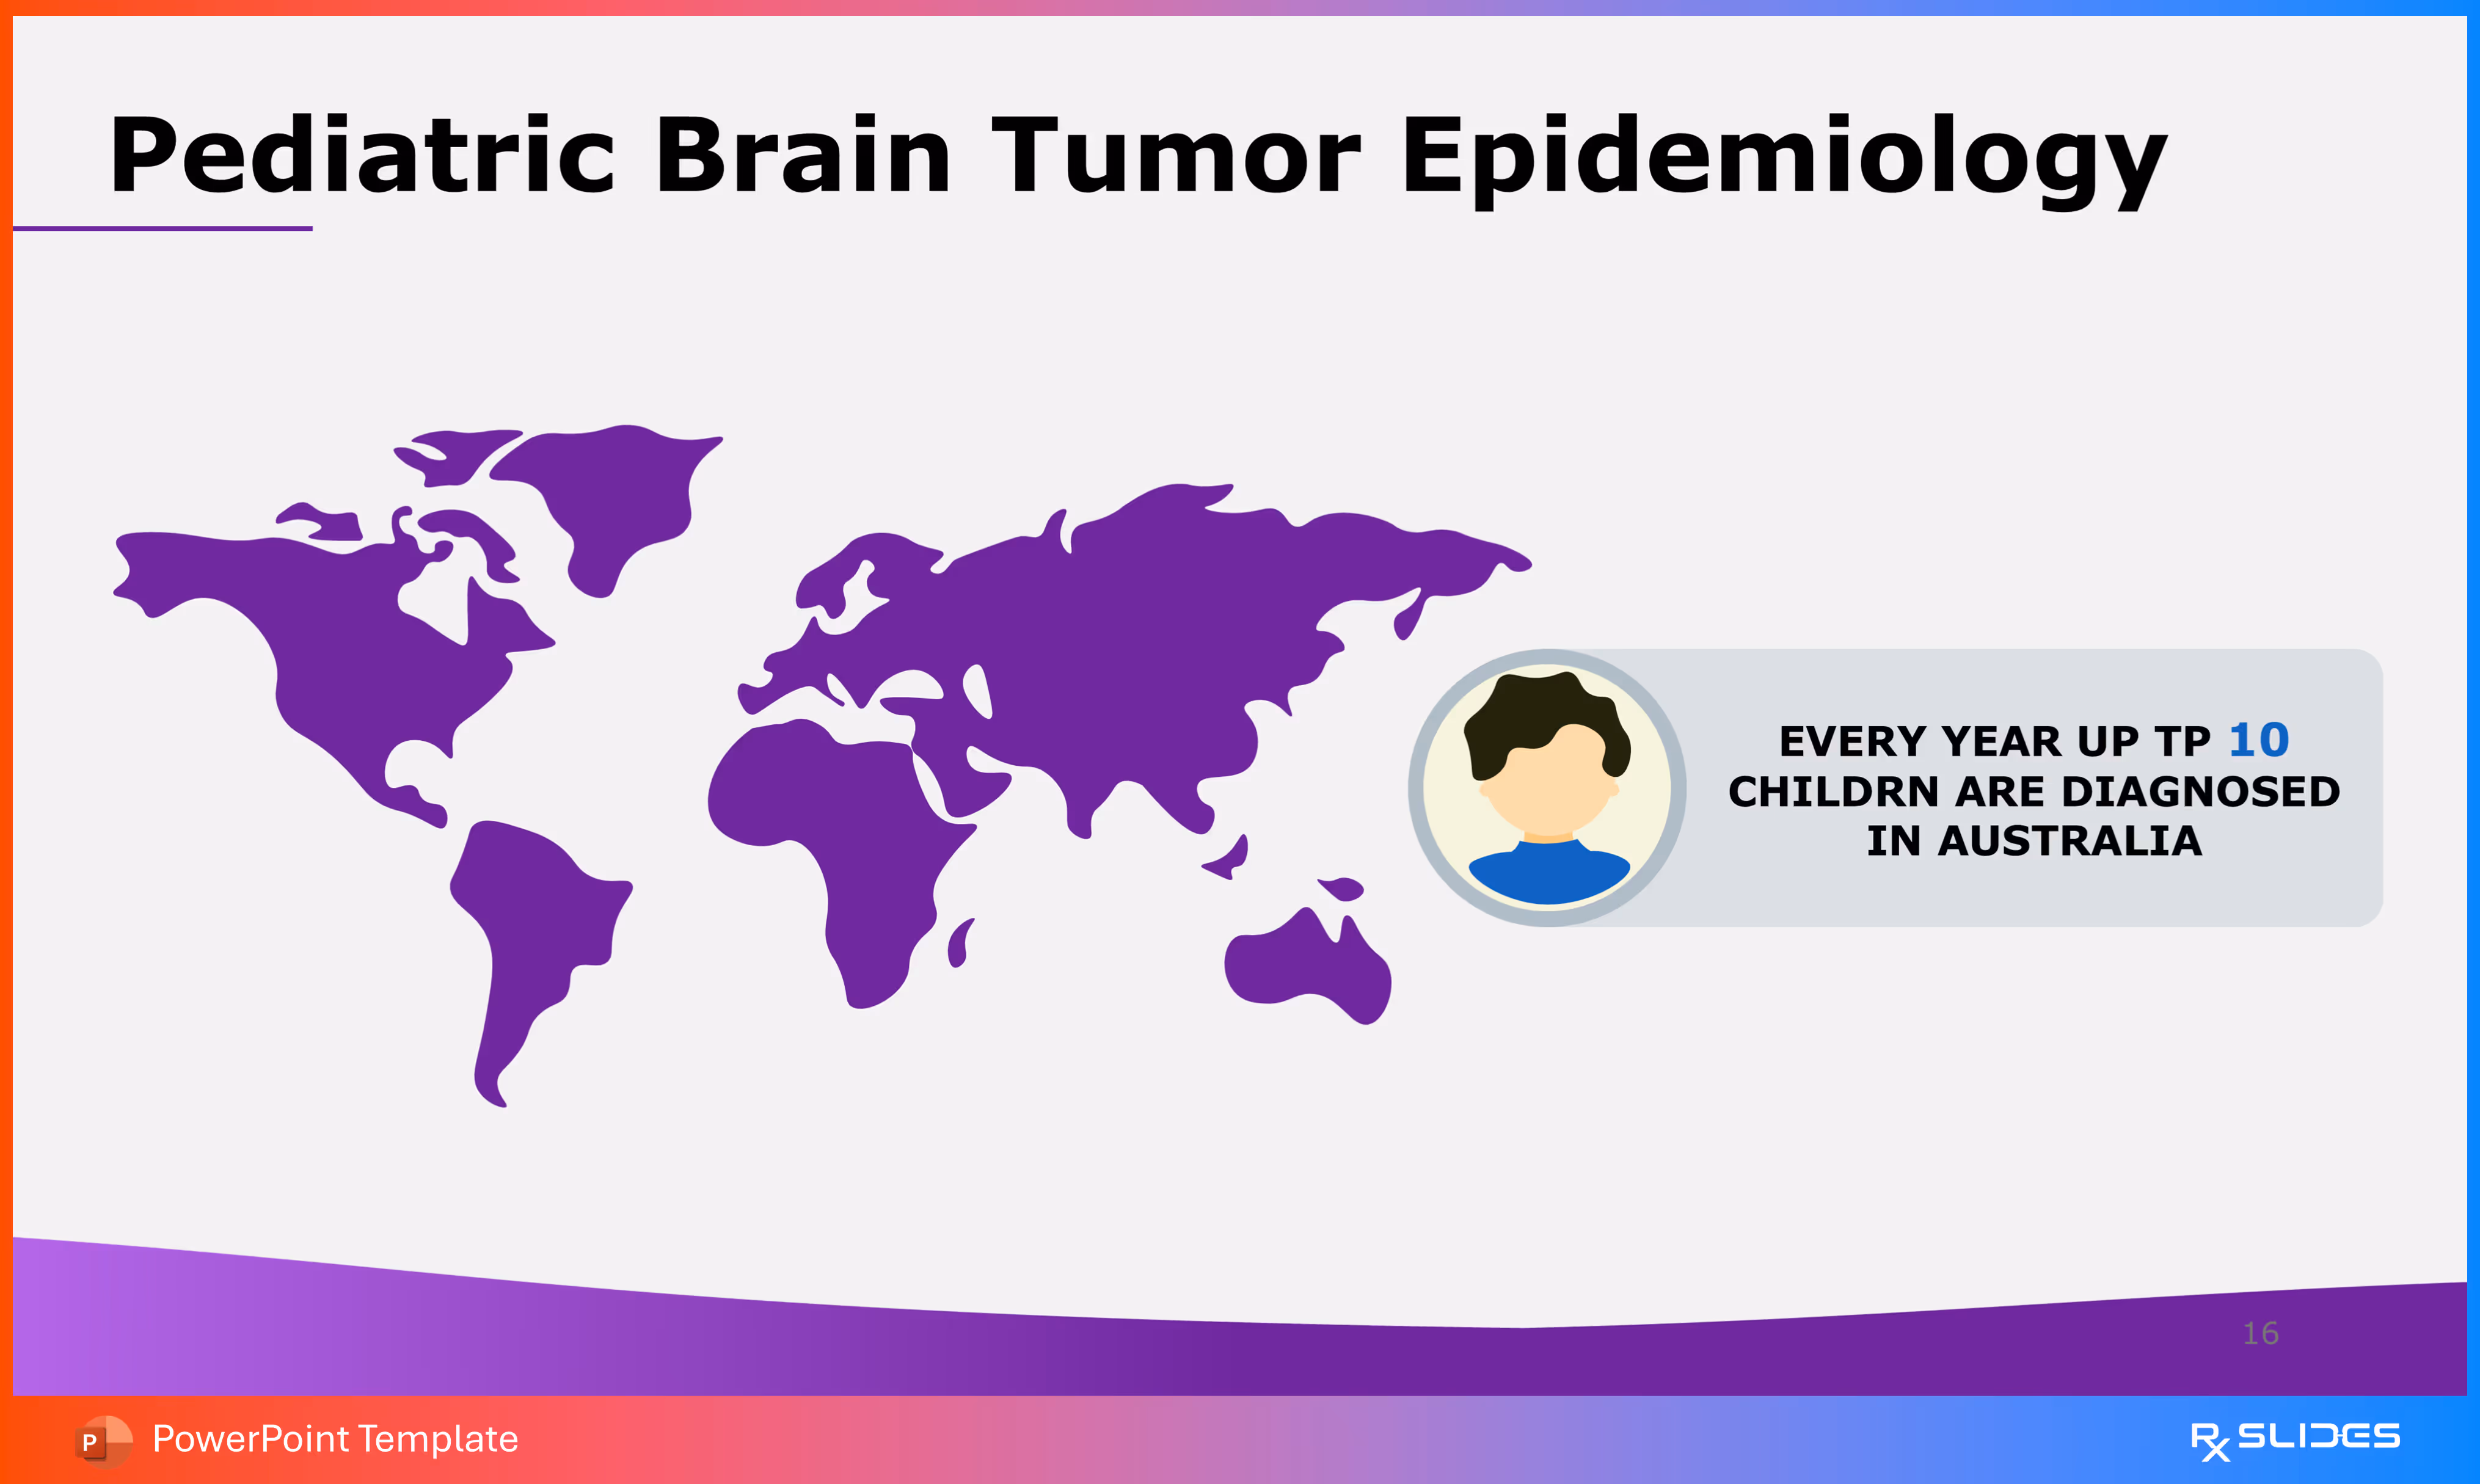
This slide focuses on the global burden of brain tumors in children, highlighting a specific statistic for a single country.
- The primary visual is a large, solid purple world map.
- A call-out box features an icon of a child and provides a specific data point: "EVERY YEAR UP TP 10 CHILDN ARE DIAGNOSED IN AUSTRALIA". This statistic serves as an example of regional incidence data.
Slide 17 - Brain Tumor: Epidemiology (Key Facts)
.avif)
This slide uses a visually engaging four-piece puzzle graphic to summarize key epidemiological facts about brain tumors and cancer.
- Key Facts (Organized in a 2x2 Puzzle Grid):
- Top Left (Grey/White): "More than 130 types of brain tumor". The accompanying icon is a pair of chromosomes (XX), suggesting genetic complexity.
- Top Right (Blue): "Brain tumor affects more children than any other cancer". The icon is a stylized child's face/figure.
- Bottom Left (Purple): "X % of cancer spread to the brain" (placeholder). The icon is a globe with arrows radiating outward, symbolizing metastatic spread.
- Bottom Right (Magenta): "X % of those diagnosed with a brain tumor survive beyond three years" (placeholder). The icon is a check mark, representing survival rates.
Slide 18 - Epidemiological Trends in Brain Tumor (Infographic)
.avif)
This slide presents the same four epidemiological facts as Slide 17 but uses a different visual style, connecting the facts to the four quadrants of a stylized puzzle-piece brain/head.
- A large, central line drawing of a human head is divided into four puzzle pieces. The four key facts are connected to the main graphic via dashed lines.
- Key Facts (Connected to Puzzle Head):
- Top Left: Focuses on the number of types: "More than 130 types of brain tumor". The icon is a pair of chromosomes.
- Top Right: Focuses on the pediatric impact: "Brain tumor affects more children than any other cancer". The icon is a stylized child's figure.
- Bottom Left: Focuses on metastasis: "X % of cancer spread to the brain" (placeholder). The icon is a globe with arrows.
- Bottom Right: Focuses on survival: "X % of those diagnosed with a brain tumor survive beyond three years" (placeholder). The icon is a check mark.
Slide 19 - Brain Tumor: Epidemiology (Metastasis Statistic)
.avif)
This slide focuses on the statistic of other cancers leading to brain metastasis, using a stark visual comparison of ribbon icons.
- Visual Element (Left): A large, central graphic of the brain cross-section with a yellow tumor is shown, with the subtitle "EPIDEMIOLOGY".
- Visual Element (Right): A striking array of ten cancer ribbon icons is displayed.
- Five ribbons are colored purple, while three are colored grey.
- The text states: "APPROXIMATELY X % OF ALL OTHER CANCERS LATER DEVELOP A BRAIN METASTASES" (placeholder).
- The ribbon icon array is designed to visually represent the percentage that develops metastasis versus those that do not.
Slide 20 - Incidence of Brain Tumor
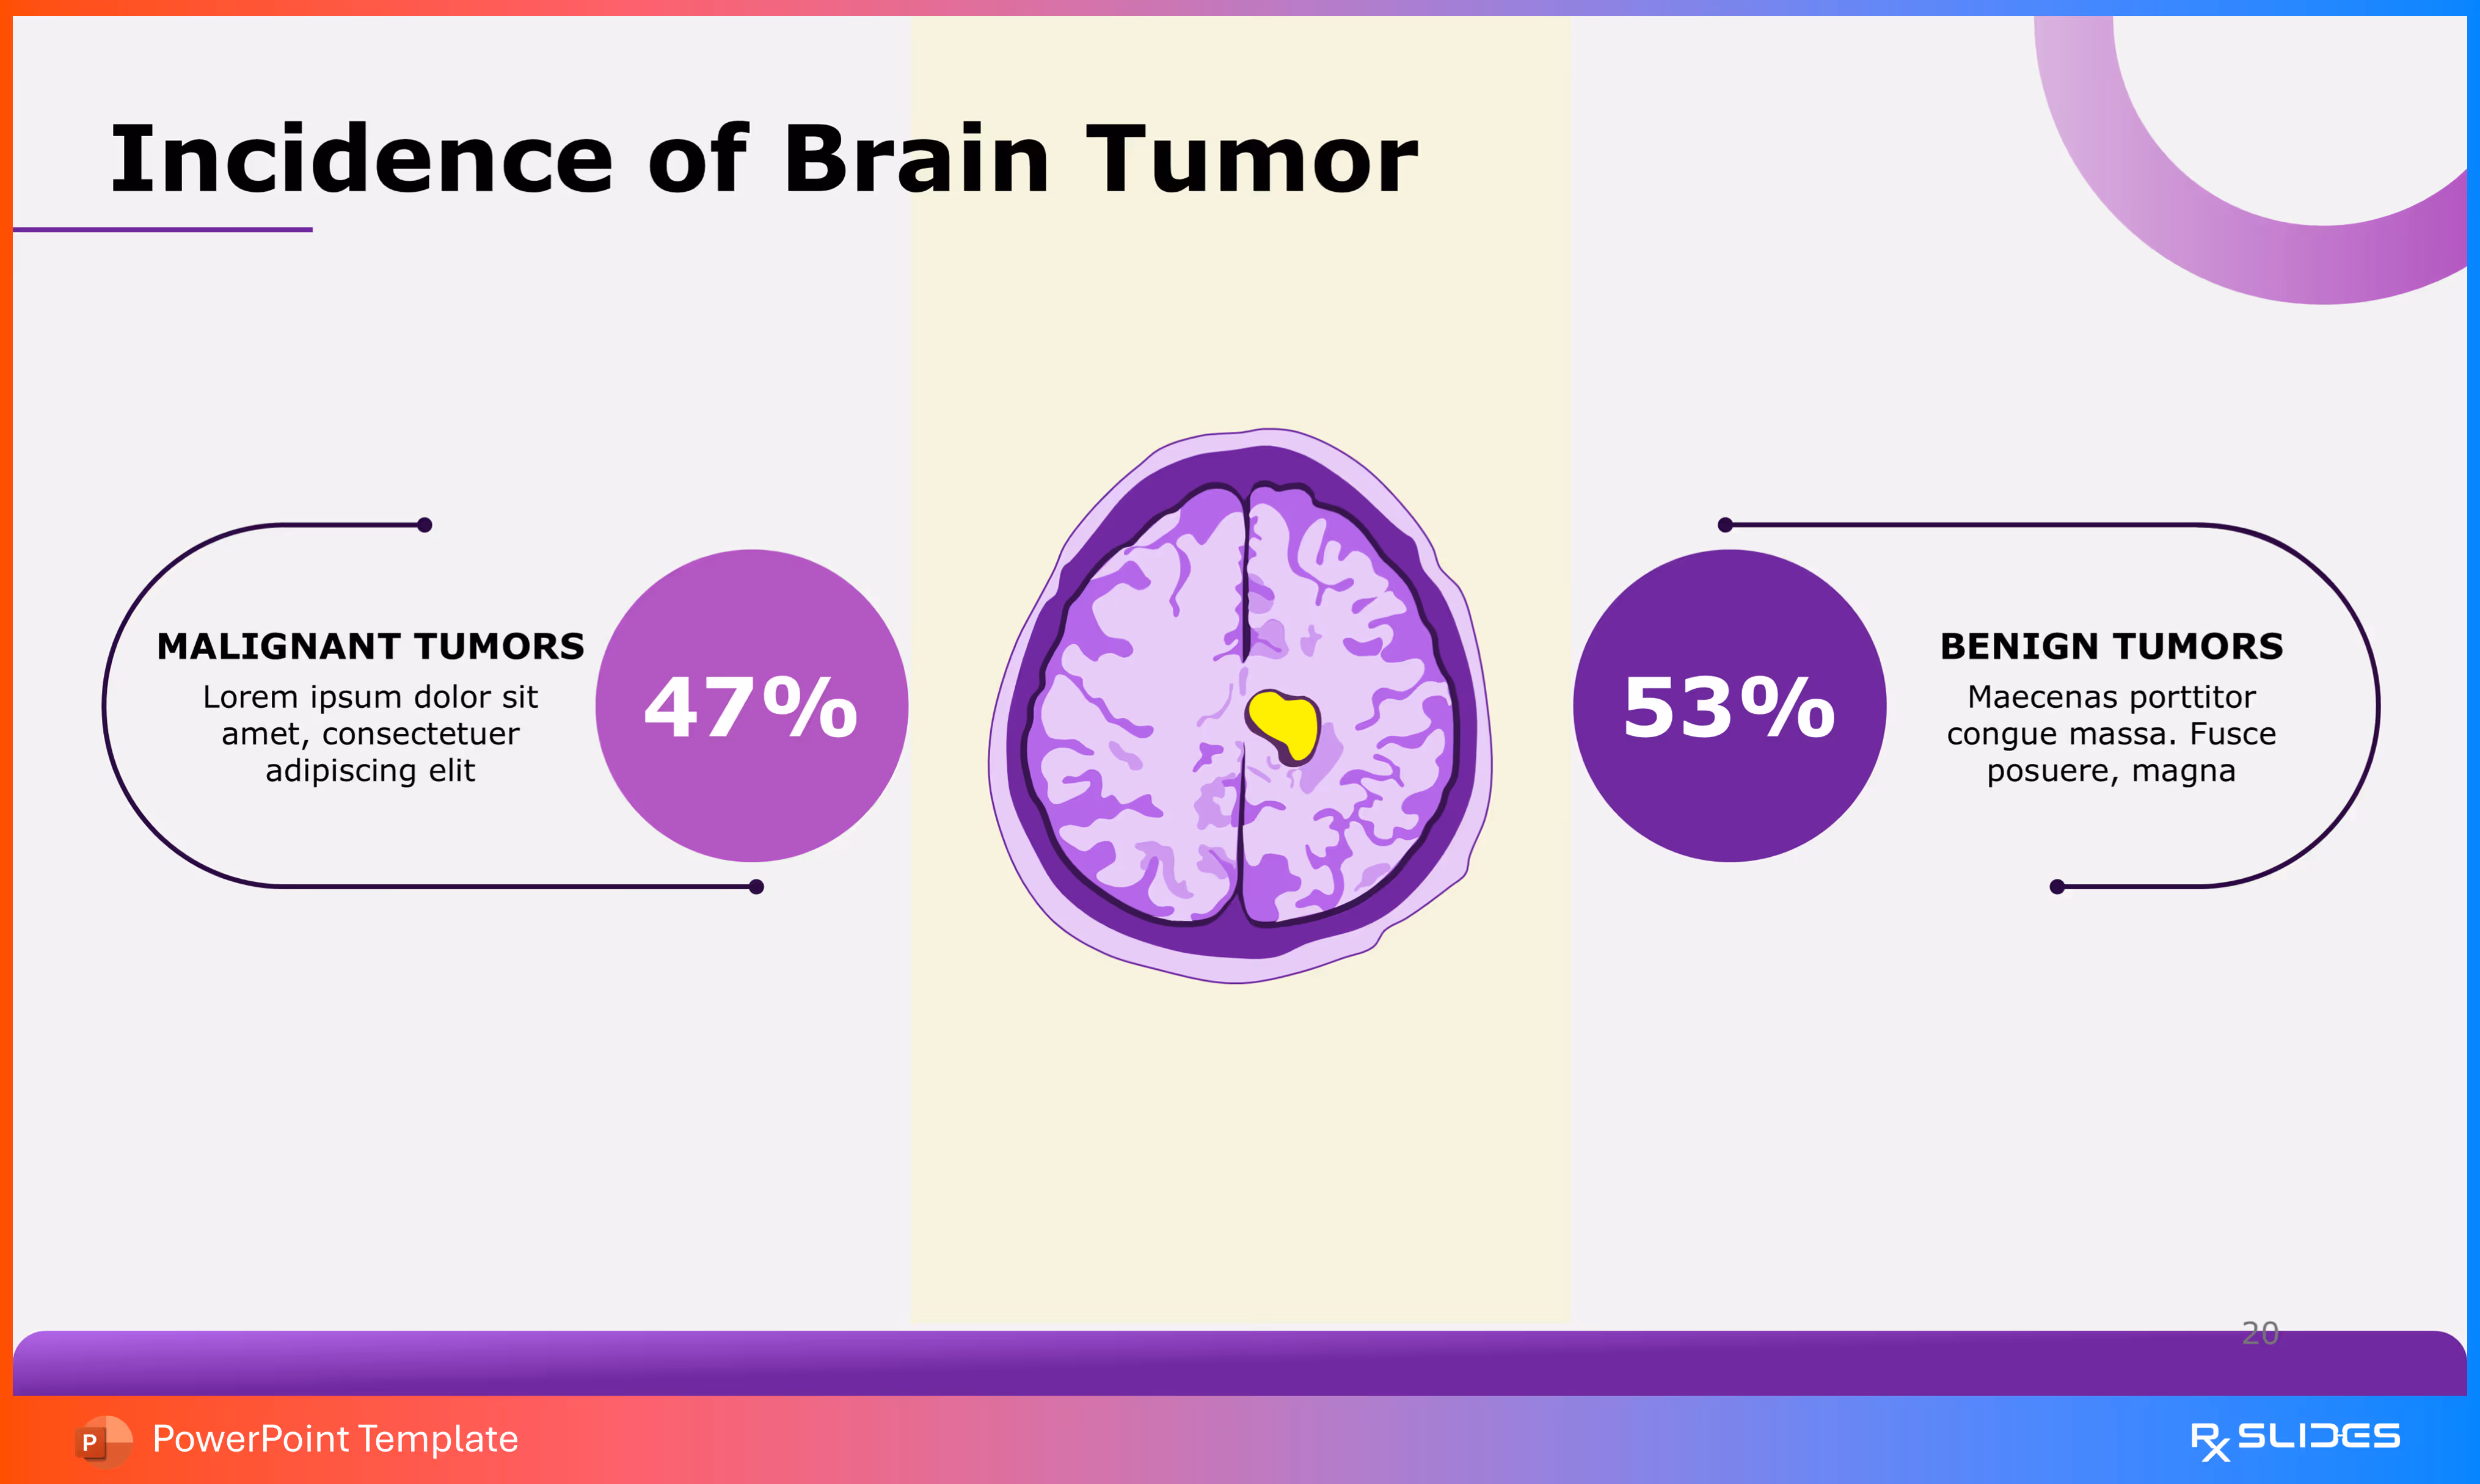
This slide provides a clear visual comparison of the incidence rates for Malignant and Benign brain tumors, serving as a concluding data point for the Epidemiology section.
- The slide is centered around the classic image of the brain cross-section with a yellow tumor.
- Malignant Tumors (Left):
- Represents 47% of the incidence.
- The percentage is displayed within a purple circle, with an accompanying text box for details about malignant tumors.
- Benign Tumors (Right):
- Represents 53% of the incidence.
- The percentage is displayed within a darker purple circle, with a text box for details about benign tumors.
- The data establishes that benign tumors (53%) are slightly more common than malignant tumors (47%).
Slide 21 - Evolving Epidemiology Brain Tumor
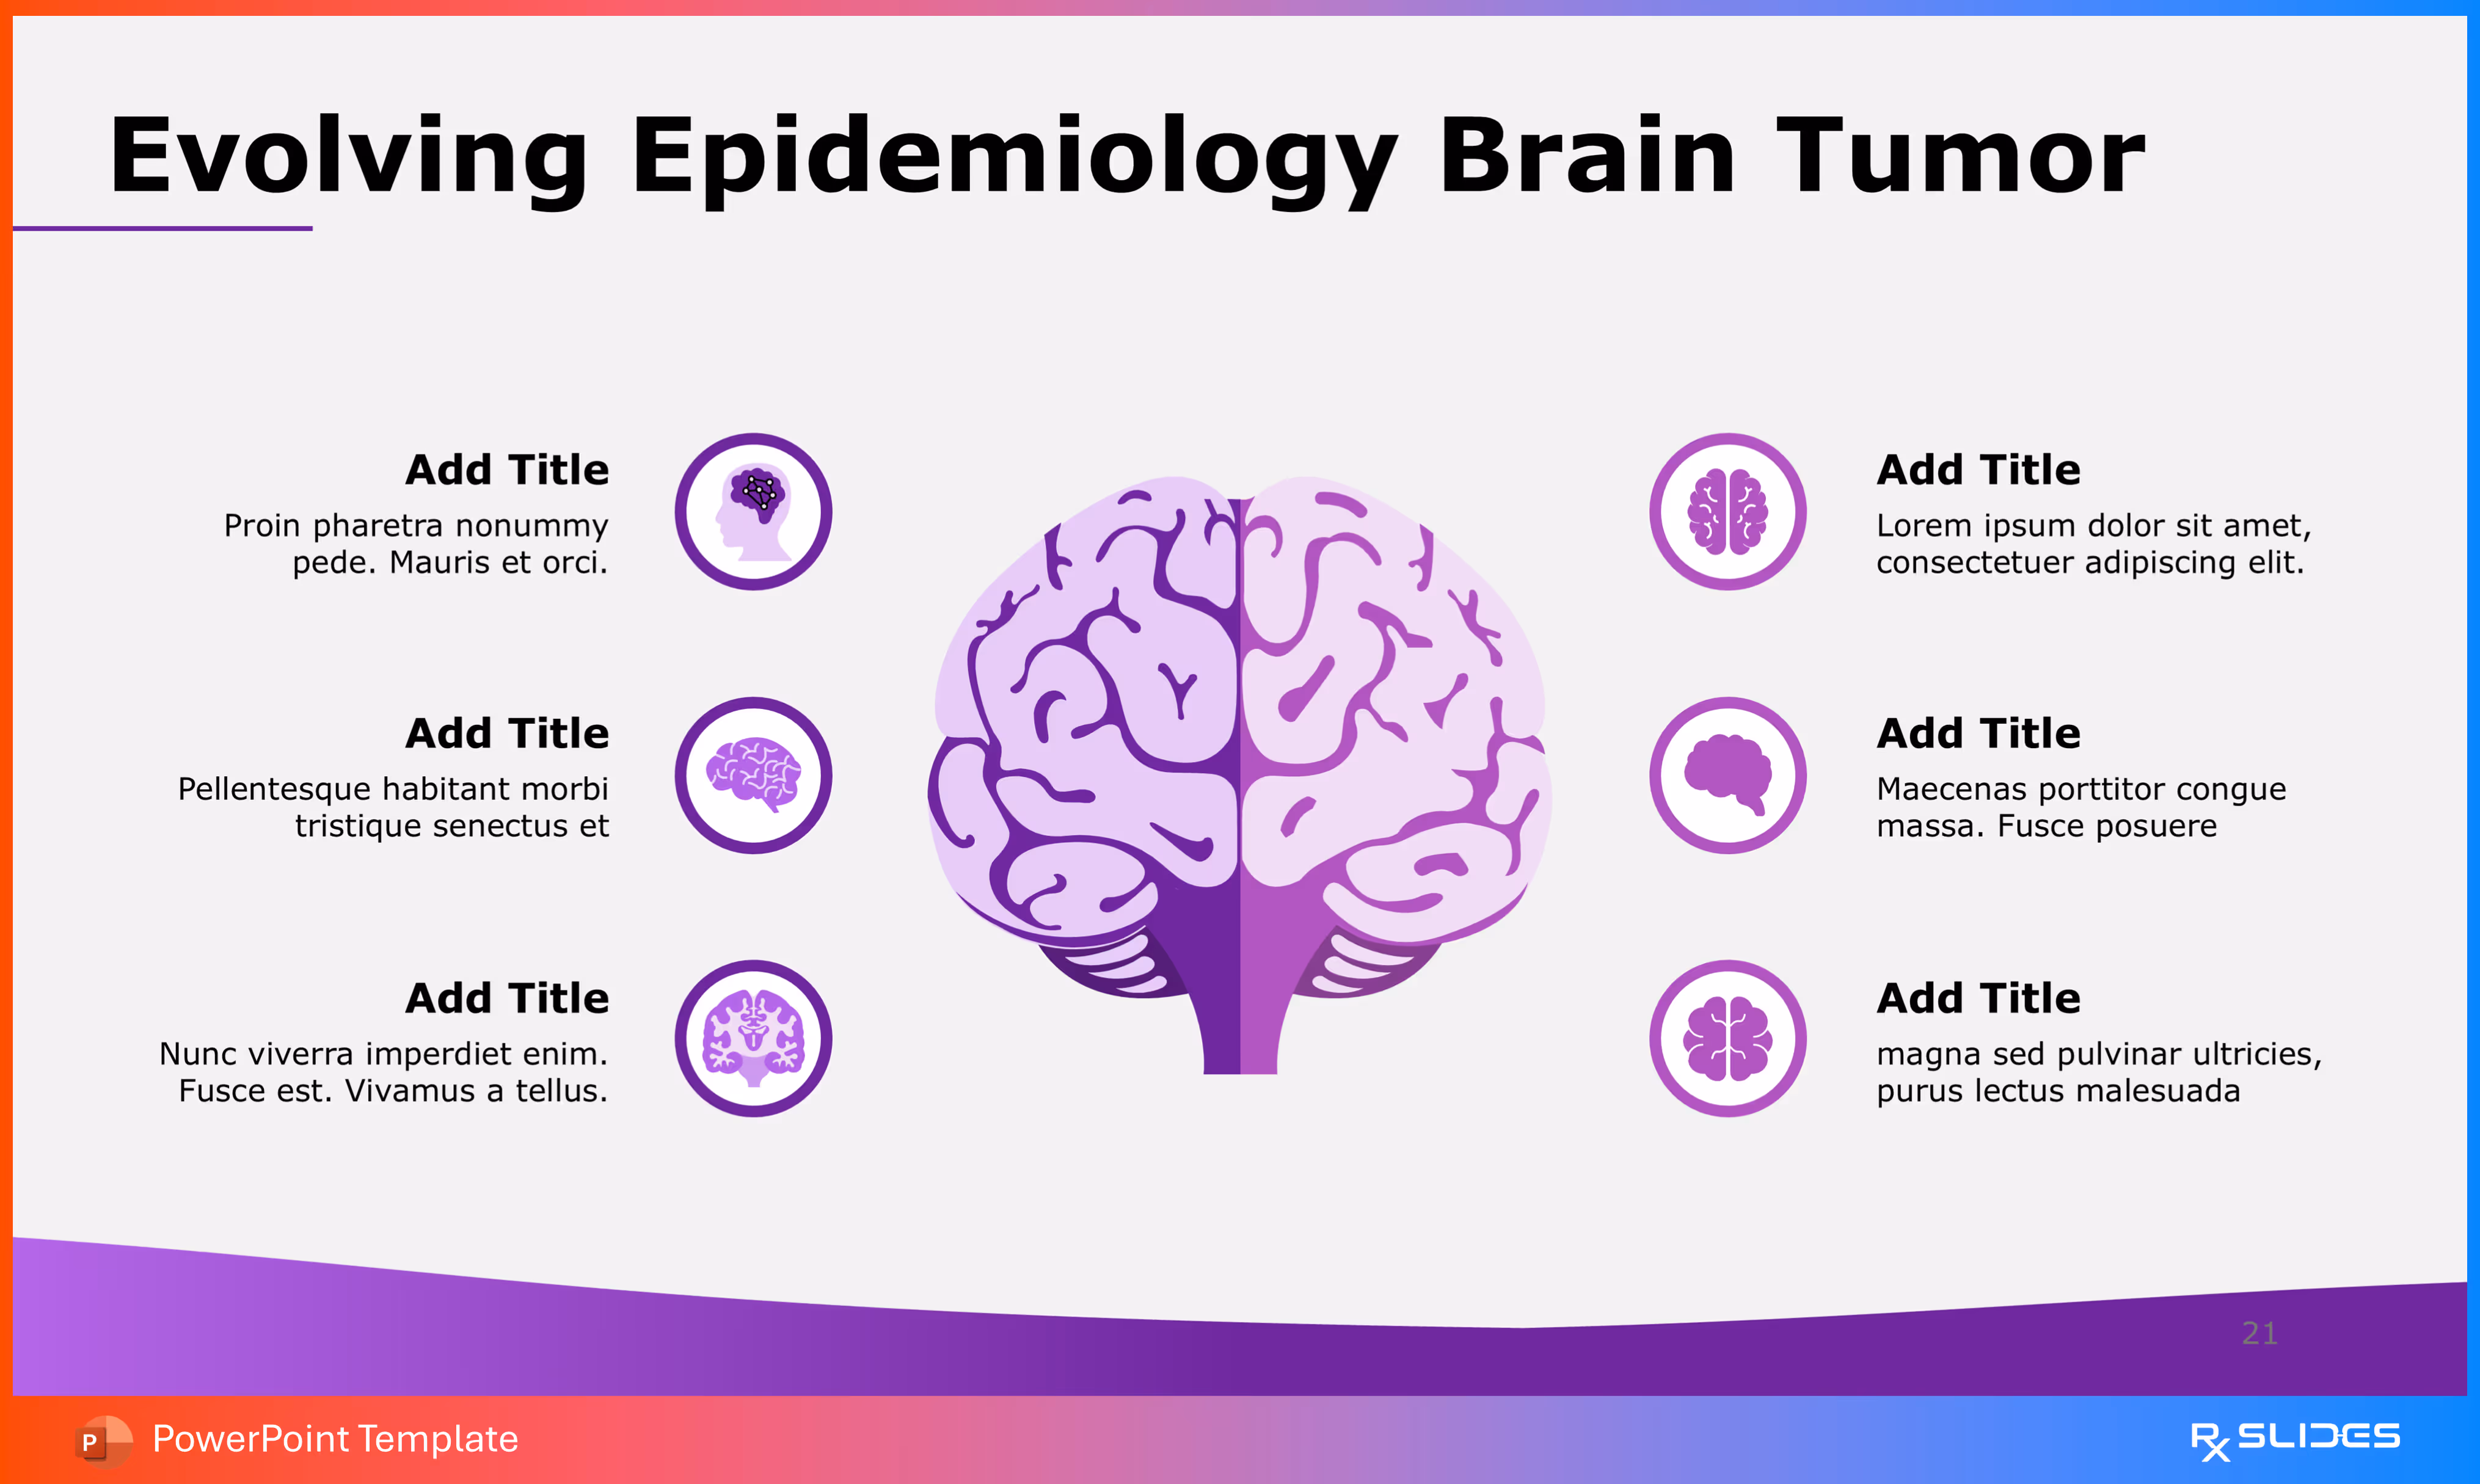
This slide provides a centralized, illustrative layout for discussing various epidemiological factors, characteristics, or tumor types related to the brain.
- The core graphic is a large, detailed, purple illustration of the human brain.
- Surrounding Data Points: Six data points are arranged around the brain, three on the left and three on the right.
- Each point consists of a small brain icon (in different styles, e.g., cross-section, full brain, temporal lobe) and a text box with an "Add Title" placeholder.
- These placeholders allow the presenter to detail specific epidemiological areas, such as tumor grades, risk factors, genetic markers, or specific tumor subtypes.
Slide 22 - Patterns of Brain Tumor Occurrence
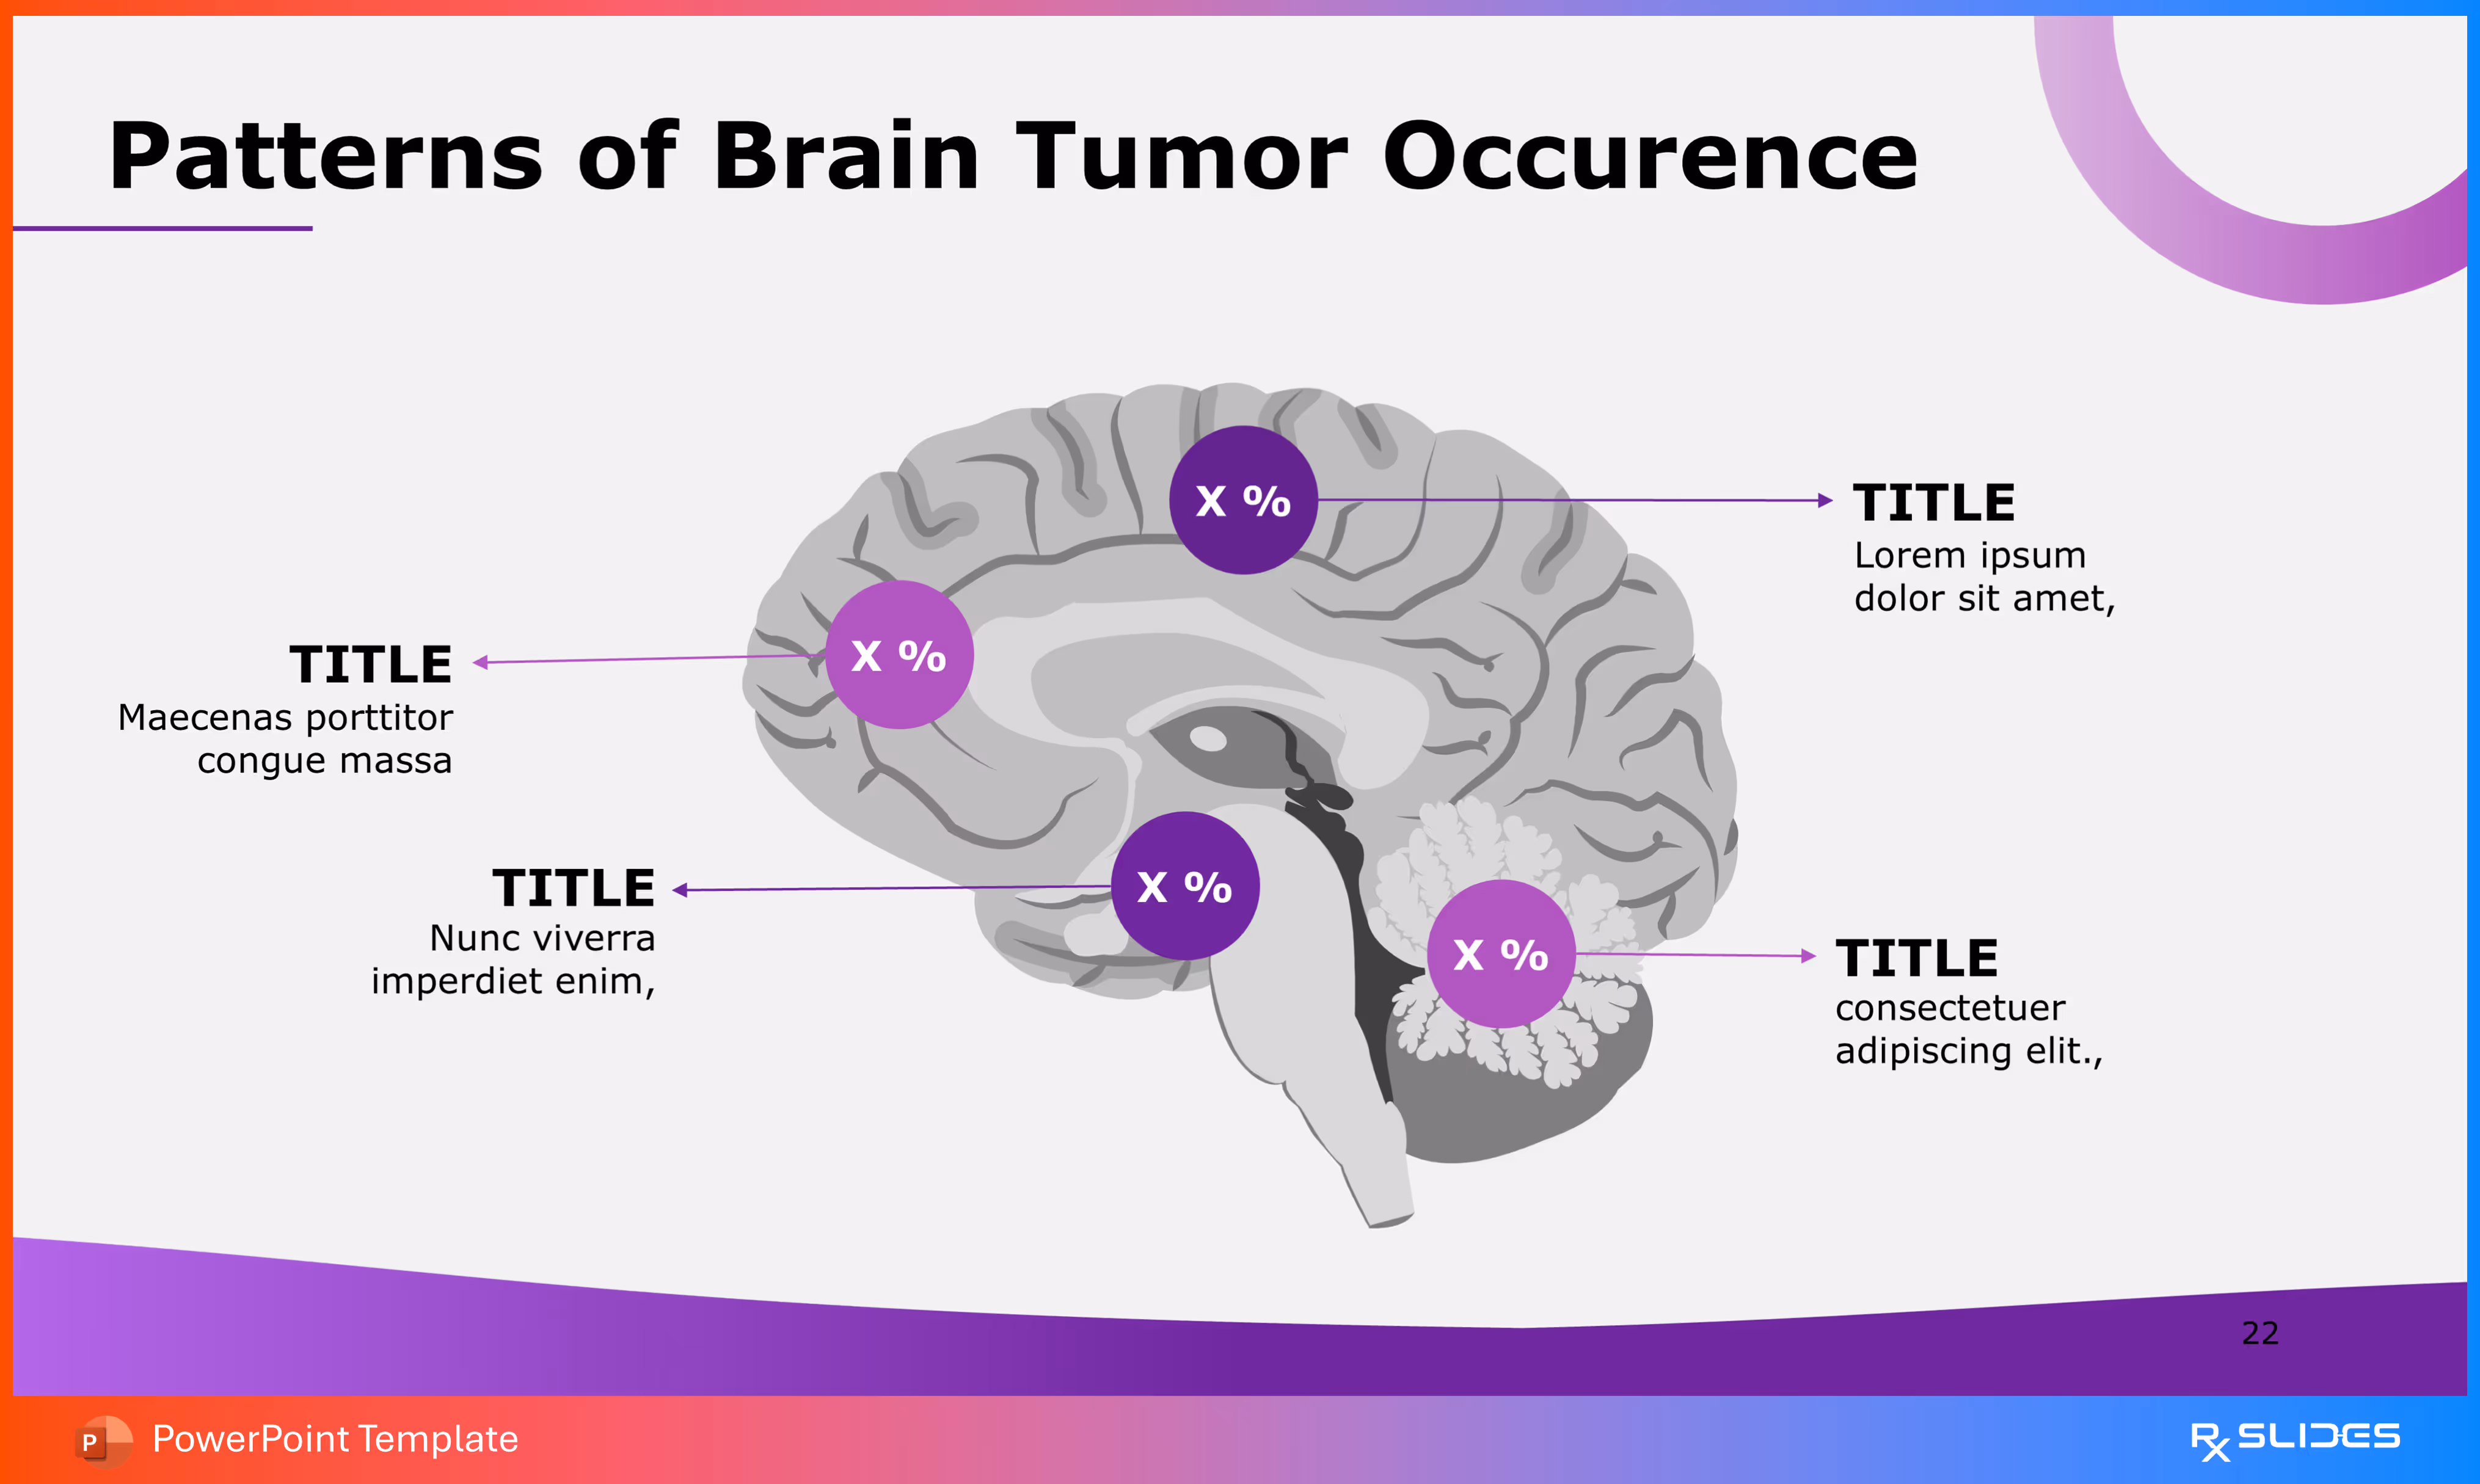
This slide moves beyond general epidemiology to focus on the anatomical distribution of tumors within the brain.
- The main graphic is a detailed, grey-scale sagittal cross-section of the human brain and brainstem, showing different areas where tumors can occur.
- Anatomical Data Points: Four specific areas are highlighted with purple circles, each containing a placeholder "X %".
- Each percentage is linked via an arrow to a text box with a "TITLE" placeholder and accompanying descriptive text.
- These points are distributed across the cerebrum, cerebellum/brainstem area, and potentially other deep structures, allowing the presenter to specify the incidence rate for tumors in these different anatomical locations.
Slide 23 - Epidemiology of Brain Tumor (Process/Flow)
.avif)
This slide provides a structure to present six distinct but related points concerning the Epidemiology of Brain Tumor in a circular, six-step process flow.
- The center features a small, gray outline of the human brain, serving as the focal point for all six surrounding data elements.
- Structure: Six numbered circles (01 through 06) are arranged in a ring around the central brain graphic.
- Each numbered circle is connected to a descriptive text box with an "Add Title" and placeholder text.
- This layout is ideal for discussing six key risk factors, trends, or steps in diagnosis/research related to brain tumor epidemiology.
Slide 24 - Section Divider: Comparison
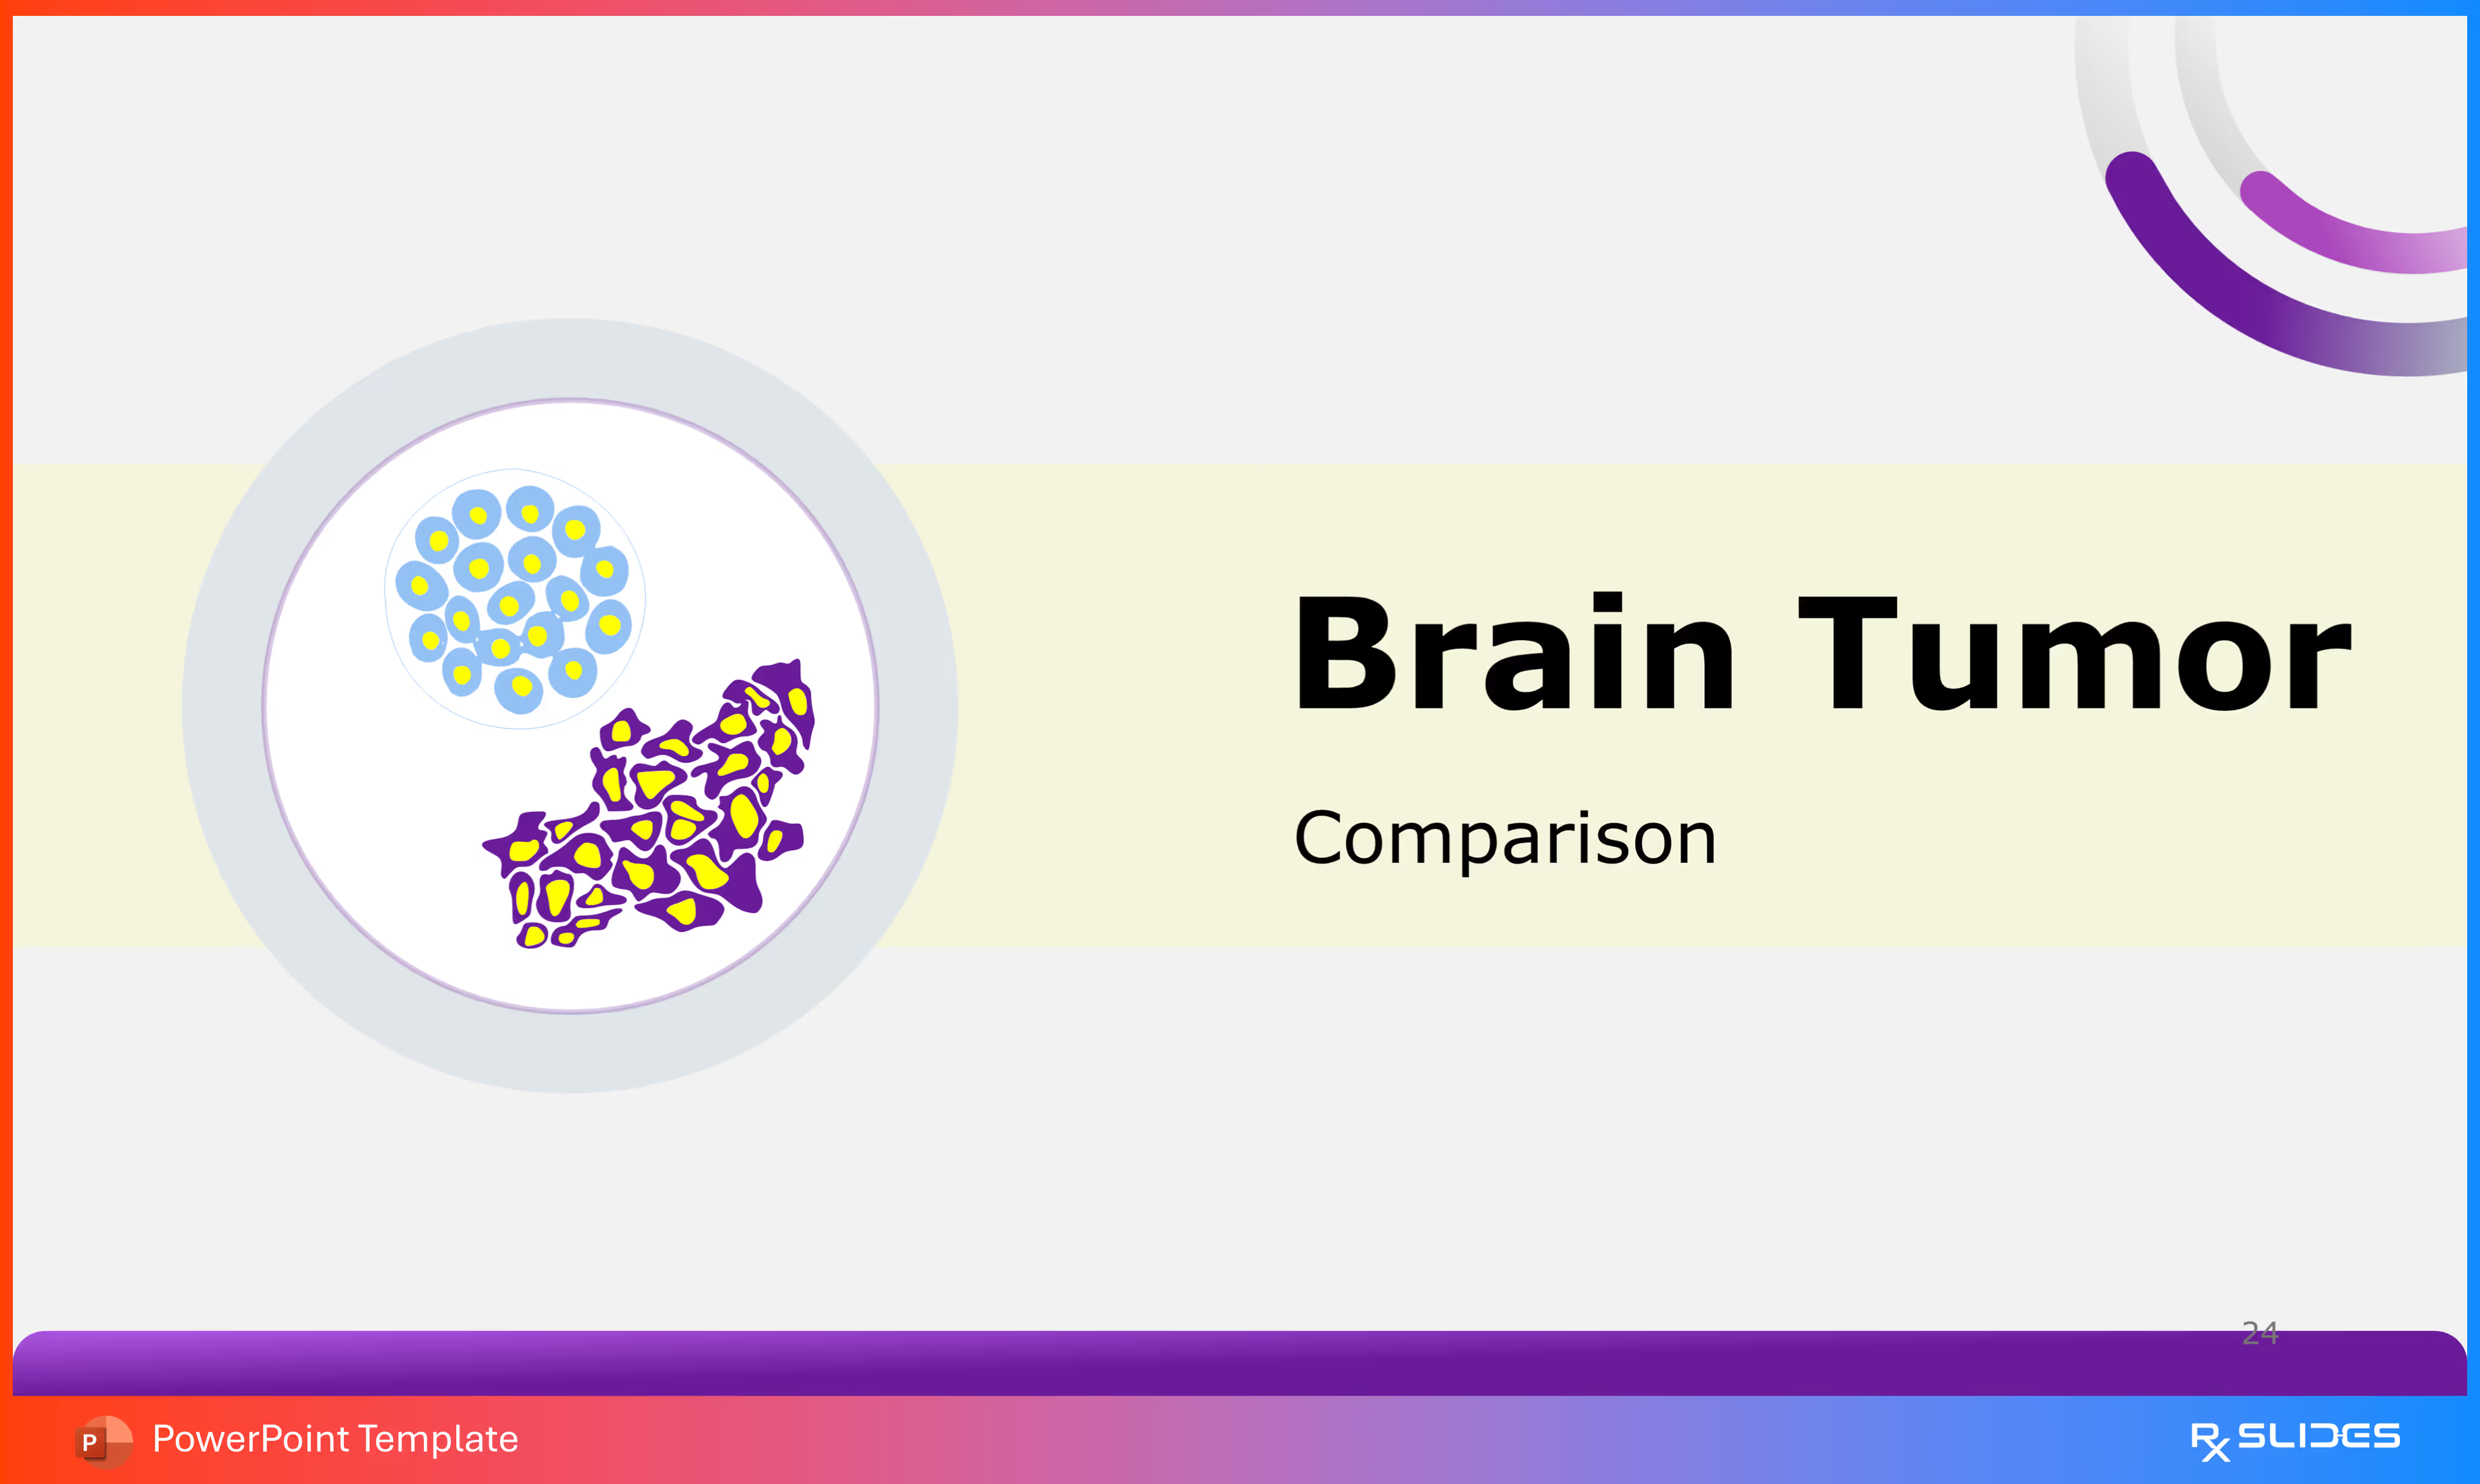
This slide serves as a clear section divider, shifting the presentation's focus from general statistics and distribution (Epidemiology) to the various types and classifications of brain tumors.
- This term indicates the slides that follow will likely compare benign vs. malignant, or different grades/types of tumors.
- The left side features a large circular icon showcasing two distinct clusters of cells:
- One cluster is a tight, circular group of small blue and yellow cells, suggesting a more organized or benign cell mass.
- The second cluster is a spreading, irregular mass of purple and yellow cells, suggesting a more malignant or aggressive growth pattern.
- This contrast visually sets up the topic of tumor classification.
Slide 25 - Brain Tumor: Benign vs. Malignant
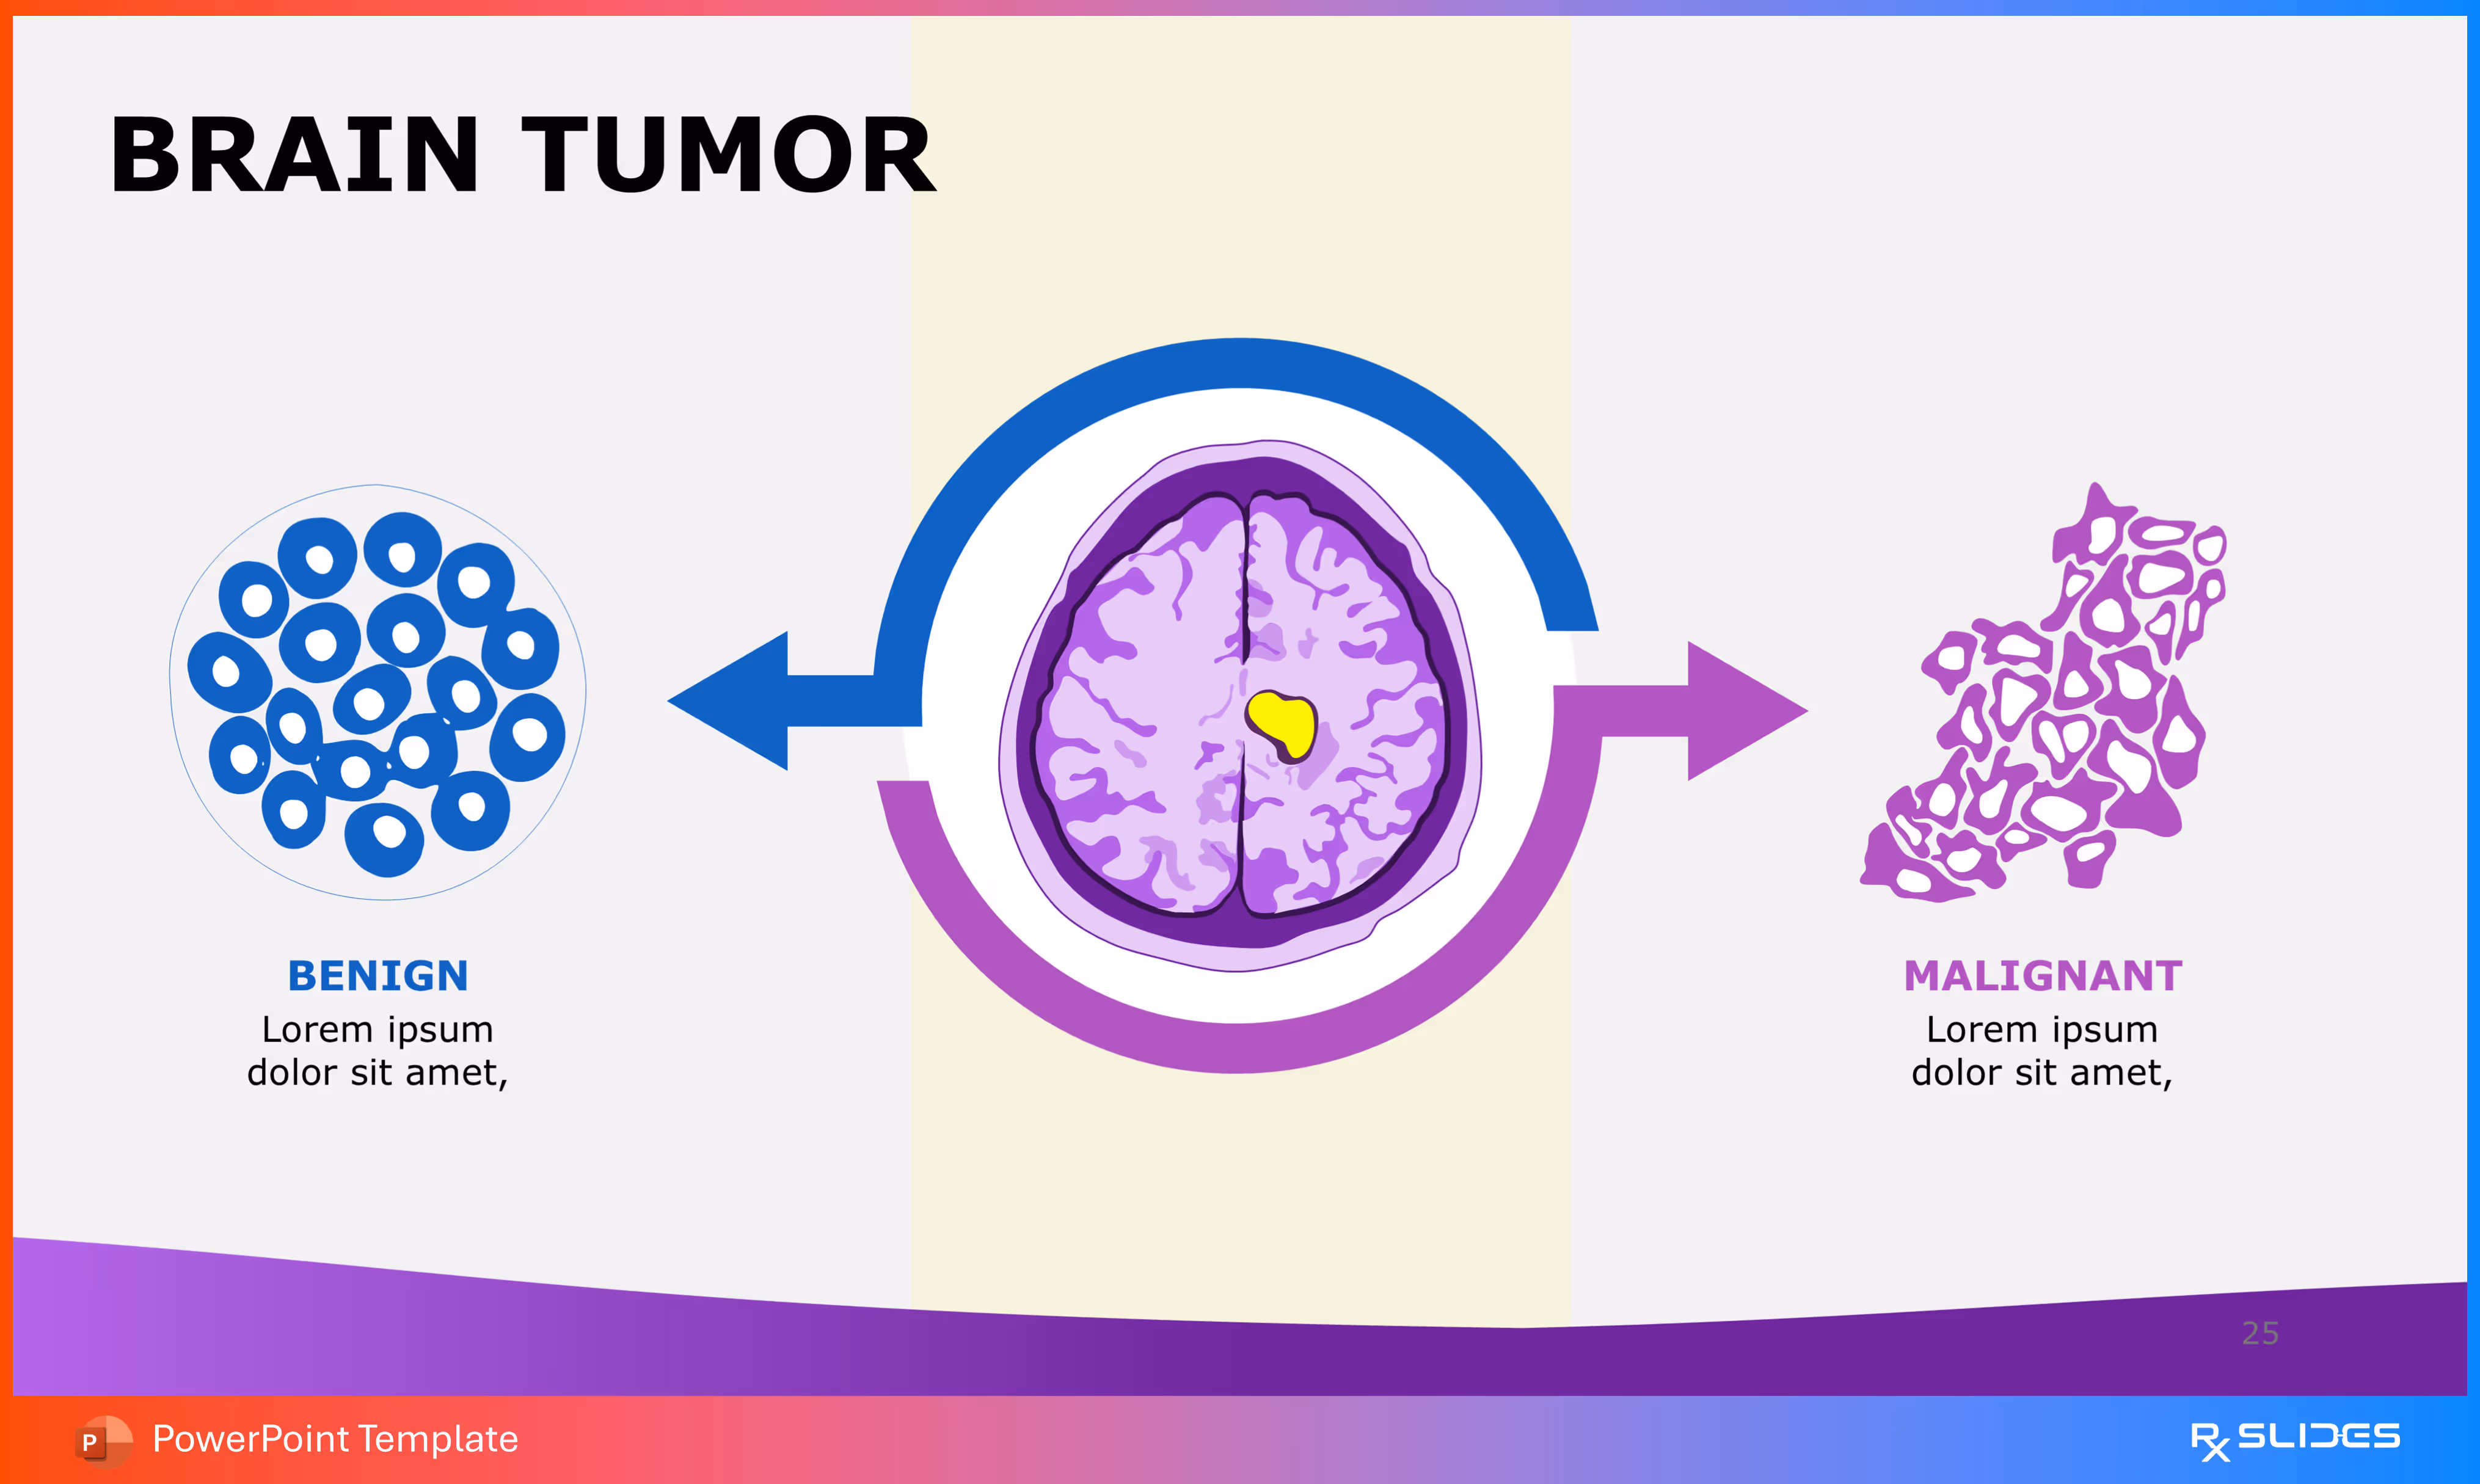
This slide is a centerpiece for classification, visually and descriptively comparing benign and malignant brain tumors.
- The slide centers on the brain cross-section with a yellow tumor. A circular, two-toned arrow graphic flows from the center to the two comparative sections, symbolizing the two directions of tumor classification.
- Benign Tumors (Left):
- Labeled "BENIGN".
- Features an icon of tightly clustered blue circles, representing an organized, non-spreading cellular structure typical of benign growths.
- Includes placeholder text below for detailed description.
- Malignant Tumors (Right):
- Labeled "MALIGNANT".
- Features an icon of an irregular, purple, spreading cellular mass, representing the aggressive and invasive nature of malignant tumors.
- Includes placeholder text below for detailed description.
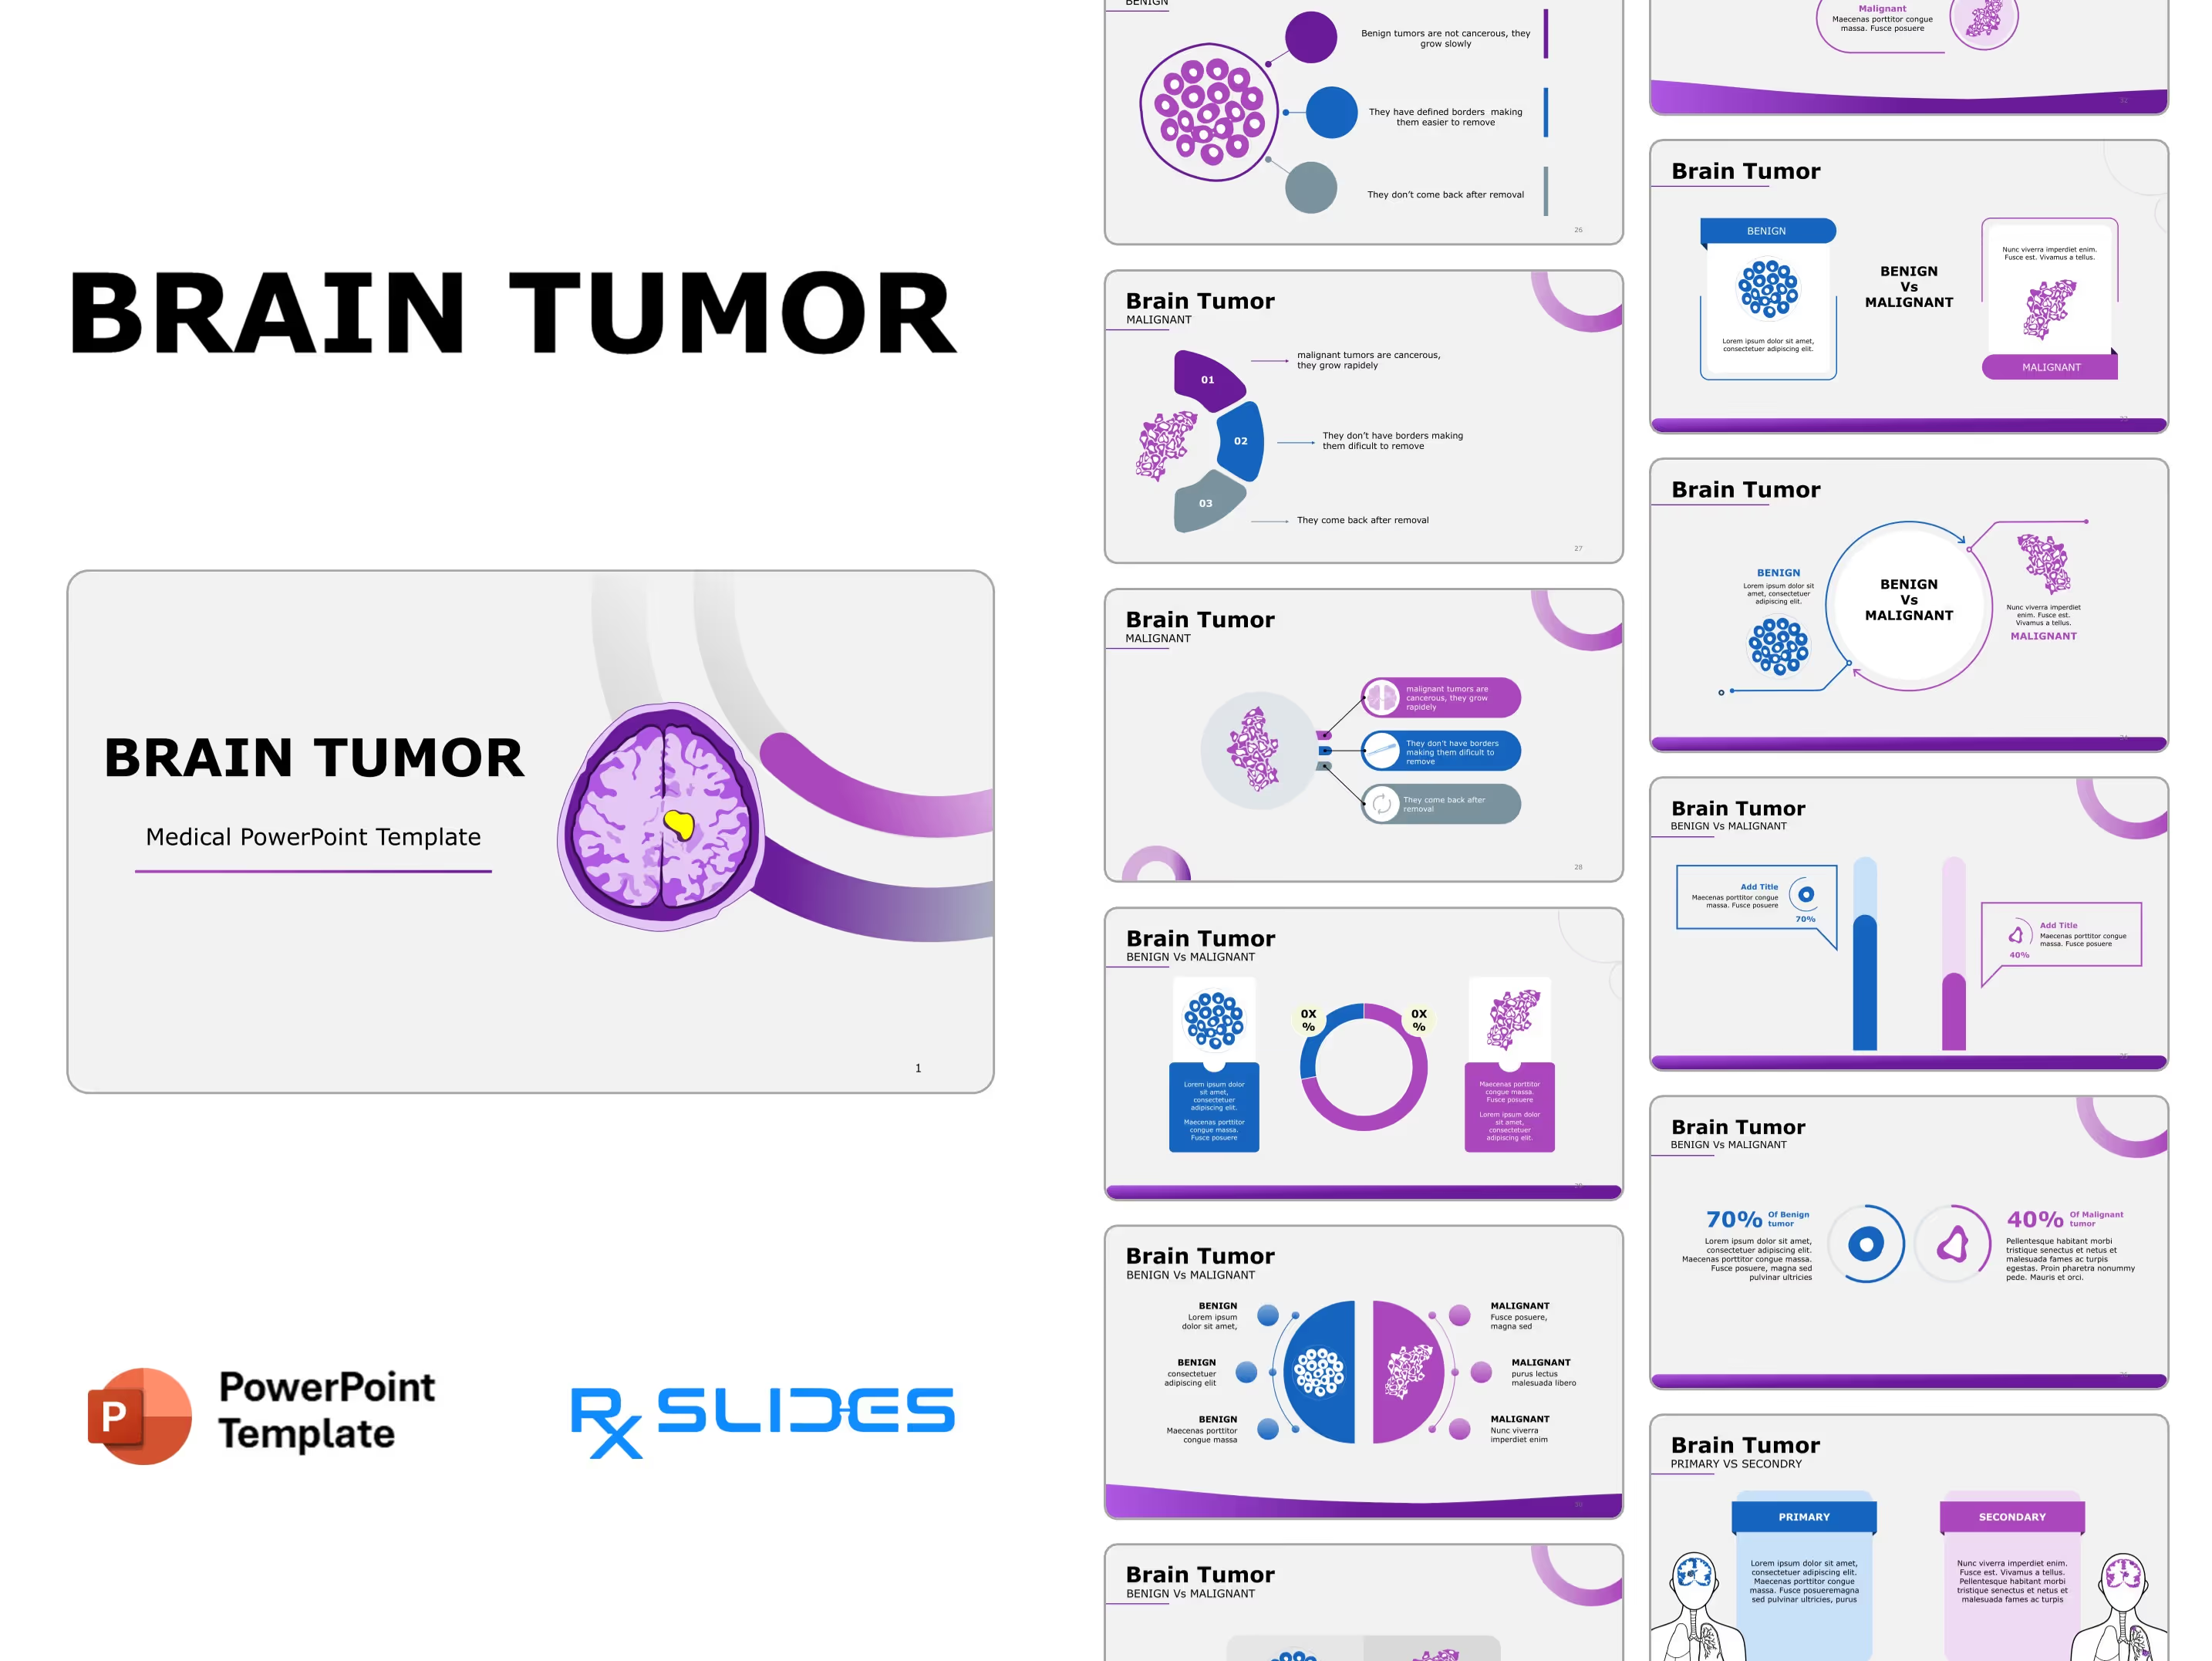
Slide 26 - Brain Tumor: Benign Characteristics
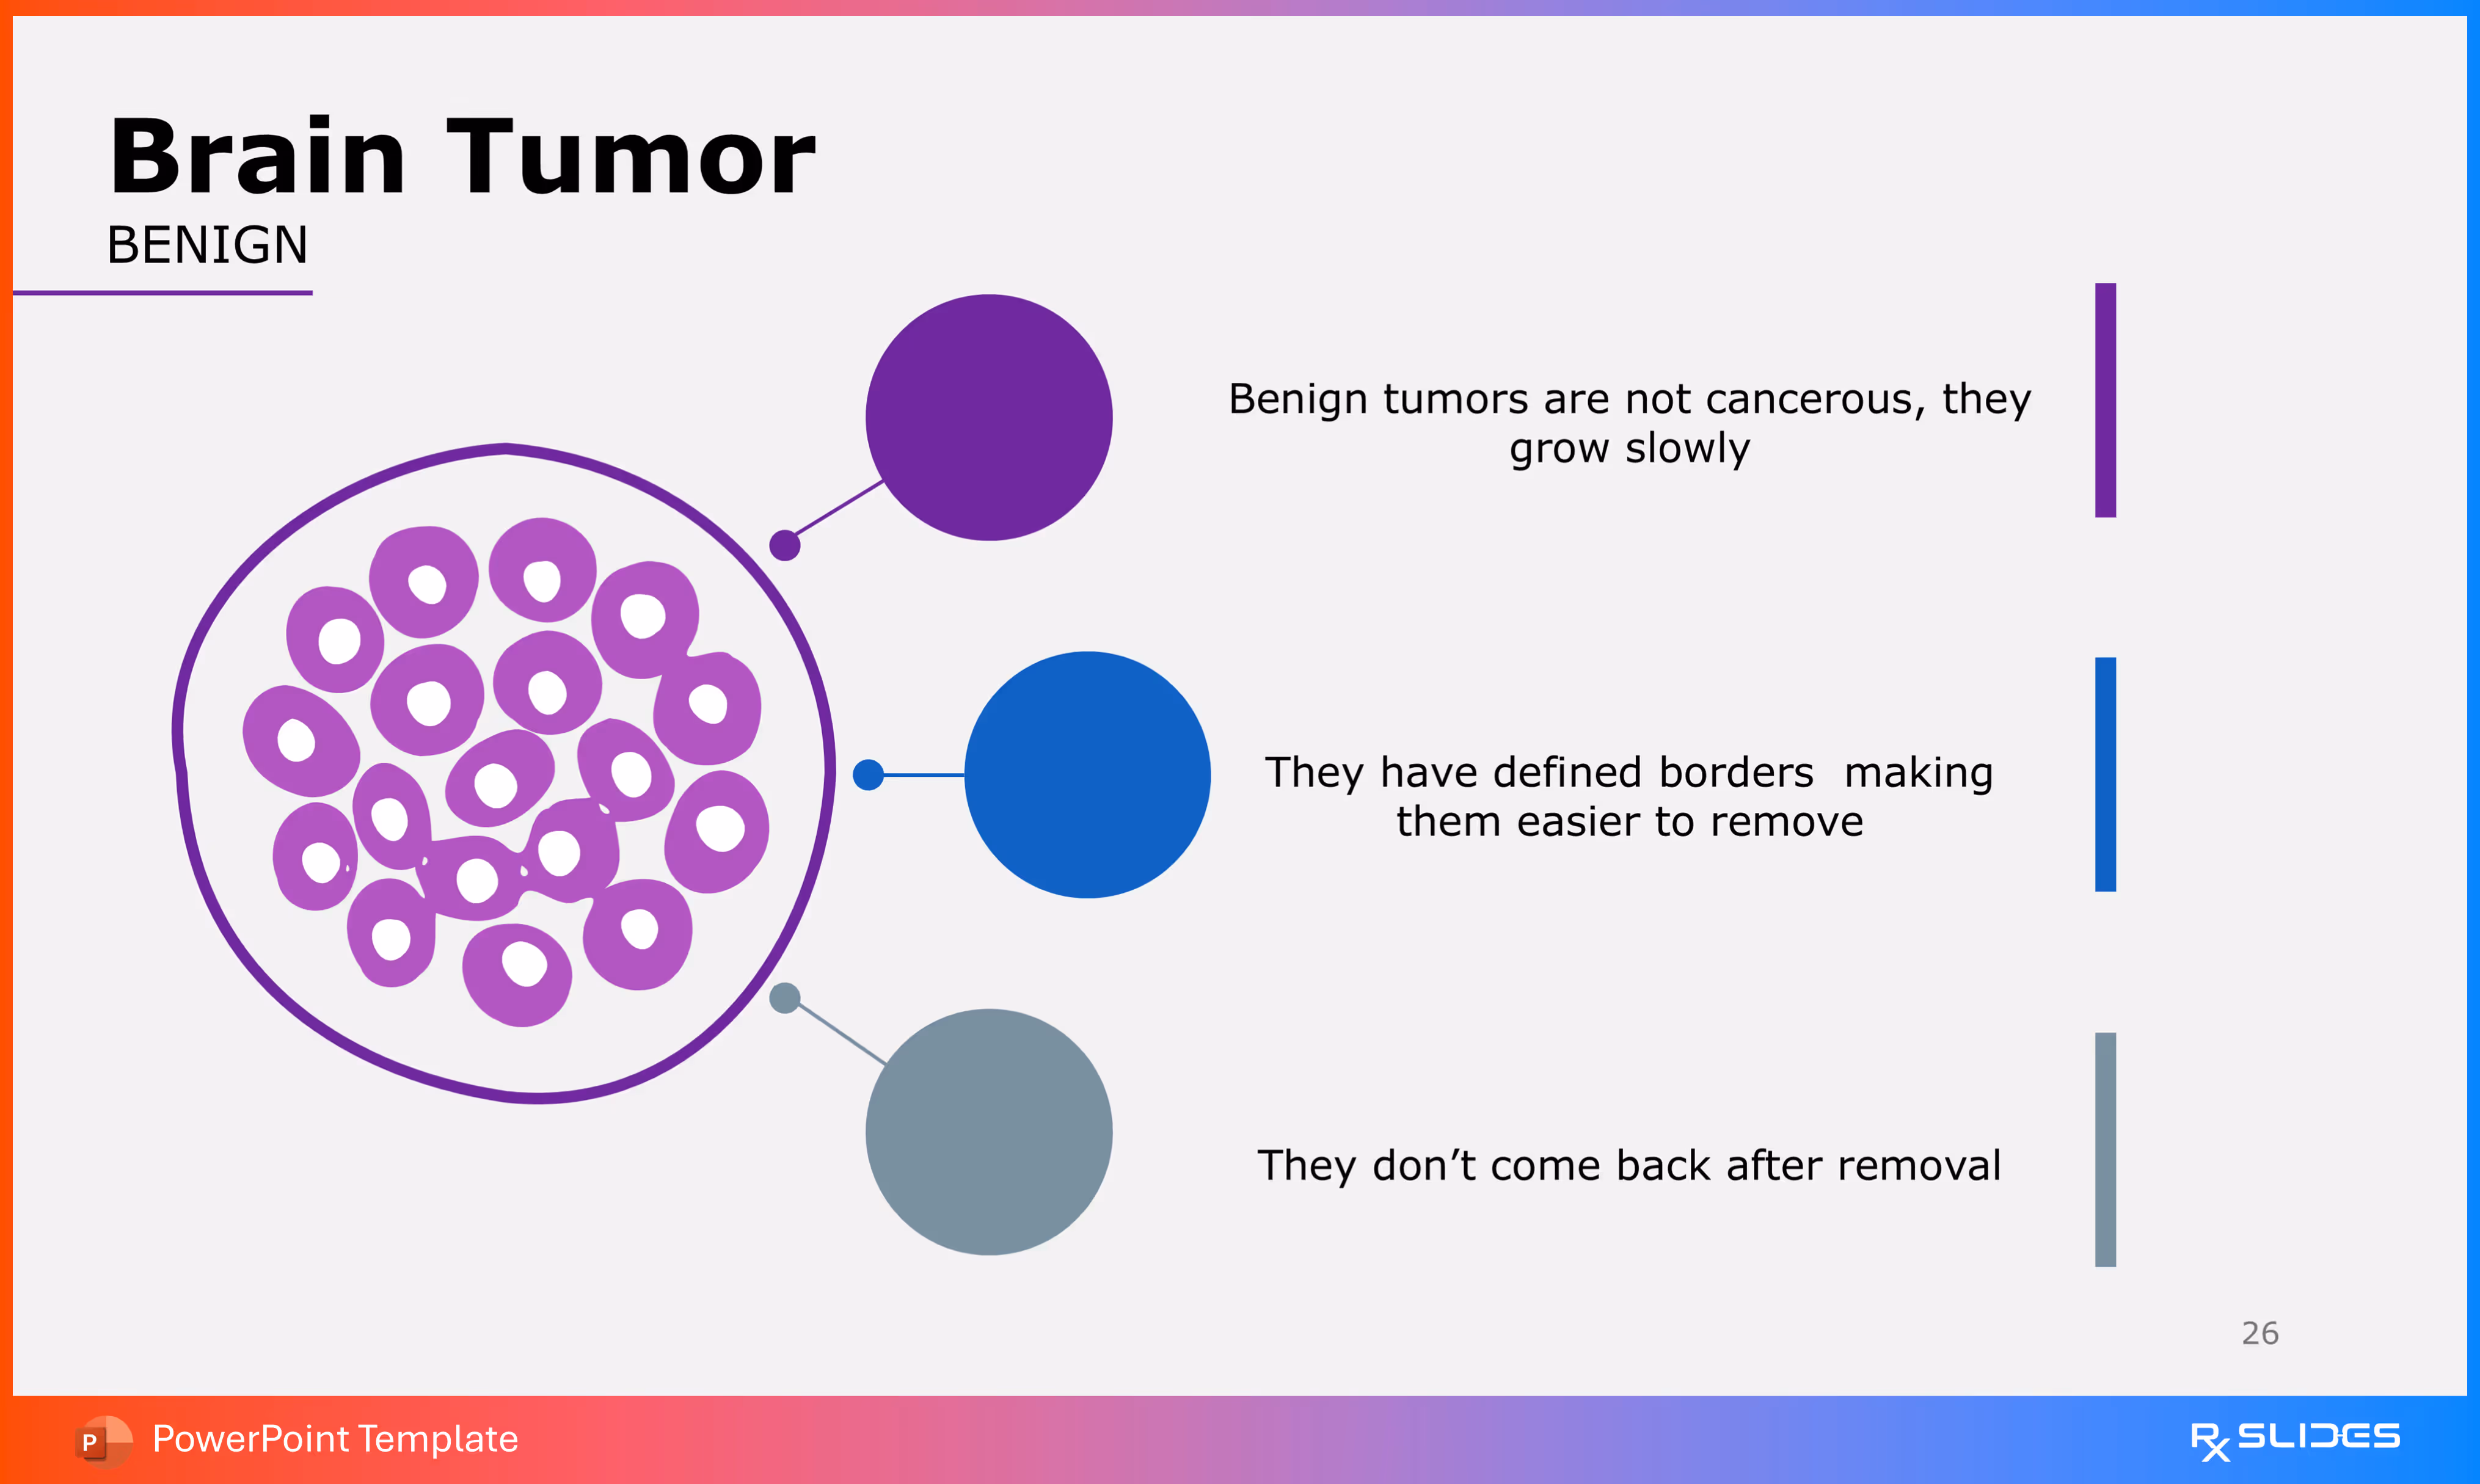
This slide focuses solely on the defining features of benign brain tumors, using an icon array for visual emphasis.
- A large circular icon displays a tight cluster of purple rings, visually representing the organized, well-defined cellular structure of a benign tumor.
- Three Key Characteristics (Right): Three color-coded points detail the benign characteristics:
- Purple: "Benign tumors are not cancerous, they grow slowly".
- Blue: "They have defined borders making them easier to remove".
- Grey: "They don't come back after removal".
Slide 27 - Brain Tumor: Malignant Characteristics
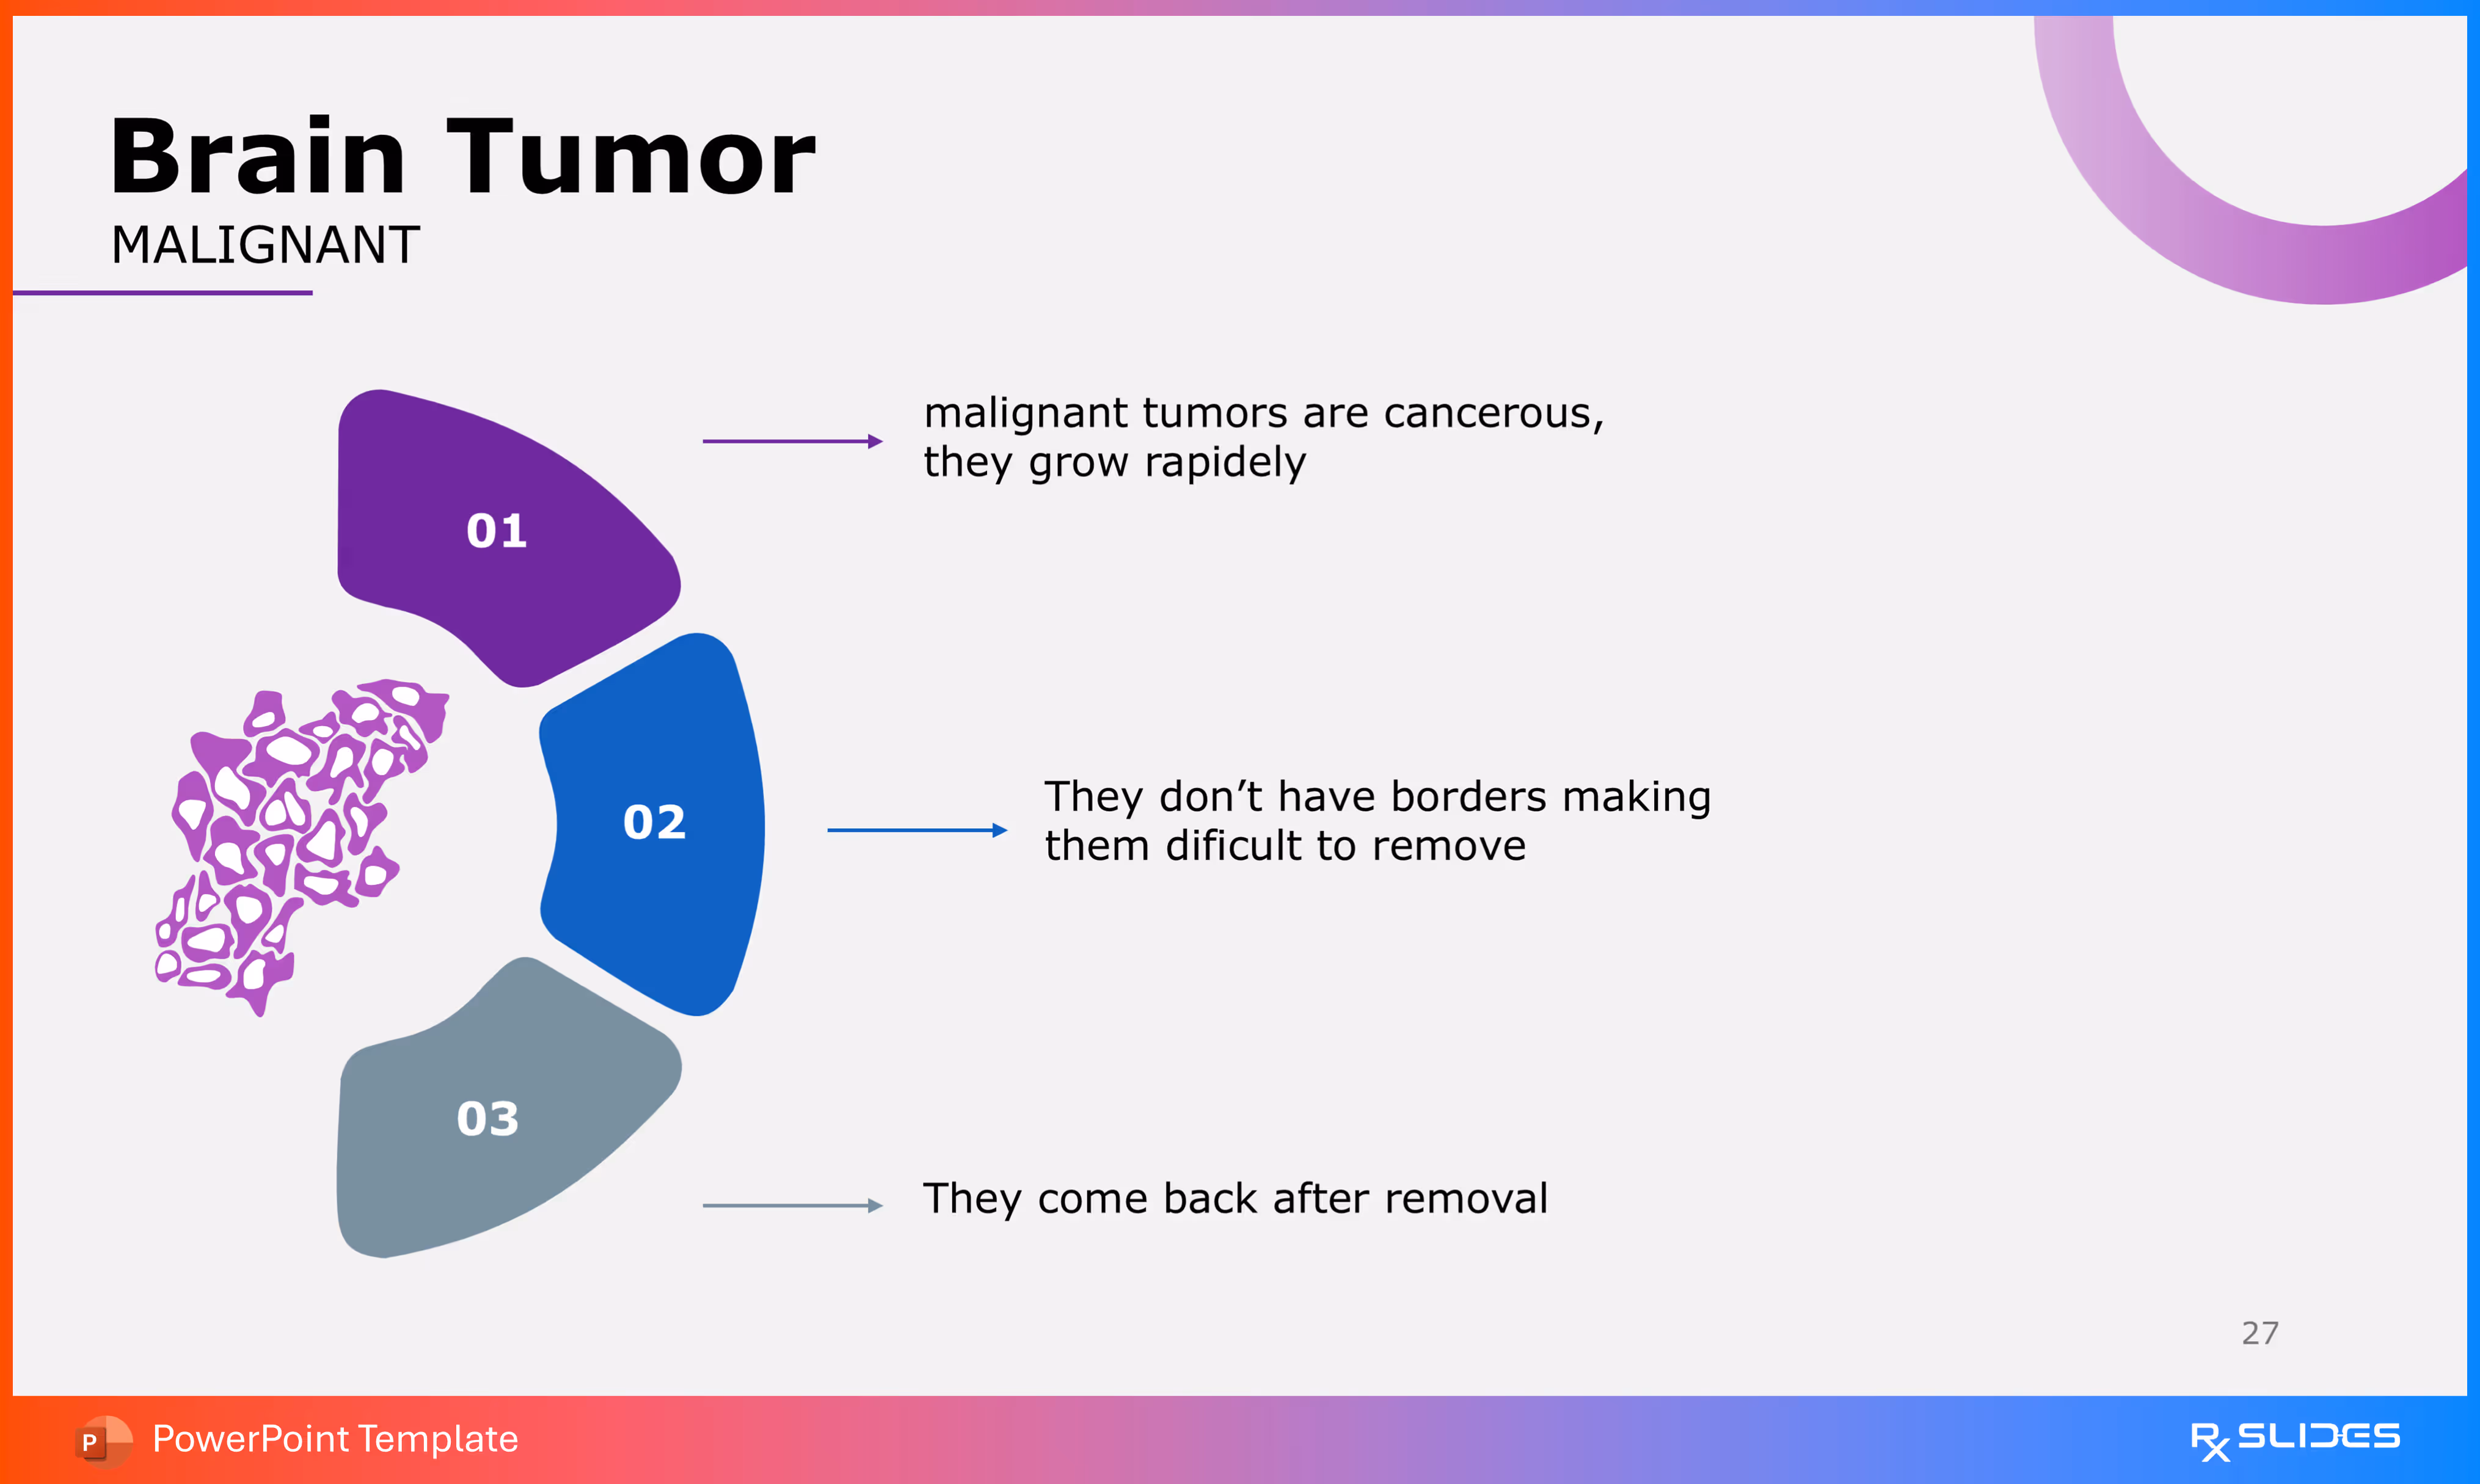
This slide directly follows the benign slide and focuses on the defining features of malignant brain tumors, using a complementary, non-circular segmented graphic.
- Visual Element (Left): An icon of a spreading, irregular cellular mass (in purple) is shown, representing the chaotic and invasive nature of a malignant tumor.
- Three Key Characteristics (Right): Three numbered, segmented shapes (01, 02, 03) detail the malignant characteristics:
- 01 (Purple): "malignant tumors are cancerous, they grow rapidly".
- 02 (Blue): "They don't have borders making them difficult to remove".
- 03 (Grey): "They come back after removal".
Slide 28 - Brain Tumor: Malignant Characteristics (Alternative Layout)
.avif)
This slide presents the same key characteristics of malignant tumors as Slide 27 but uses a different visual style, connecting the points with lines to a central cellular graphic.
Slide 29 - Brain Tumor: Benign vs Malignant (Infographic)
.avif)
This slide provides a high-level, visual comparison of benign versus malignant brain tumors, combining cellular icons, data placeholders, and descriptive text.
- A large pie chart/donut chart is split into two sections (blue and purple) with percentage placeholders "0X %" in the middle, representing the relative incidence rates of benign and malignant tumors.
- Benign Side (Left):
- Features an icon of tightly clustered blue circles, symbolizing an organized, non-spreading cellular structure.
- A blue text box below contains placeholder descriptive text.
- Malignant Side (Right):
- Features an icon of an irregular, purple, spreading cellular mass, symbolizing aggressive growth.
- A purple text box below contains placeholder descriptive text.
Slide 30 - Brain Tumor: Benign vs Malignant (Detailed Comparison)
.avif)
This slide offers a detailed, three-point comparison between benign and malignant brain tumors using a central visual split and surrounding bullet points.
- The graphic is split vertically into two color-coded halves (blue for Benign, purple for Malignant).
- The Benign side shows the icon of tightly clustered, organized cells.
- The Malignant side shows the icon of the irregular, spreading cellular mass.
- Comparison Points (Left - Benign): Three text points on the left are designated for describing Benign tumor characteristics.
- Comparison Points (Right - Malignant): Three text points on the right are designated for describing Malignant tumor characteristics.
Slide 31 - Brain Tumor: Benign vs Malignant (Simplified Infographic)
.avif)
This slide offers a minimalist, side-by-side comparison focusing on the key icons and primary characteristics of the two tumor types.
- Benign Tumors (Left - Blue/White):
- Features the icon of tightly clustered, organized cells.
- A blue circle and text box with the label "Benign" and placeholder text are used for description.
- Malignant Tumors (Right - Purple/White):
- Features the icon of the irregular, spreading cellular mass.
- A purple circle and text box with the label "Malignant" and placeholder text are used for description.
Slide 32 - Brain Tumor: Benign vs Malignant (Numbered Infographic)
.avif)
This slide presents a clear, numbered visual comparison of benign versus malignant brain tumors, focusing on their representative cellular icons and a brief description..
- Point 01: Benign Tumors (Top - Blue):
- Numbered "01".
- Features the icon of tightly clustered, organized blue cells.
- A text box contains the label "Benign" and placeholder text for a detailed description.
- Point 02: Malignant Tumors (Bottom - Purple):
- Numbered "02".
- Features the icon of the irregular, spreading purple cellular mass.
- A text box contains the label "Malignant" and placeholder text for a detailed description.
Slide 33 - Brain Tumor: Benign vs Malignant (Card Infographic)
.avif)
This slide provides a two-column, card-style comparison of benign versus malignant brain tumors, ideal for a clean, professional summary.
- Benign Card (Left - Blue):
- The card is topped with a blue tab labeled "BENIGN".
- It features the icon of tightly clustered, organized blue cells.
- Placeholder text is included below the icon for a detailed description of benign characteristics.
- Malignant Card (Right - Purple):
- The card features a bottom-right purple tab labeled "MALIGNANT".
- It features the icon of the irregular, spreading purple cellular mass.
- Placeholder text is included above the icon for a detailed description of malignant characteristics.
Slide 34 - Brain Tumor: Benign vs Malignant (Circular Flow Comparison)
.avif)
This slide uses a flow diagram to visually connect the cellular characteristics of benign and malignant tumors back to a central comparison point.
- A large, central circle contains the heading "BENIGN Vs MALIGNANT".
- A blue arrow leads into the circle from the benign side.
- A purple arrow leads out of the circle toward the malignant side, suggesting a flow of information or a dynamic relationship between the two states.
- Benign Side (Left - Blue):
- Features the icon of tightly clustered, organized cells.
- Includes the label "BENIGN" and placeholder text.
- Malignant Side (Right - Purple):
- Features the icon of the irregular, spreading cellular mass.
- Includes the label "MALIGNANT" and placeholder text.
Slide 35 - Brain Tumor: Benign vs Malignant (Bar Chart Comparison)
.avif)
This slide uses a segmented bar chart design to visually compare two quantifiable characteristics (e.g., incidence, survival rates, or recurrence percentages) of benign and malignant tumors..
- Benign Data (Left - Blue):
- A blue segmented bar represents the benign data point.
- A callout box points to the bar, showing an icon and a placeholder of "70%" for the data value.
- It includes an "Add Title" placeholder for the characteristic being measured.
- Malignant Data (Right - Purple):
- A purple segmented bar represents the malignant data point.
- A callout box points to the bar, showing an icon and a placeholder of "40%" for the data value.
- It includes an "Add Title" placeholder for the characteristic being measured.
Slide 36 - Brain Tumor: Benign vs Malignant (Data & Icon Comparison)
.avif)
This slide provides a clean, data-focused comparison of the two tumor types, using percentage callouts, icons, and descriptive text.
- Benign Side (Left - Blue):
- Features a large "70%" callout, representing a key statistic for Benign tumor behavior (e.g., survival rate or complete removal rate).
- A blue circular icon with a tight, organized cell cluster visually represents the benign nature.
- Includes placeholder descriptive text below the percentage.
- Malignant Side (Right - Purple):
- Features a large "40%" callout, representing a key statistic for Malignant tumor behavior.
- A purple circular icon with an irregular, spreading cellular mass visually represents the malignant nature.
- Includes placeholder descriptive text below the percentage.
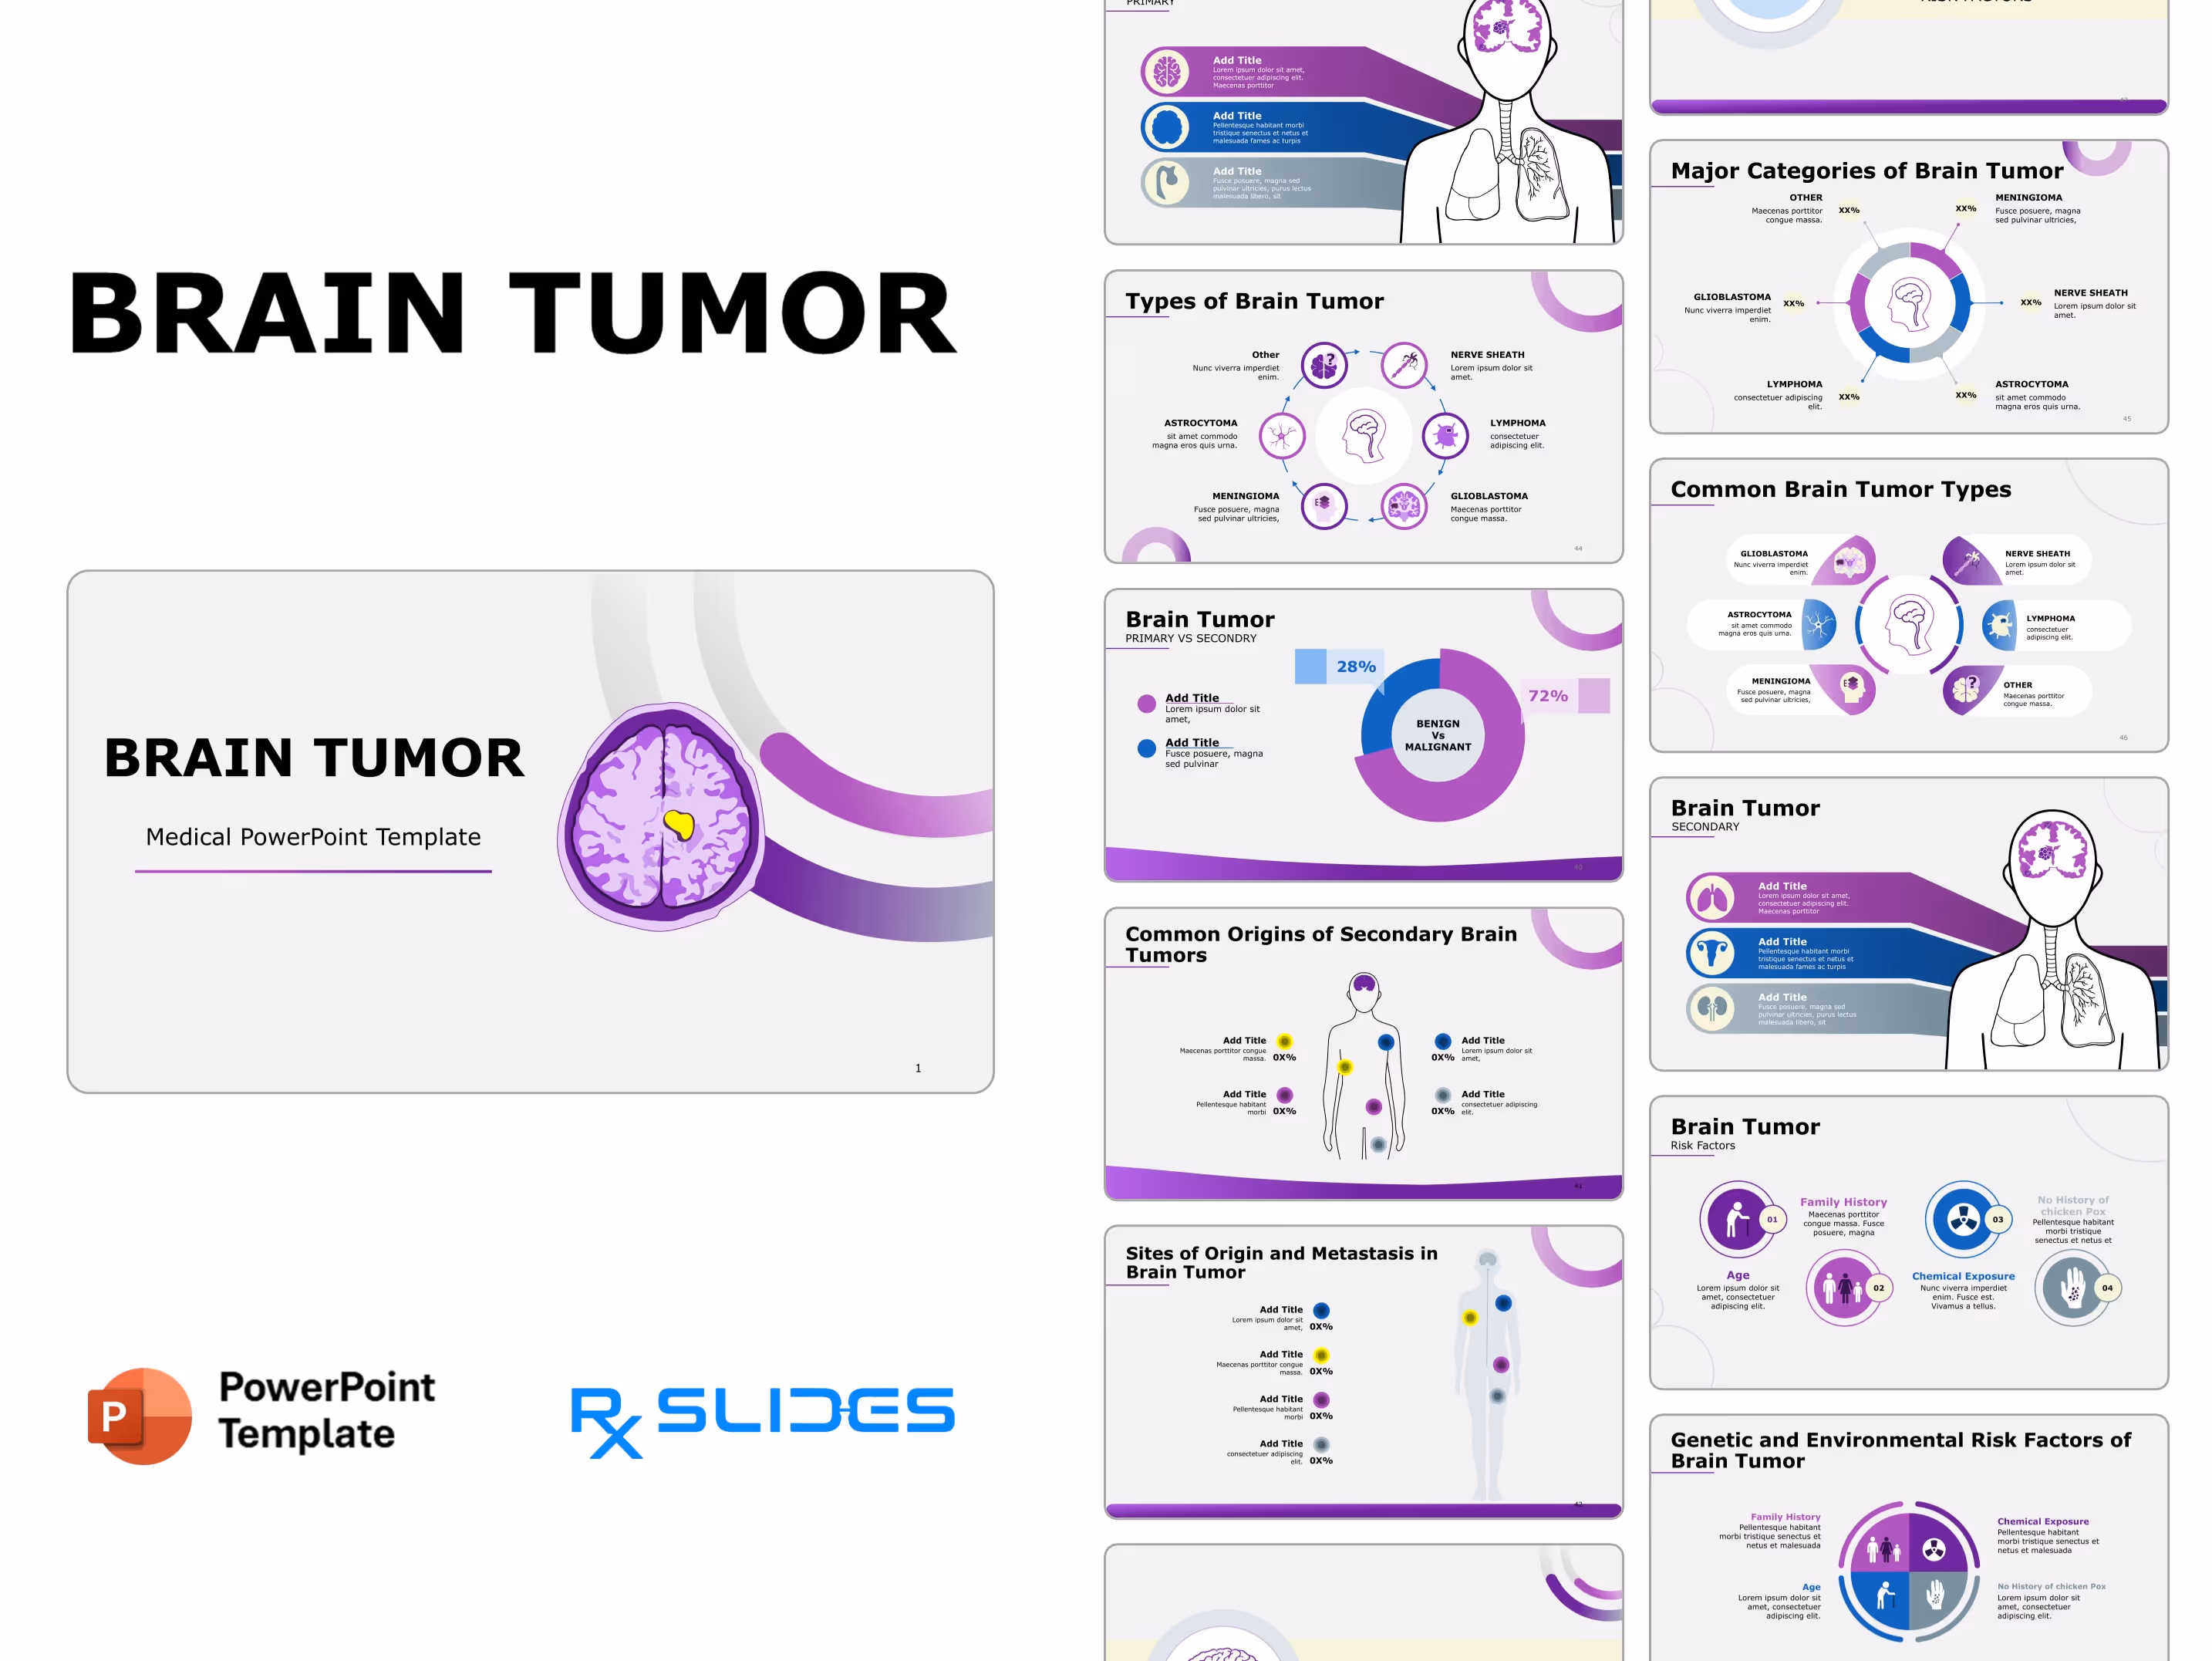
Slide 37 - Brain Tumor: Primary vs. Secondary
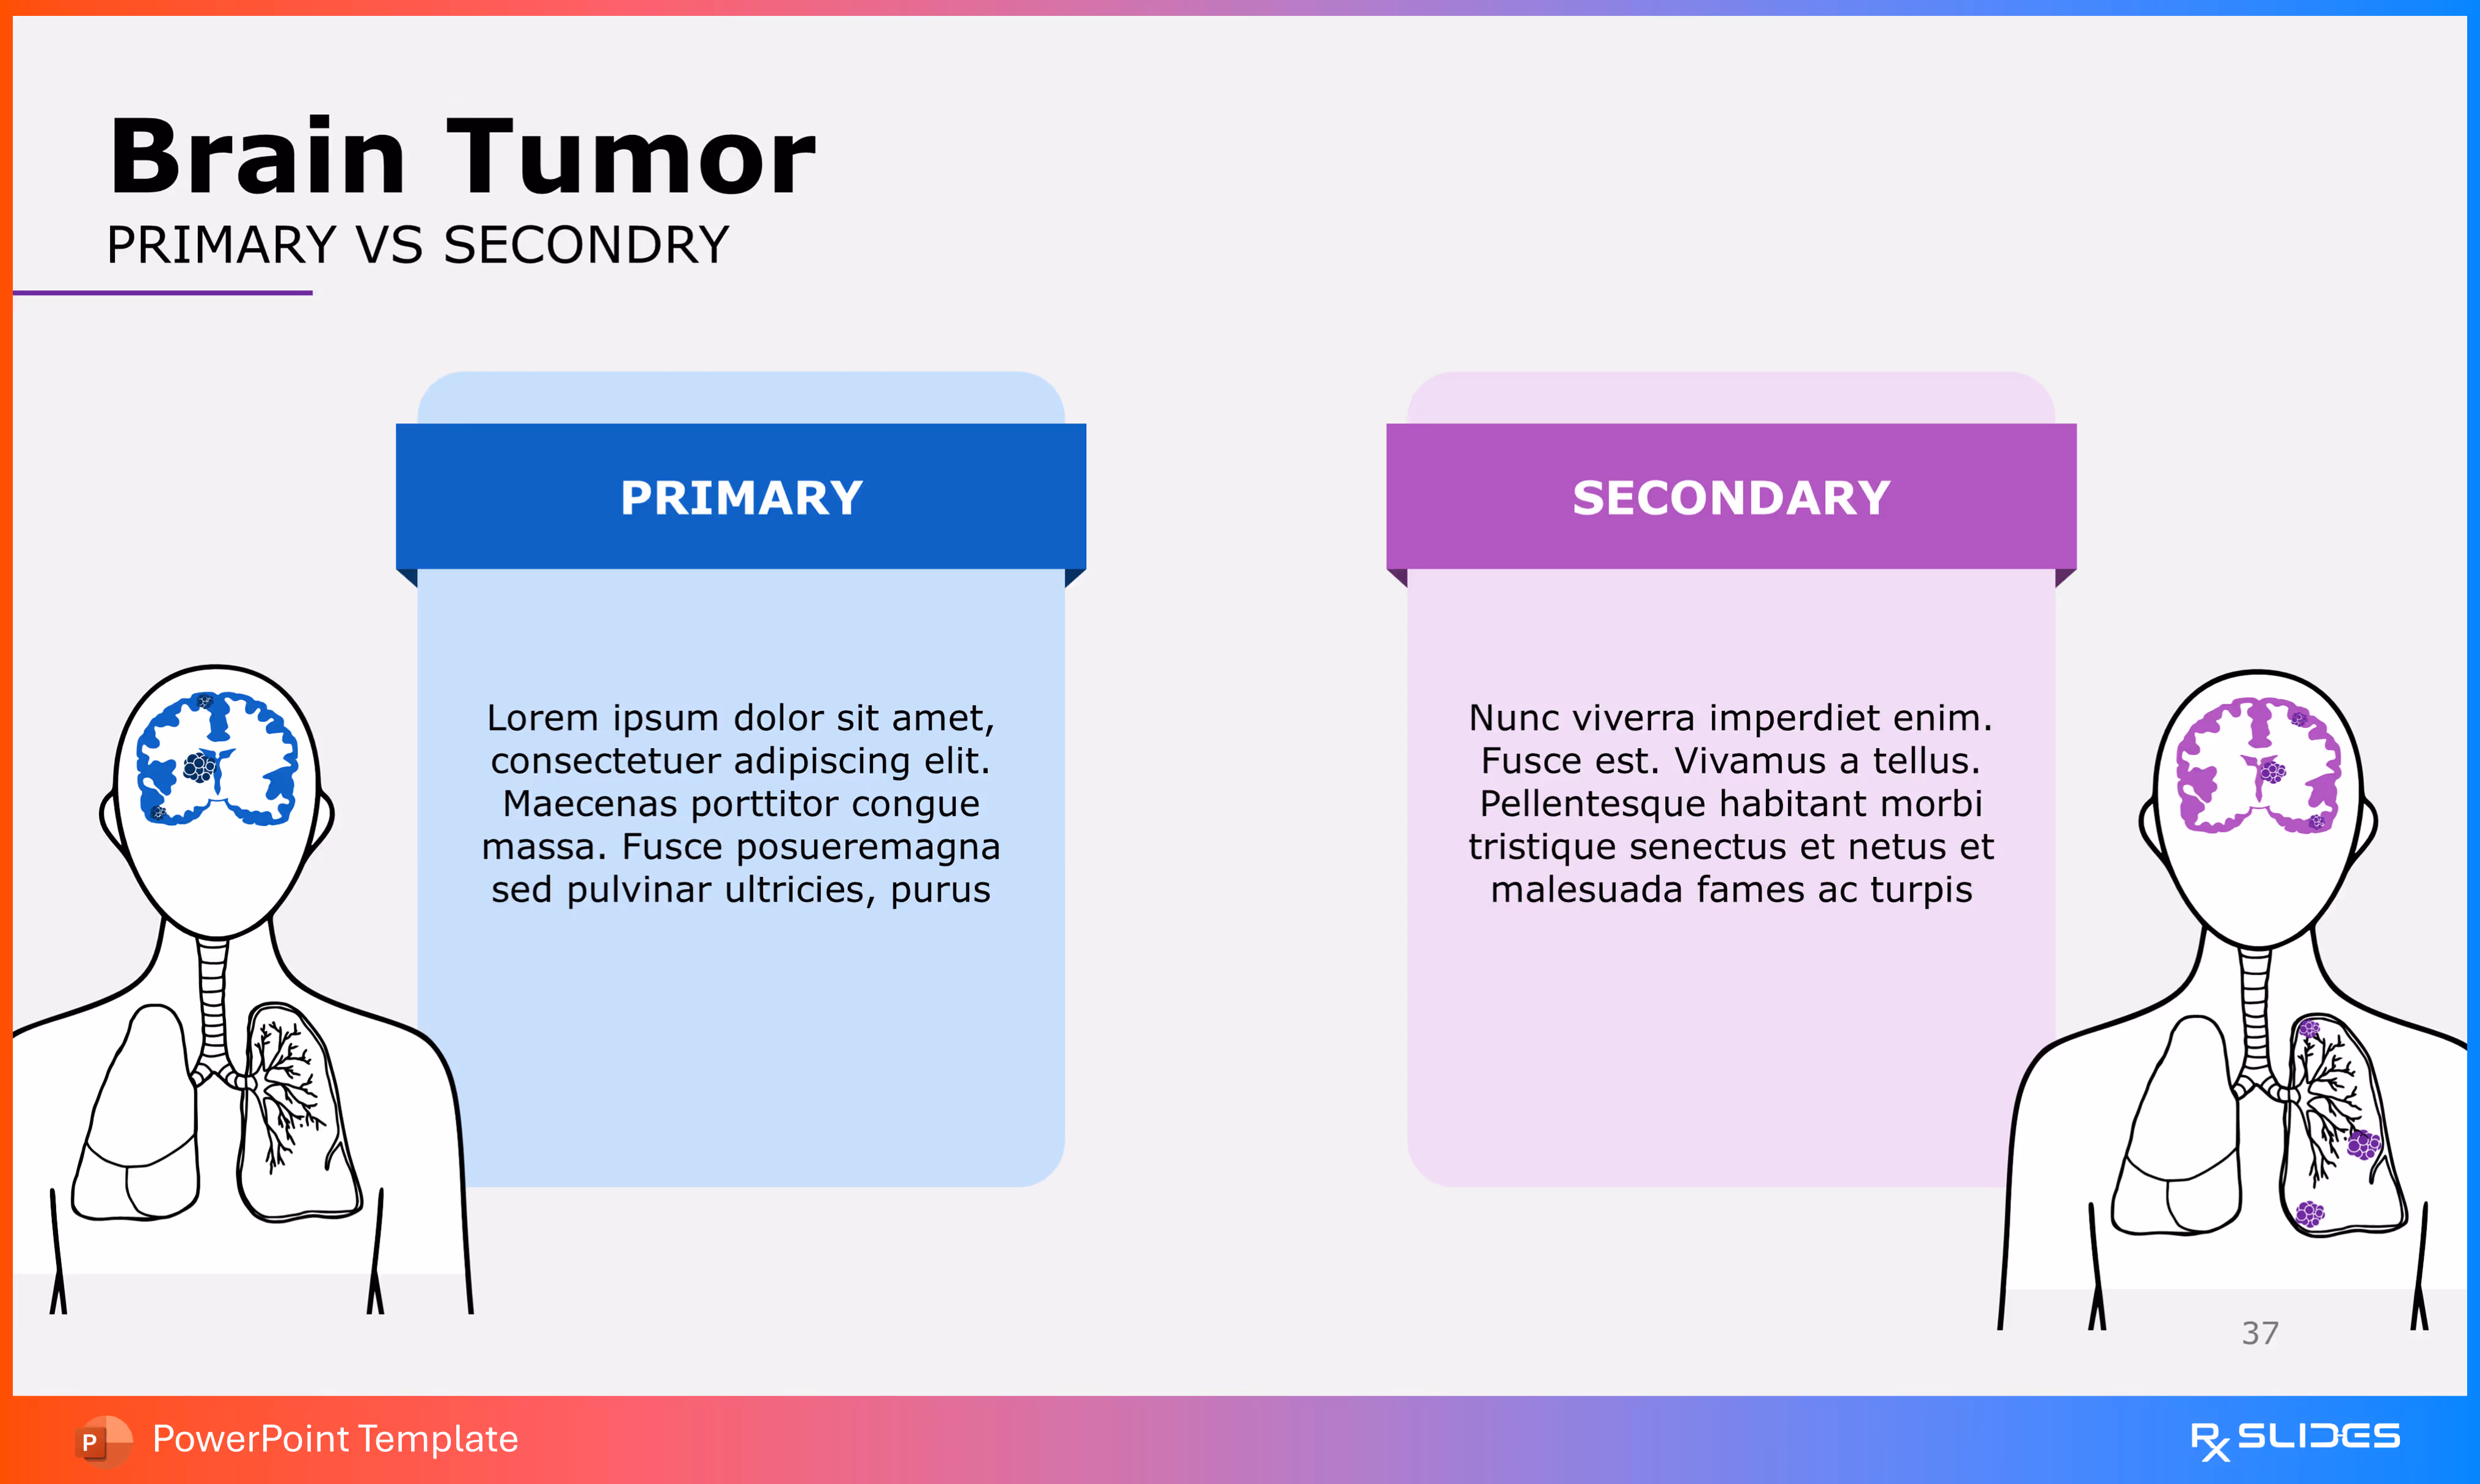
This slide moves beyond the Benign/Malignant classification to discuss the origin of the tumor, using a full body and brain graphic to illustrate the difference.
- Primary Tumors (Left - Blue):
- The blue card is labeled "PRIMARY".
- The associated body graphic shows a tumor mass (blue) originating within the brain.
- Placeholder text is included for describing the characteristics of tumors that originate in the brain.
- Secondary Tumors (Right - Purple):
- The purple card is labeled "SECONDARY".
- The associated body graphic shows a purple tumor mass in the brain and a second primary tumor site (also purple) in the lungs, illustrating metastasis.
- Placeholder text is included for describing the characteristics of tumors that have spread to the brain from elsewhere in the body.
Slide 38 - Brain Tumor: Primary Characteristics
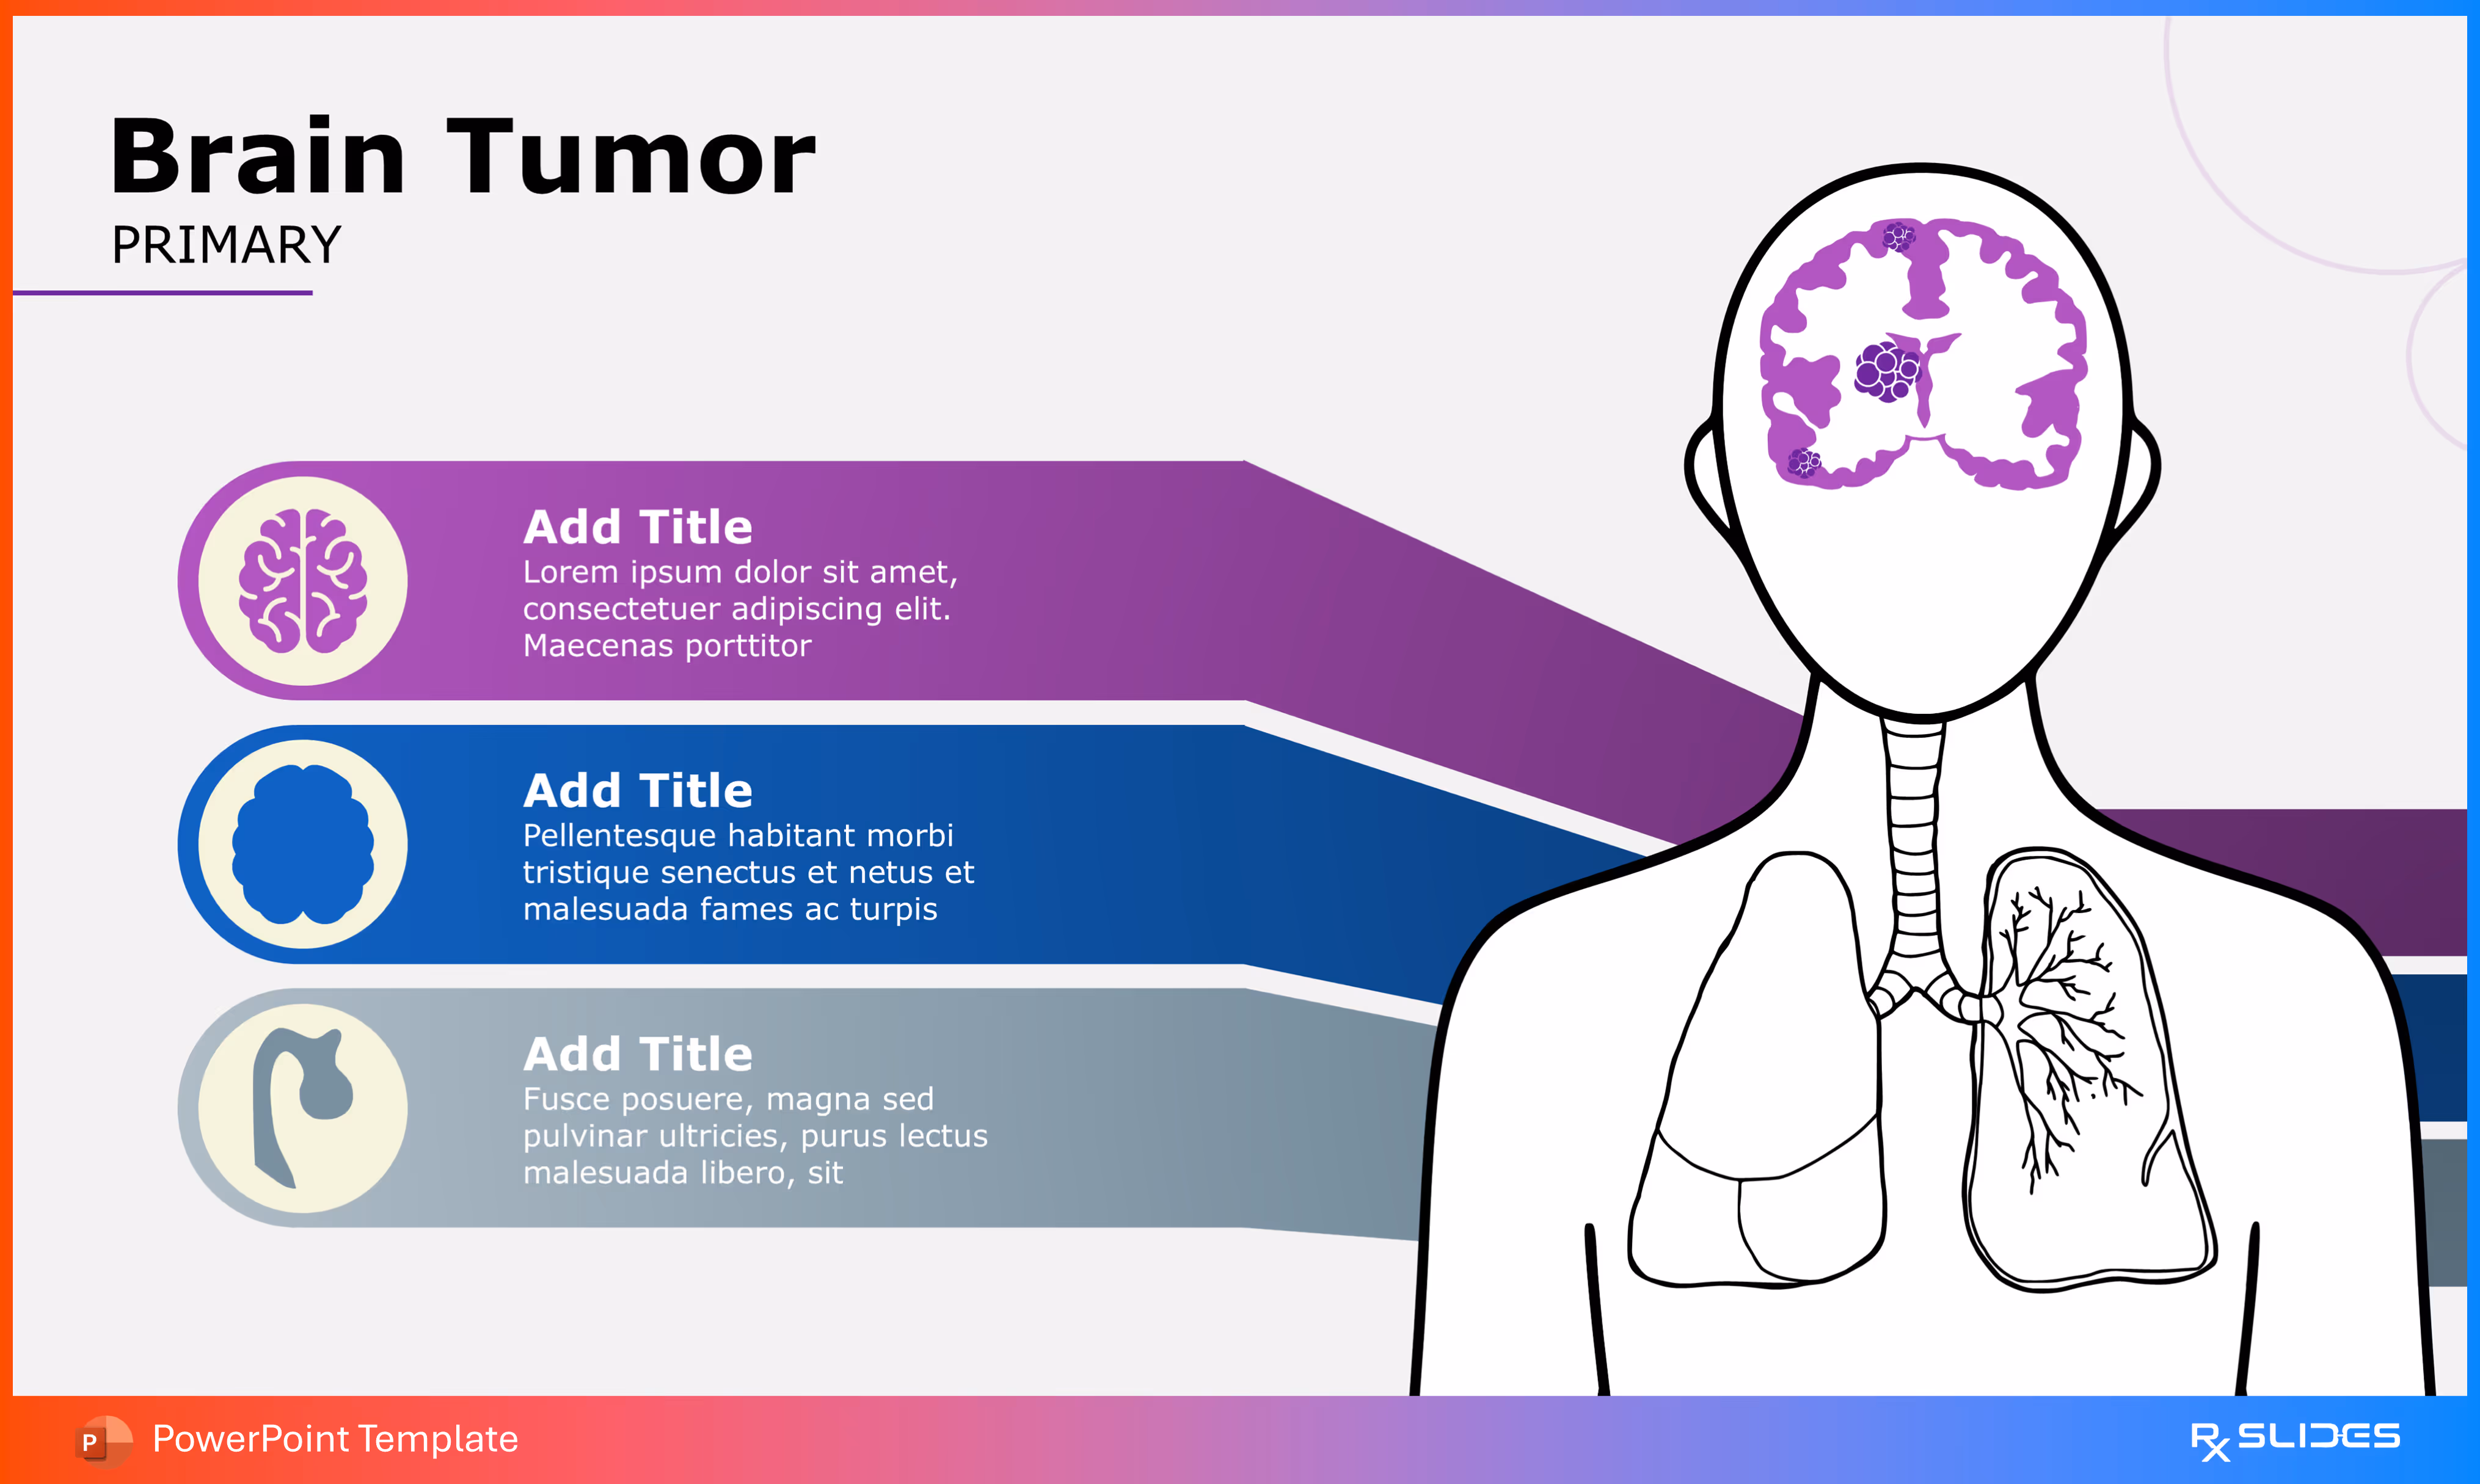
This slide provides a detailed breakdown of features specific to primary brain tumors (those originating in the brain), using a central human figure and a three-point infographic..
- Visual Element (Right): A central outline of a human figure showing the torso and head. The brain area is highlighted in purple with a tumor mass inside, visually confirming the primary origin.
- Three Characteristics (Left): Three color-coded, labeled pill shapes (purple, blue, gray) extend from the figure, allowing for a discussion of three distinct points:
- Purple: Icon of a brain. Includes "Add Title" and descriptive text placeholder.
- Blue: Icon of a cell cluster. Includes "Add Title" and descriptive text placeholder.
- Grey: Icon of a nerve/spinal root. Includes "Add Title" and descriptive text placeholder.
Slide 39 - Brain Tumor: Secondary Characteristics

This slide focuses on features specific to secondary (metastatic) brain tumors (those originating elsewhere and spreading to the brain), using a central human figure and a three-point infographic structure.
- Visual Element (Right): A central outline of a human figure showing the torso and head. The brain is highlighted with a tumor mass inside, and the lungs are also highlighted with a mass, visually confirming the metastatic path.
- Three Characteristics (Left): Three color-coded, labeled pill shapes (purple, blue, gray) extend from the figure, allowing for a discussion of the common primary sites or characteristics:
- Purple: Icon of lungs. Includes "Add Title" and descriptive text placeholder. (Often representing Lung Cancer, a common source of brain metastases).
- Blue: Icon of a bladder/prostate (or similar genitourinary organ). Includes "Add Title" and descriptive text placeholder.
- Grey: Icon of a kidney. Includes "Add Title" and descriptive text placeholder. (Indicating another common source of metastasis).
Slide 40 - Brain Tumor: Primary vs Secondary (Data Infographic)
.avif)
This slide provides a data-centric comparison of primary and secondary tumors, likely representing their relative incidence.
- A large donut chart dominates the center, comparing two segments:
- A smaller blue segment (28%).
- A larger purple segment (72%).
- The center is labeled "BENIGN Vs MALIGNANT". Note: The chart label is incorrect, referencing the previous section (Benign vs Malignant), while the subtitle refers to the current section (Primary vs Secondary).
- Data Points (Left and Right): Callouts link to the chart segments:
- Left side has two colored points (purple and blue) for additional titles and text.
- The blue segment is called out as 28%.
- The purple segment is called out as 72%.
Slide 41 - Common Origins of Secondary Brain Tumors
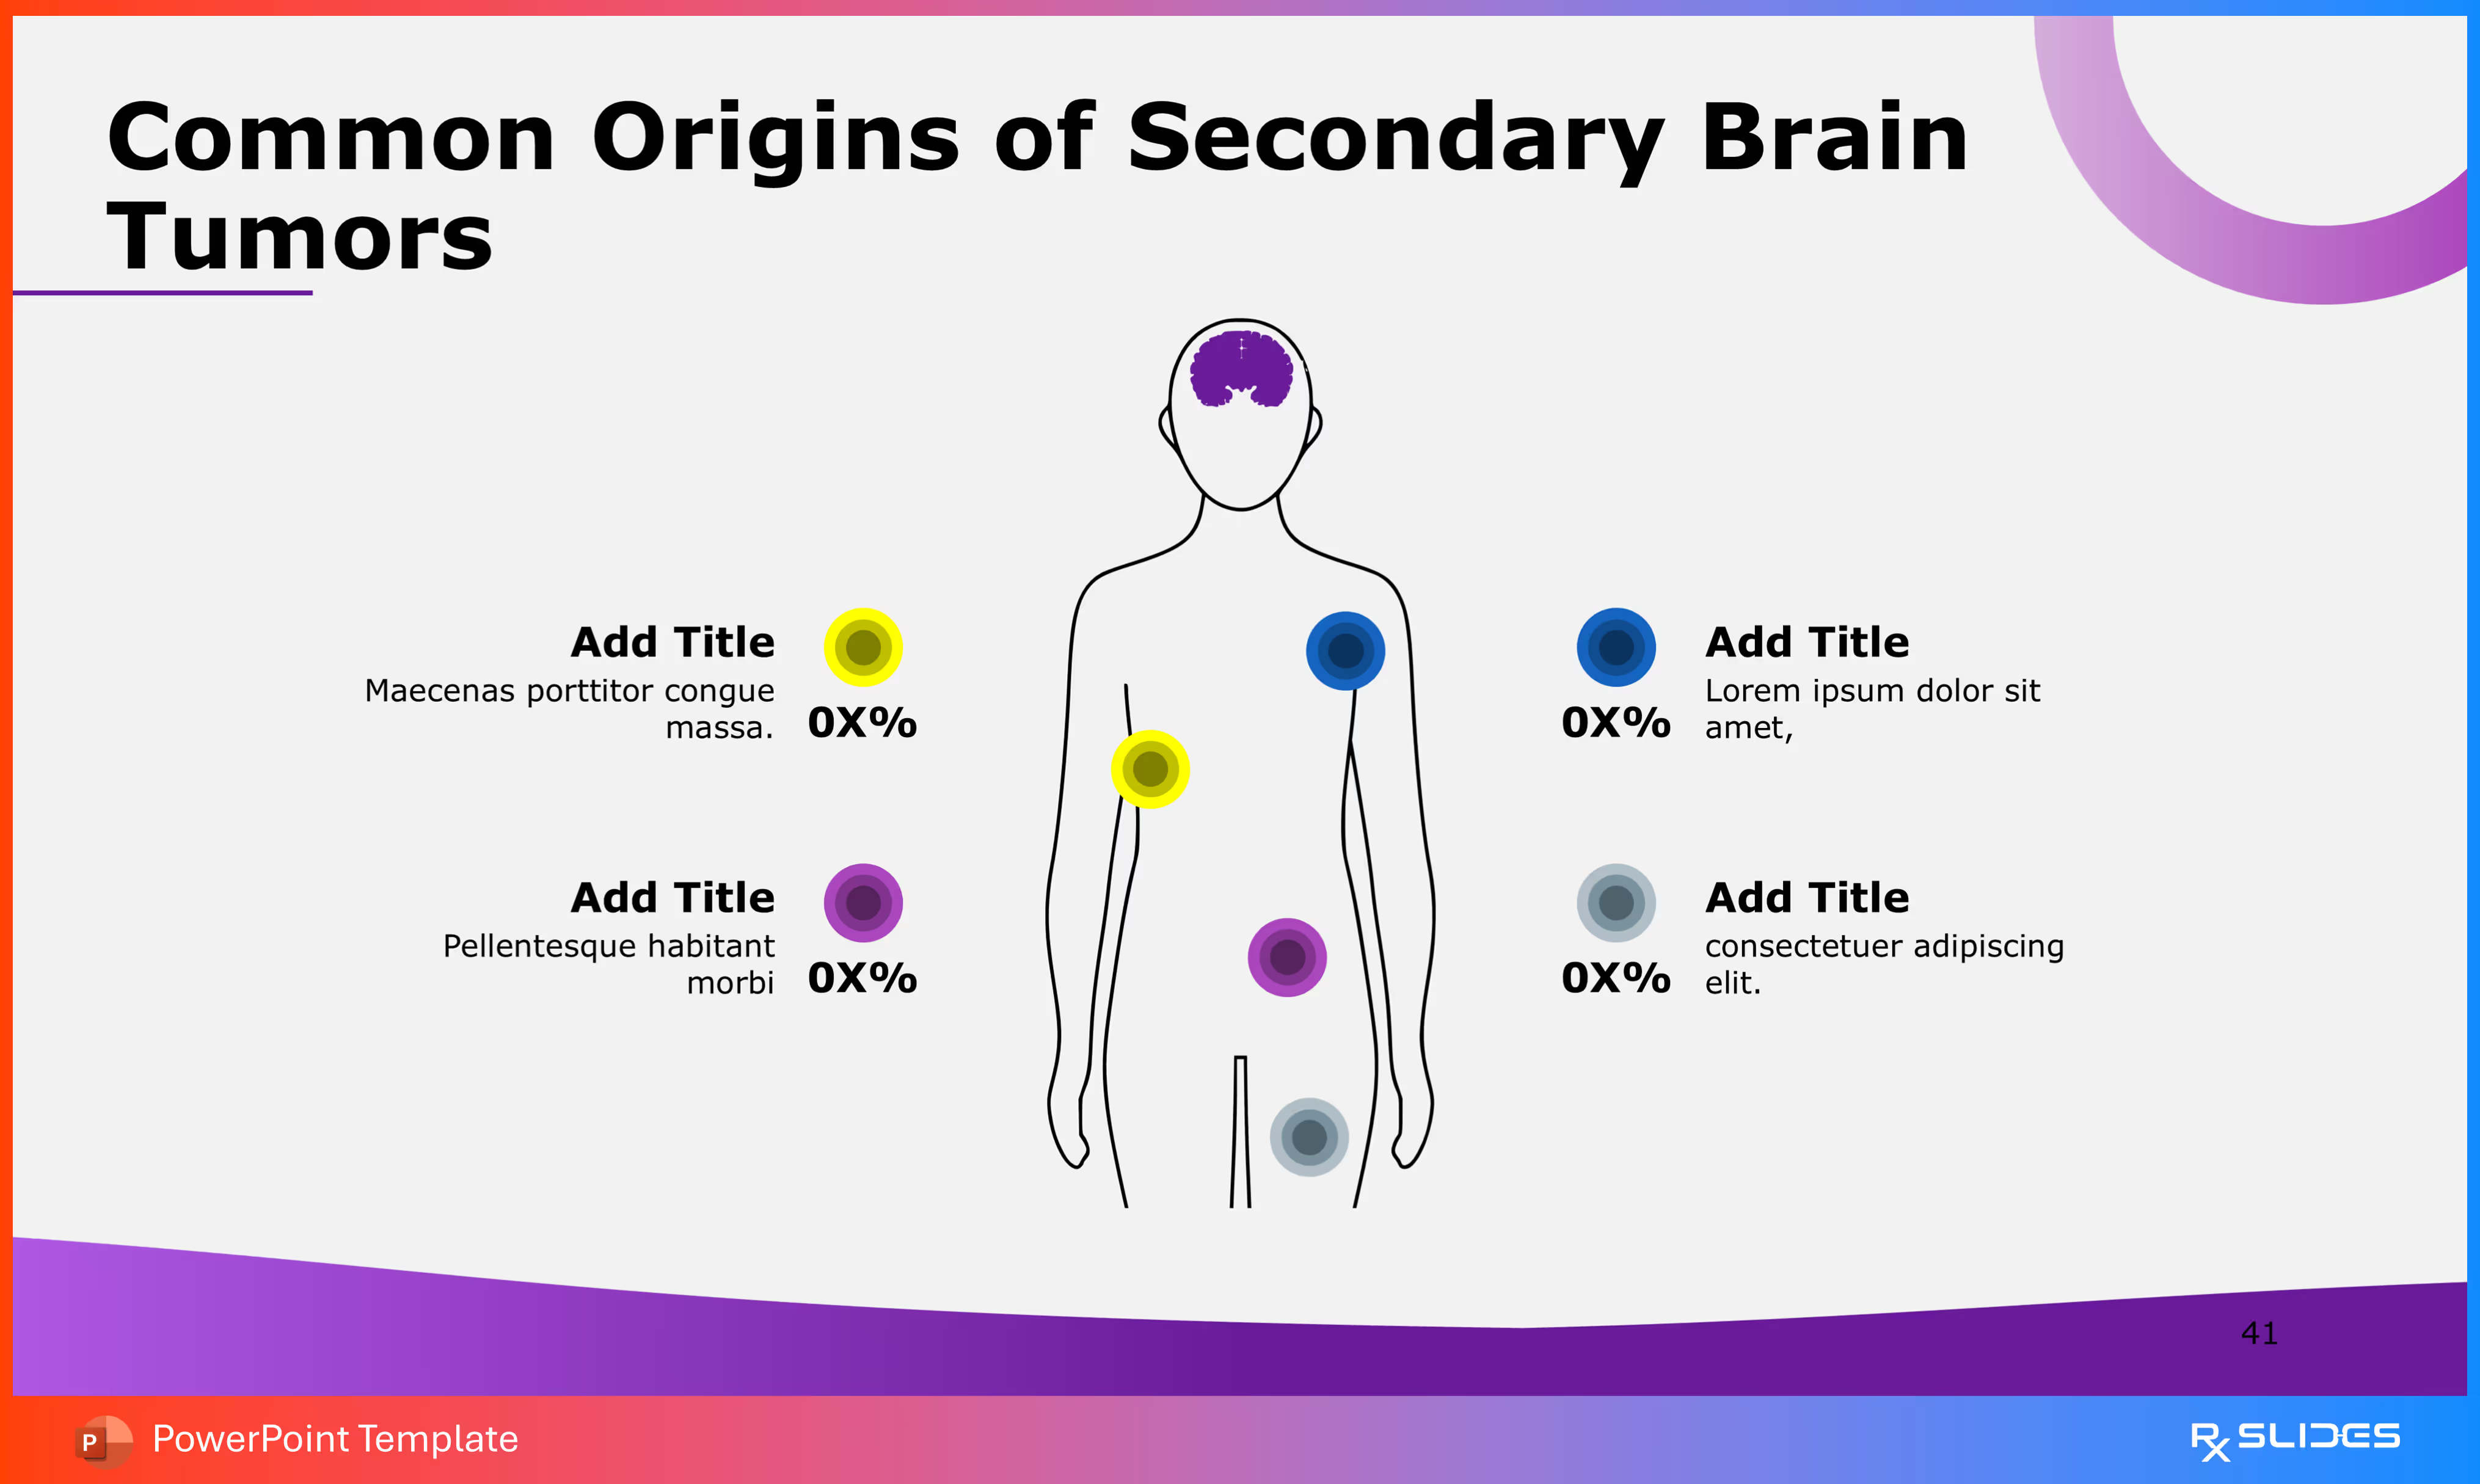
This slide provides a clear, infographic layout to visually represent the most common primary sites where cancer originates before metastasizing to the brain.
- A large, outline of a human figure with the head (brain) highlighted in purple.
- Primary Sites: Four color-coded, labeled points are mapped to various locations on the body:
- Top-Left (Yellow): A bubble on the torso/abdomen with a callout for an Add Title and a placeholder statistic "0X%".
- Bottom-Left (Purple): A bubble on the pelvic area with a callout for an Add Title and a placeholder statistic "0X%".
- Top-Right (Blue): A bubble on the chest/upper torso with a callout for an Add Title and a placeholder statistic "0X%".
- Bottom-Right (Grey/Blue): A bubble on the lower torso/abdomen with a callout for an Add Title and a placeholder statistic "0X%"
Slide 42 - Sites of Origin and Metastasis in Brain Tumor (Alternative Map)
.avif)
This slide uses a central human figure to map various organs where cancer can originate and later metastasize to the brain, providing data placeholders for incidence rates.
Slide 43 - Brain Tumor: Types (Section Divider)
.avif)
This is a section divider slide designed to transition the audience from the general classifications (Benign/Malignant, Primary/Secondary) into a detailed breakdown of the different types of brain tumors.
- The left side features a large, iconic image of a human brain, colored primarily in a light purple, with a specific area highlighted in yellow, representing a generalized tumor location.
Slide 44 - Types of Brain Tumor (Circular Flow Infographic)
.avif)
This slide provides a structured, circular flow diagram illustrating six major categories or types of brain tumors, along with a central human head icon.
- A clean outline of a human head is positioned in the center, symbolizing the focus.
- The Six Types (Clockwise from Top): The six tumor types are arranged in a ring around the center, with connecting arrows suggesting a process or relationship:
- Other: Features a question mark icon within a brain. Includes descriptive placeholder text.
- NERVE SHEATH: Features an icon of a nerve axon. Includes descriptive placeholder text.
- LYMPHOMA: Features a circular icon with spiky/viral shapes. Includes descriptive placeholder text.
- GLIOBLASTOMA: Features an icon showing a brain with a tumor and cellular details. Includes descriptive placeholder text.
- MENINGIOMA: Features an icon of a head/brain profile with an 'E' symbol. Includes descriptive placeholder text.
- ASTROCYTOMA: Features an icon of a star-shaped cell (astrocyte). Includes descriptive placeholder text.
Slide 45 - Major Categories of Brain Tumor (Donut Chart Infographic)
.avif)
This slide uses a segmented donut chart (or ring chart) to represent the proportional frequency or distribution of the different major categories of brain tumors.
- A donut chart divided into six segments uses purple, blue, and gray shades. A central human head profile icon reinforces the topic.
- The Six Categories (Clockwise from Top): Each segment is labeled and points outward to a percentage placeholder (XX%).
Slide 46 - Common Brain Tumor Types (Callout Infographic)
.avif)
This slide uses an attractive circular design with callout boxes to present the six Common Brain Tumor Types, combining a visual icon with a brief description for each one.
- A prominent, stylized outline of a human head and brain serves as the centerpiece.
Slide 47 - Brain Tumor: Risk Factors (Section Divider)
.avif)
This is a section divider slide designed to transition the audience from the diagnostic classifications into a discussion about the causes and predisposing factors associated with brain tumors.
- The left side features a large, iconic image within a circular frame, showing a yellow center surrounded by three purple blades, resembling a radiation symbol or a chemical hazard sign.
- This visual effectively symbolizes factors like radiation exposure, genetics, or environmental hazards often associated with risk.
Slide 48 - Brain Tumor: Risk Factors (Four-Point Infographic)
.avif)
This slide provides a structured, four-point layout to discuss key factors that may increase the risk of developing a brain tumor.
- Each factor is presented in a circular design with a distinct icon and color:
- Age/Elderly (Purple, Top-Left): Features an icon of an elderly person with a cane. Labeled "Age" with placeholder text below the icon.
- Family History/Genetics (Purple, Bottom-Middle): Features an icon of a family/group of people. Labeled "Family History" with placeholder text.
- Chemical Exposure/Radiation (Blue, Top-Right): Features an icon of a radiation symbol. Labeled "Chemical Exposure" with placeholder text.
- No History of Chicken Pox/Immunity (Gray, Bottom-Right): Features an icon of a hand with spots (representing chickenpox or a rash). Labeled "No History of chicken Pox" with placeholder text.
Slide 49 - Genetic and Environmental Risk Factors of Brain Tumor

This slide uses a quadrant-style infographic to group and present the four key risk factors, clearly distinguishing between those that are genetic/hereditary and those that are environmental.
- A large circle is divided into four equal quadrants, each representing one risk factor.
Slide 50 - Brain Tumor: Symptoms (Section Divider)
.avif)
This is a section divider slide designed to transition the audience from the factors that cause tumors to the observable effects and signs of brain tumor presence.
- The left side features a large, stylized icon of a purple human figure holding their head, indicating pain or headache (a common symptom).
- Behind the figure is an eye chart and glasses, symbolizing vision problems, another key symptom.
Slide 51 - Brain Tumor Symptoms (Circular Flow Infographic)
.avif)
This slide provides a clear, radial infographic to display six major clinical symptoms associated with brain tumors.
- A central circle is labeled "Symptoms" and is surrounded by six points arranged in a circular flow.
- The Six Symptoms (Clockwise from Top-Left):
- SEIZURE: Features an icon of a brain with electrical/seizure activity. Includes descriptive placeholder text.
- VOMITING: Features an icon of a person hunched over. Includes descriptive placeholder text.
- SLEEPING PROBLEMS: Features an icon of a sleeping face and a 'Zzzz' symbol. Includes descriptive placeholder text.
- VISION PROBLEMS: Features an icon of an eye with radiating lines. Includes descriptive placeholder text.
- FATIGUE: Features an icon of a person bending over (exhaustion). Includes descriptive placeholder text.
- HEADACHE: Features an icon of a head/face with a localized pain spot. Includes descriptive placeholder text.
Slide 52 - Common Symptoms Brain Tumor (Linear Flow Infographic)
.avif)
This slide uses a horizontal, linear flow to present six Common Symptoms of Brain Tumor, allowing for easy reading across the page.
- A series of six icon cards are arranged horizontally and linked by connector lines, with the symptom names divided above and below the line.
Slide 53 - Brain Tumor Red Flags (Six-Point Callout Infographic)
.avif)
This slide uses a clean, numbered, two-column layout to highlight six critical symptoms that may serve as early warning signs or "red flags" for a brain tumor.
- A circle in the middle is labeled "Symptoms," surrounded by six numbered callout boxes.
Slide 54 - Warning Signs of Brain Tumor (horizontal Infographic)
.avif)
This slide uses a horizontal, timeline-like layout to present six key Warning Signs of Brain Tumor, with each symptom clearly linked to its title and description.
- Six circular icons are arranged horizontally, each sitting on a vertical line that points down to the symptom's name and descriptive text.
Slide 55 - How Brain Tumors Present? (Circular Flow Infographic)
.avif)
This slide uses a circular flow diagram to present the same six common symptoms/presentations of a brain tumor, organized symmetrically around the ring.
Slide 56 - Brain Tumor: Diagnosis (Section Divider)
.avif)
This is a section divider slide designed to transition the audience from the clinical presentation (Symptoms) to the medical procedures and tools used for confirmation and pathology.
- The left side features a large, stylized icon of a microscope.
- The microscope is a universal symbol for pathology and laboratory analysis, indicating that the following slides will focus on the tools, like biopsy and imaging, essential for confirming a brain tumor diagnosis.
Slide 57 - How Brain Tumors are detected? (Four-Point Infographic)
.avif)
This slide answers the question, "How Brain Tumors are detected?" by presenting a horizontal flow diagram of four common diagnostic methods.
- Four circular icons are arranged horizontally, each sitting on a line that points down to the method's name and descriptive text.
- The Four Detection Methods (Left to Right):
- NEUROLOGICAL EXAM: Features an icon of a nerve cell (neuron).
- SKULL X-RAY: Features an icon of a skull.
- CT SCAN: Features an icon of a person inside a scanner.
- BIOPSY: Features an icon of a microscope.
Slide 58 - Evaluating Suspected Brain Tumors (Four-Point Quadrant Infographic)
.avif)
This slide uses a simple four-point, two-row layout to list the methods for Evaluating Suspected Brain Tumors.
Slide 59 - Brain Tumor: Treatment (Section Divider)
.avif)
This is a section divider slide designed to transition the audience from diagnosis to the various intervention strategies available for managing brain tumors.
- The left side features a large, dynamic icon within a circular frame, symbolizing the primary treatment modalities.
- A purple IV bag/drip represents Chemotherapy.
- A scalpel represents Surgery.
- Yellow radio waves/sound waves represent Radiation Therapy or other targeted treatments.
Slide 60 - What Guides Brain Tumor Treatment? (Four Determinants)
.avif)
This slide uses a clean, horizontal flow infographic to detail the four primary factors that dictate the therapeutic approach for a brain tumor.
- Four rectangular cards, two purple and two blue/gray, are arranged horizontally and connected by a timeline/flow.
- The Four Guiding Factors (Left to Right):
- TYPE (Purple): Features three abstract shapes (circle, square, triangle), symbolizing the pathological type or grade of the tumor.
- GENERAL HEALTH (Purple): Features a small circle inside a larger circle, potentially representing the patient's overall systemic condition.
- SIZE (Blue): Features three different-sized circles, visually demonstrating the importance of tumor volume.
- LOCATION (Gray): Features dotted circles over a brain outline, highlighting the tumor's critical position within the brain structure.
Slide 61 - How Brain Tumors are Treated (Three Treatment Modalities)
.avif)
This slide addresses the question "How Brain Tumors are Treated" by presenting the three main treatment options in a clean, horizontal flow.
- Three circular icons are arranged horizontally, each representing a different form of therapy.
- The Three Treatment Modalities (Left to Right):
- SURGERY (Purple): Features an icon of a surgical instrument (forceps or scalpel). Includes placeholder text.
- RADIOTHERAPY (Blue): Features an icon with a central source radiating waves, symbolizing radiation treatment. Includes placeholder text.
- CHEMOTHERAPY (Gray): Features an icon of an IV bag/drip, representing systemic drug therapy. Includes placeholder text.
Slide 62 - Thank You (Conclusion Slide)
.avif)
This is the standard closing slide, designed to thank the audience and provide a final visual related to the presentation topic.
- A simplified, stylized illustration of a human brain with a clearly demarcated tumor in the cerebrum (highlighted in yellow) is prominently displayed on the left.
- The visual is contained within a circular frame that matches the template's overall aesthetic.
Features of the Template
- 100% editable PowerPoint template.
- Editable colors, you can change according to your presentation style and company branding guidelines.


.avif)
.avif)