Vitamin D Deficiency PowerPoint Template
No items found.
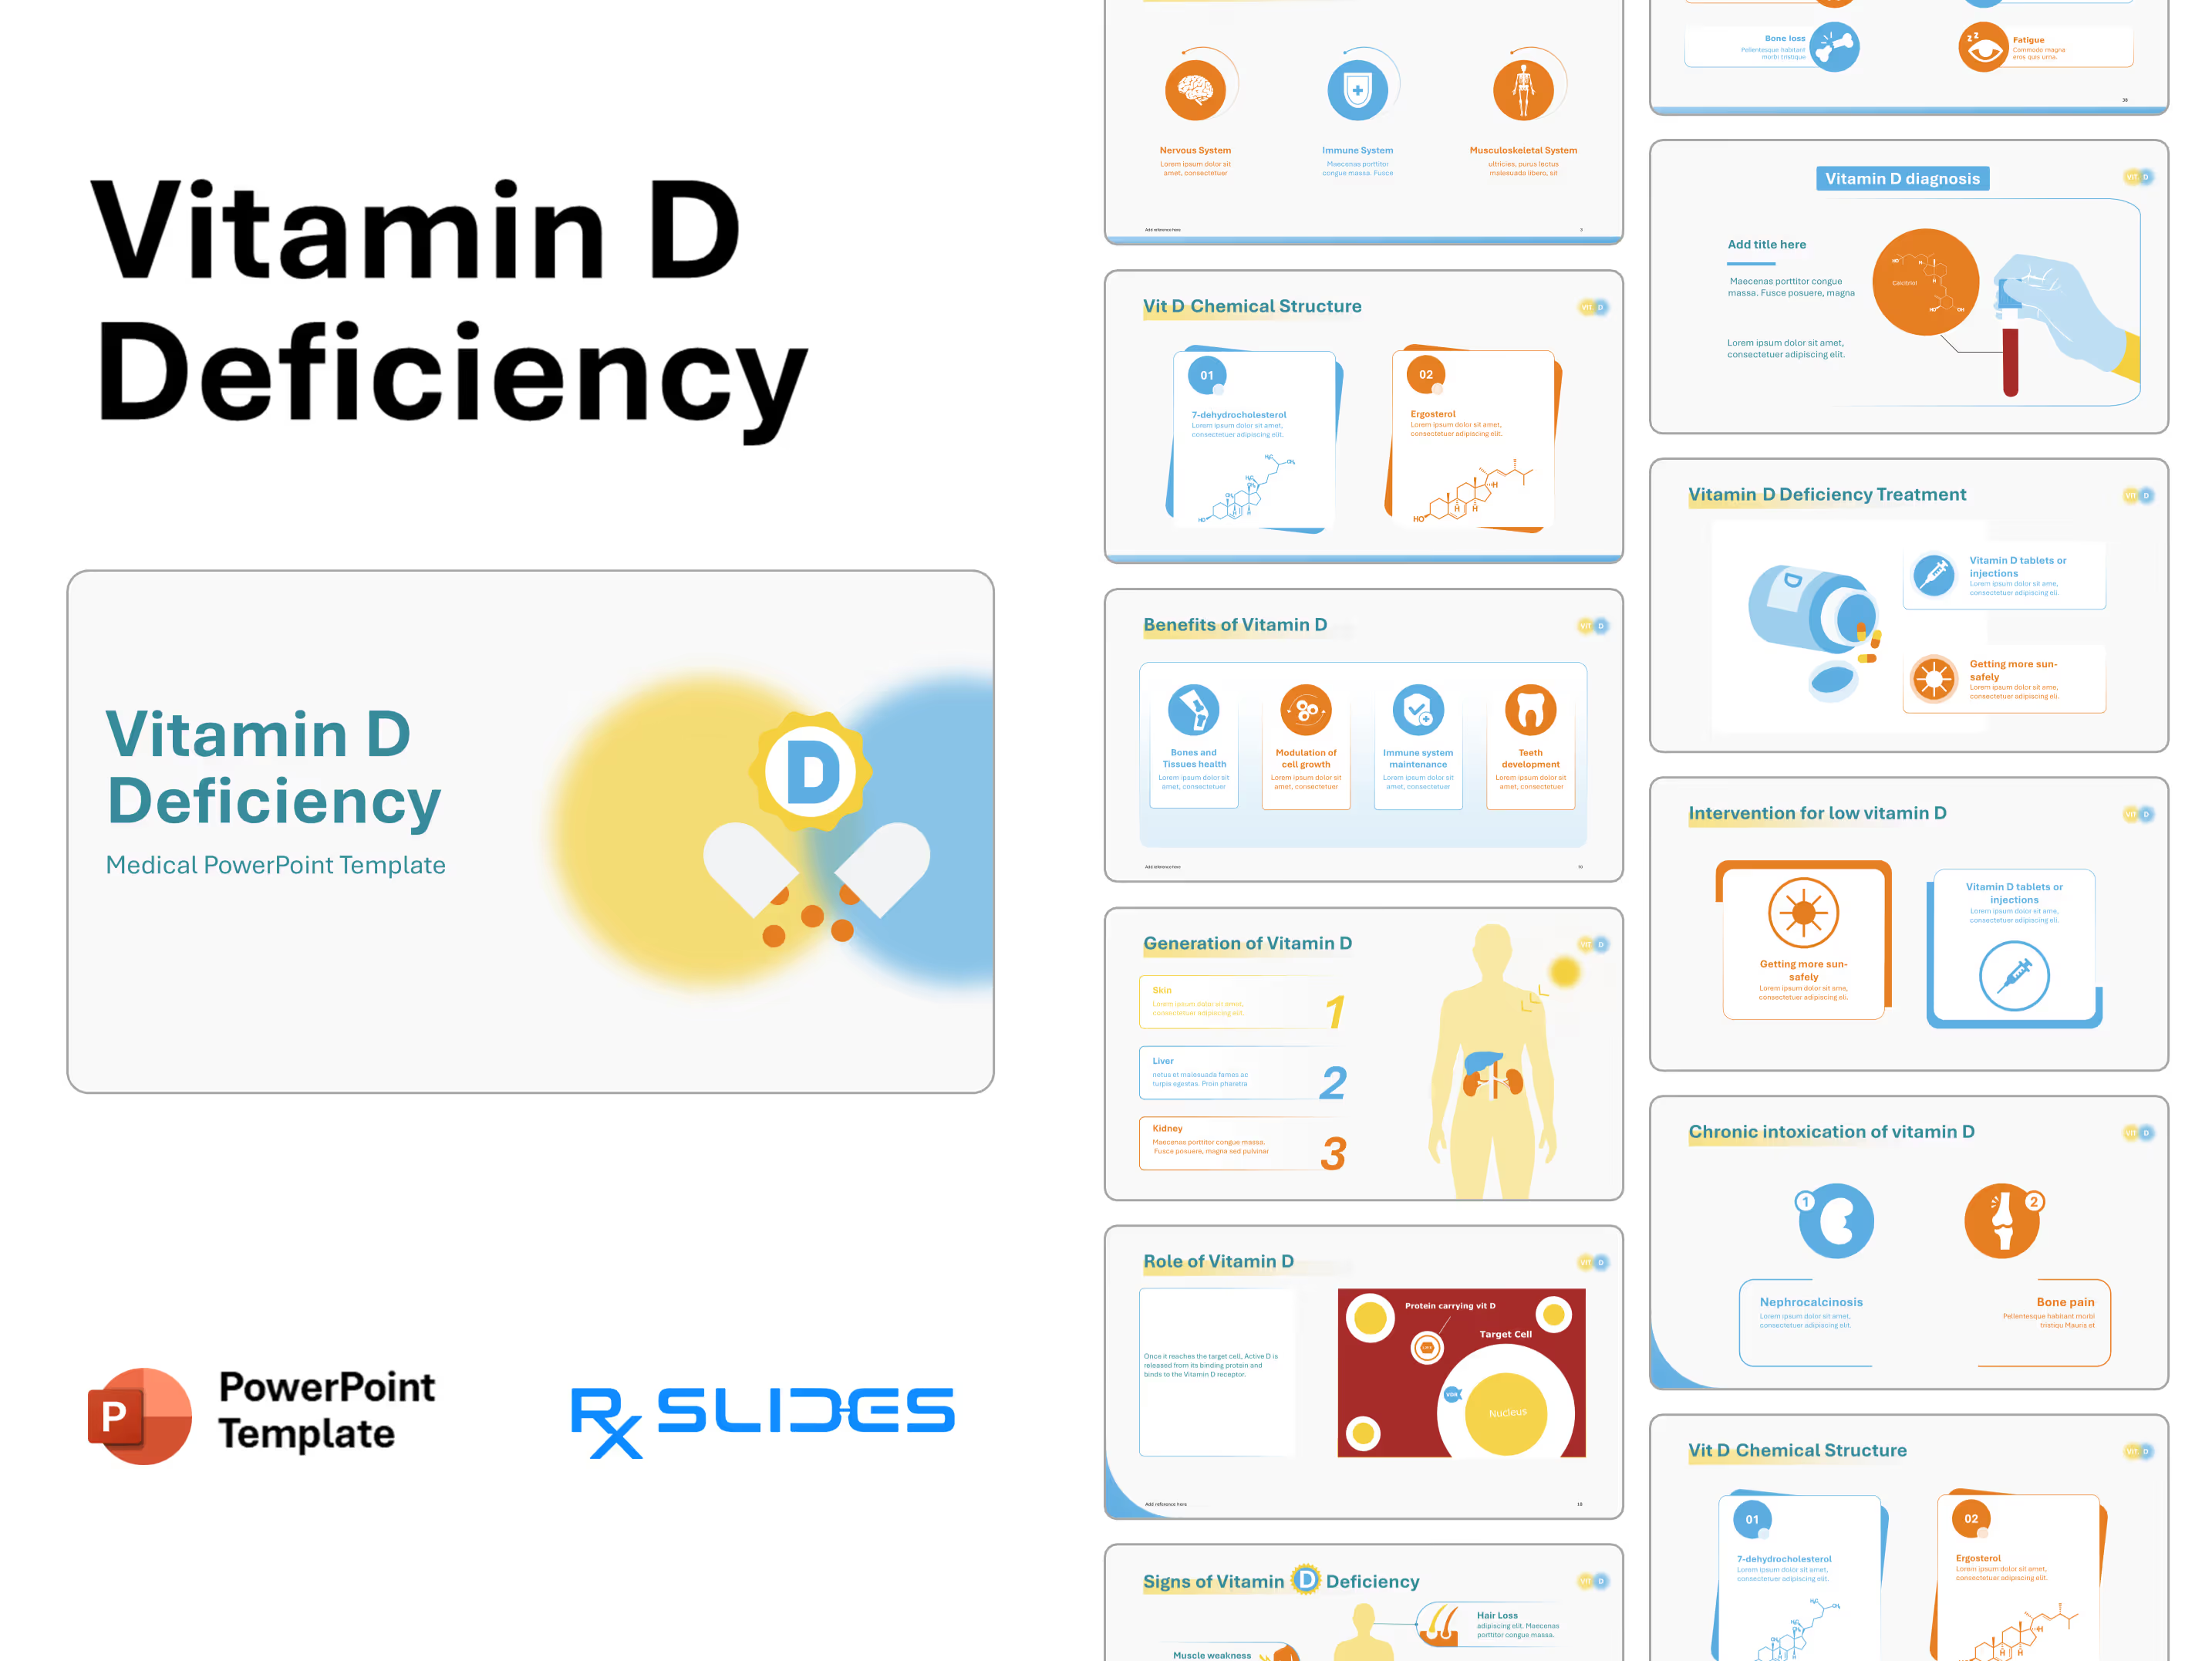
Vitamin D Presentation: Medical PowerPoint Template
- Vitamin D PPT template is a dynamic medical PowerPoint template that will help you realize the full potential of your presentation.
- Our carefully designed slides, which include medical animations and infographics, will attract your audience.
- You can use our demonstrated infographics to give your audience a dynamic and appealing Vitamin D presentation template.
- Our Human Digestive System PPT Templates library offers pre-designed slides that you can customize to fit your needs.
Vitamin D PowerPoint Template Preview
Vitamin D PowerPoint Template Content
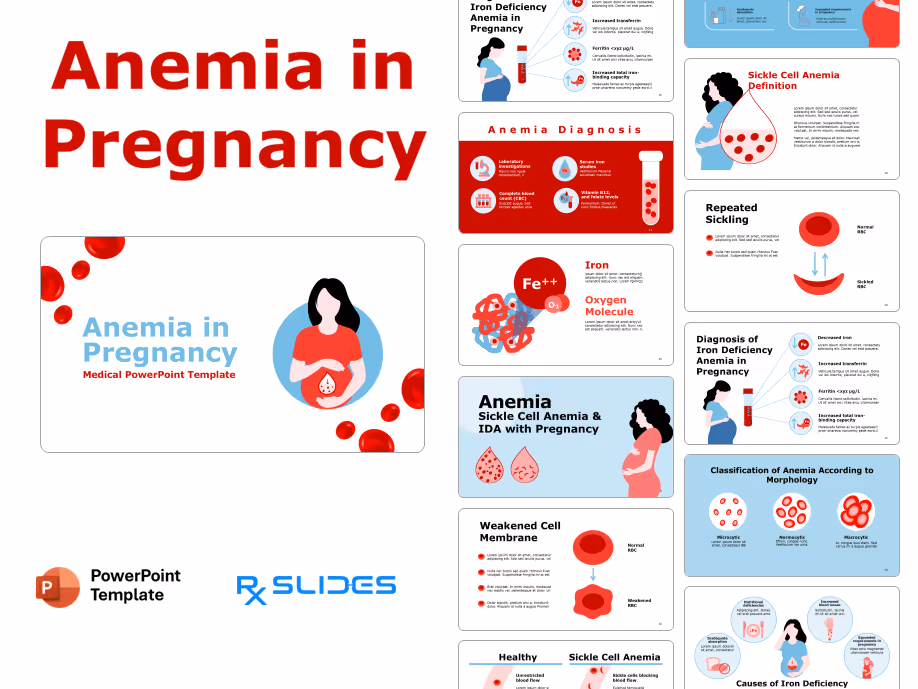
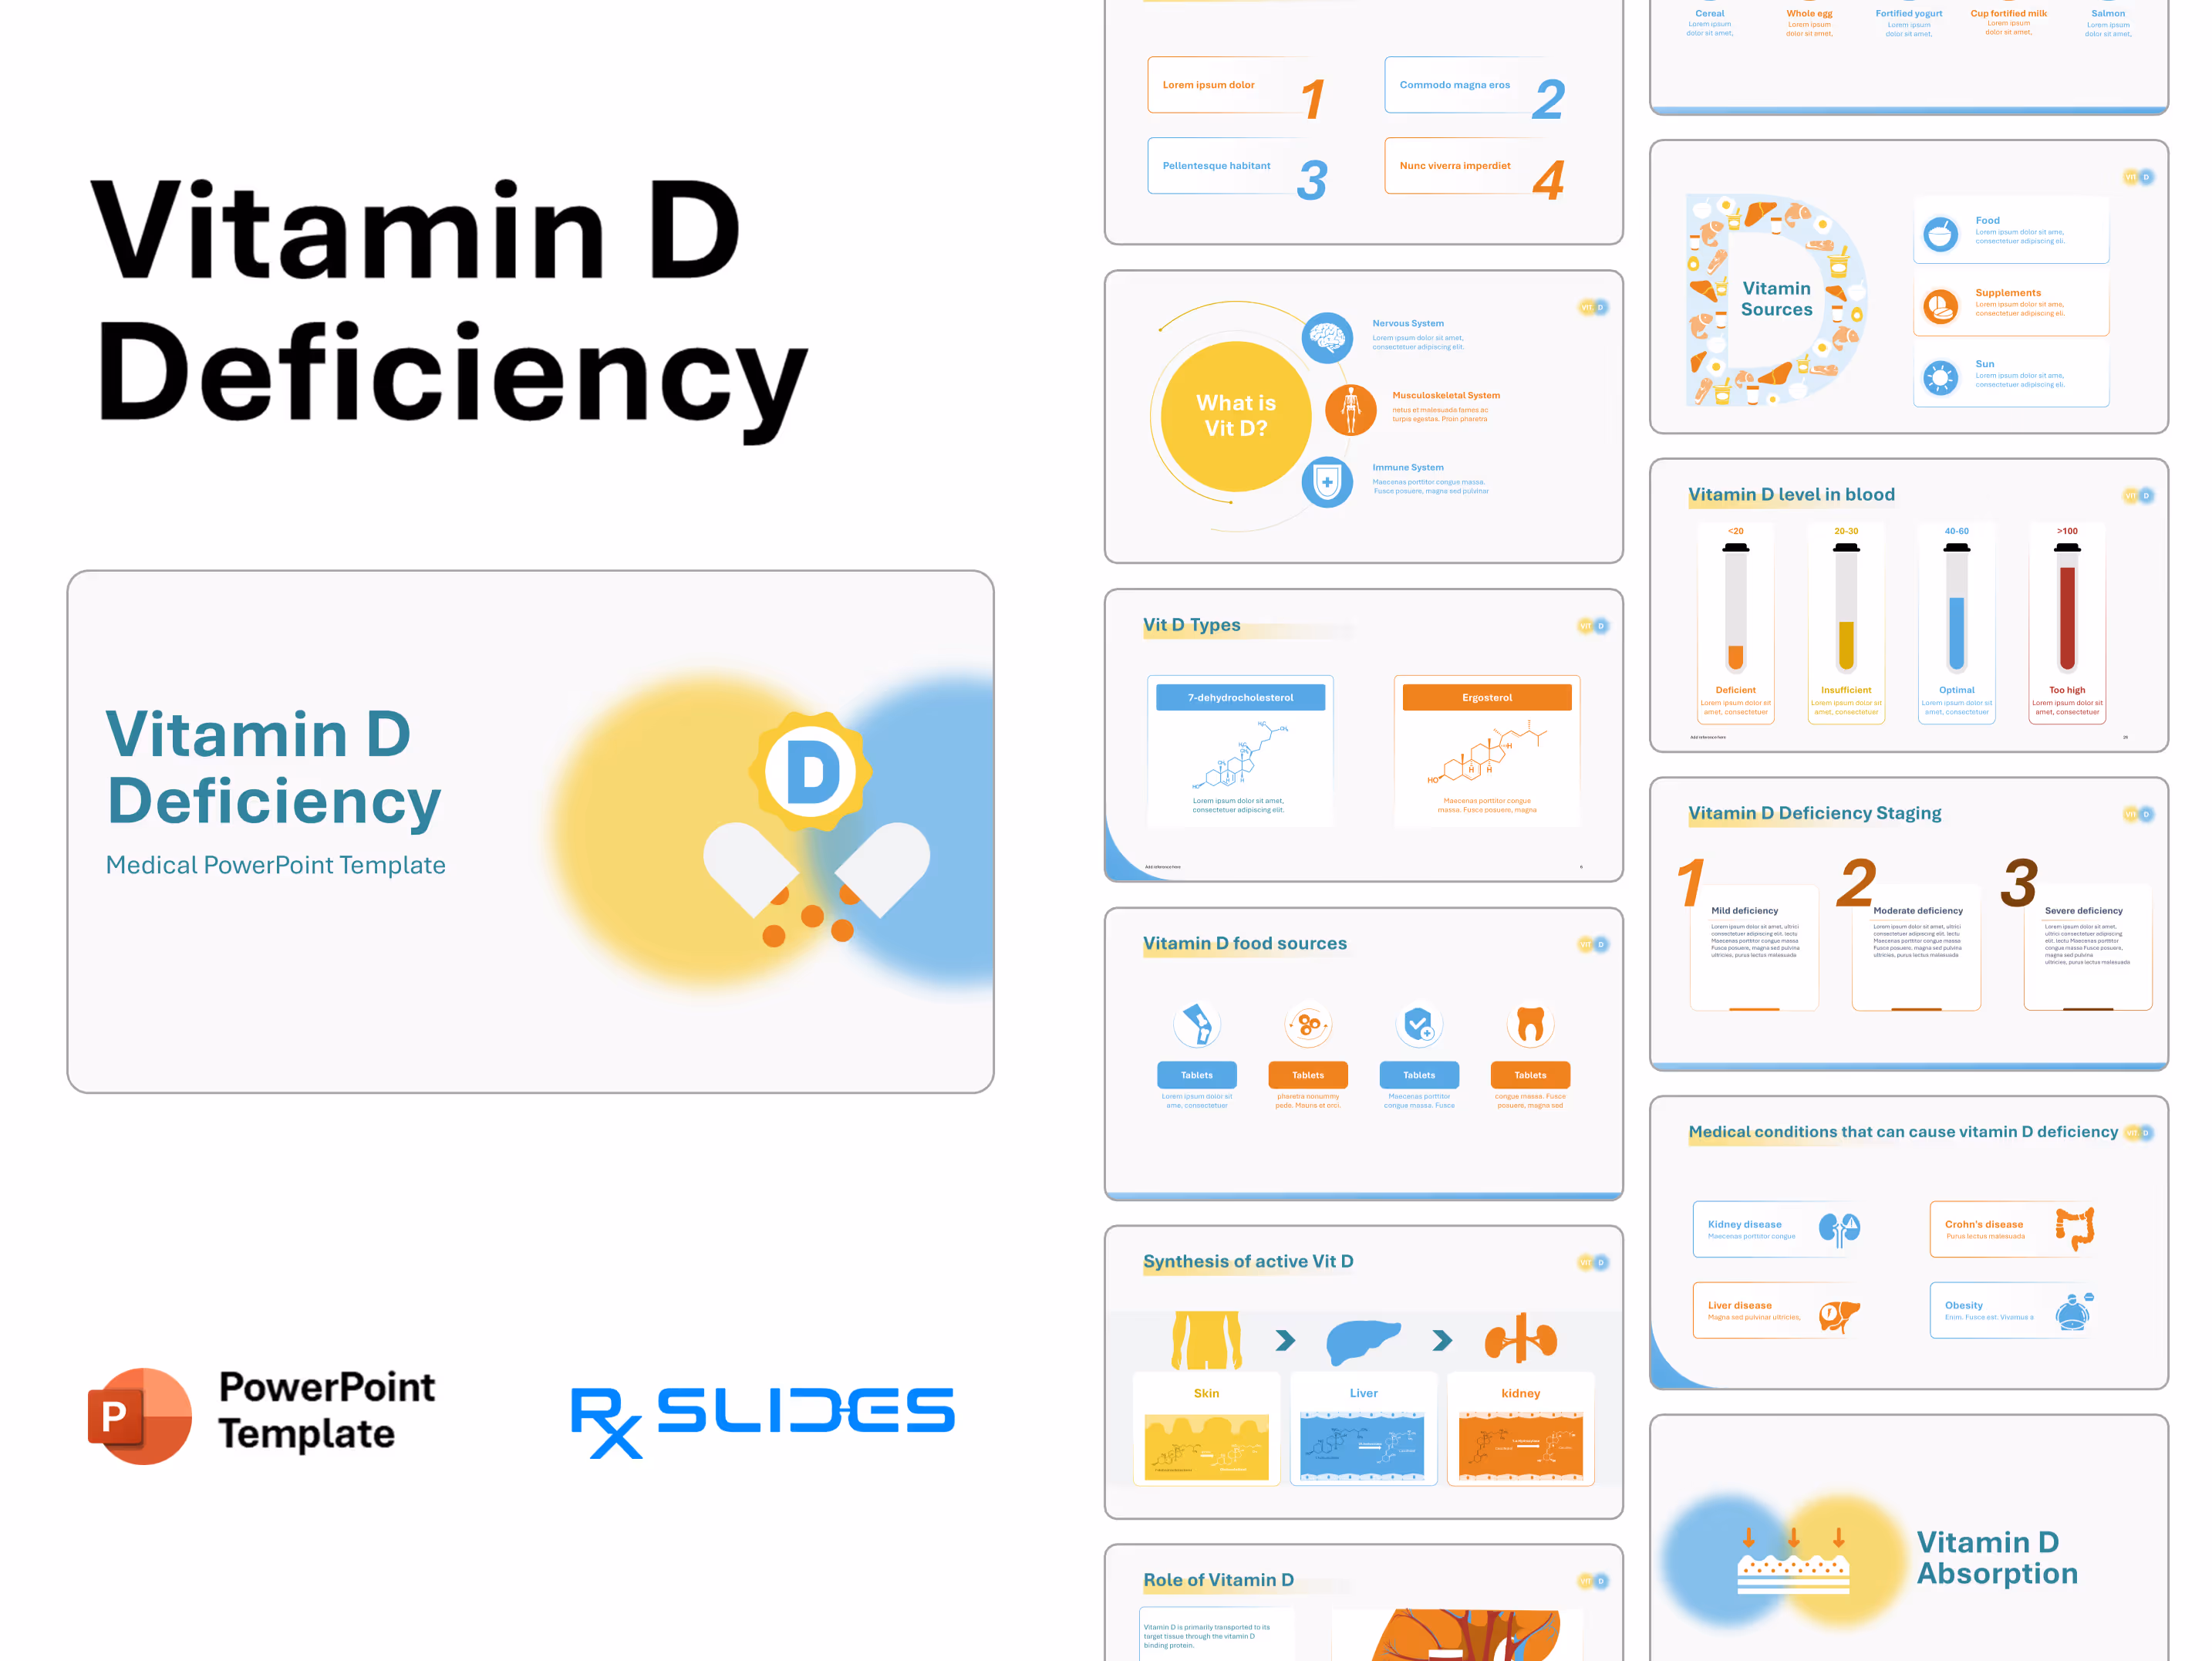
Slide 1 - Vitamin D Deficiency (Title Slide)
.avif)
- Introduces the important presentation on Vitamin D Deficiency with a professional and clean design.
- The slide features a dynamic illustration of an opened capsule and the Vitamin D seal, using sunny yellow and blue tones.
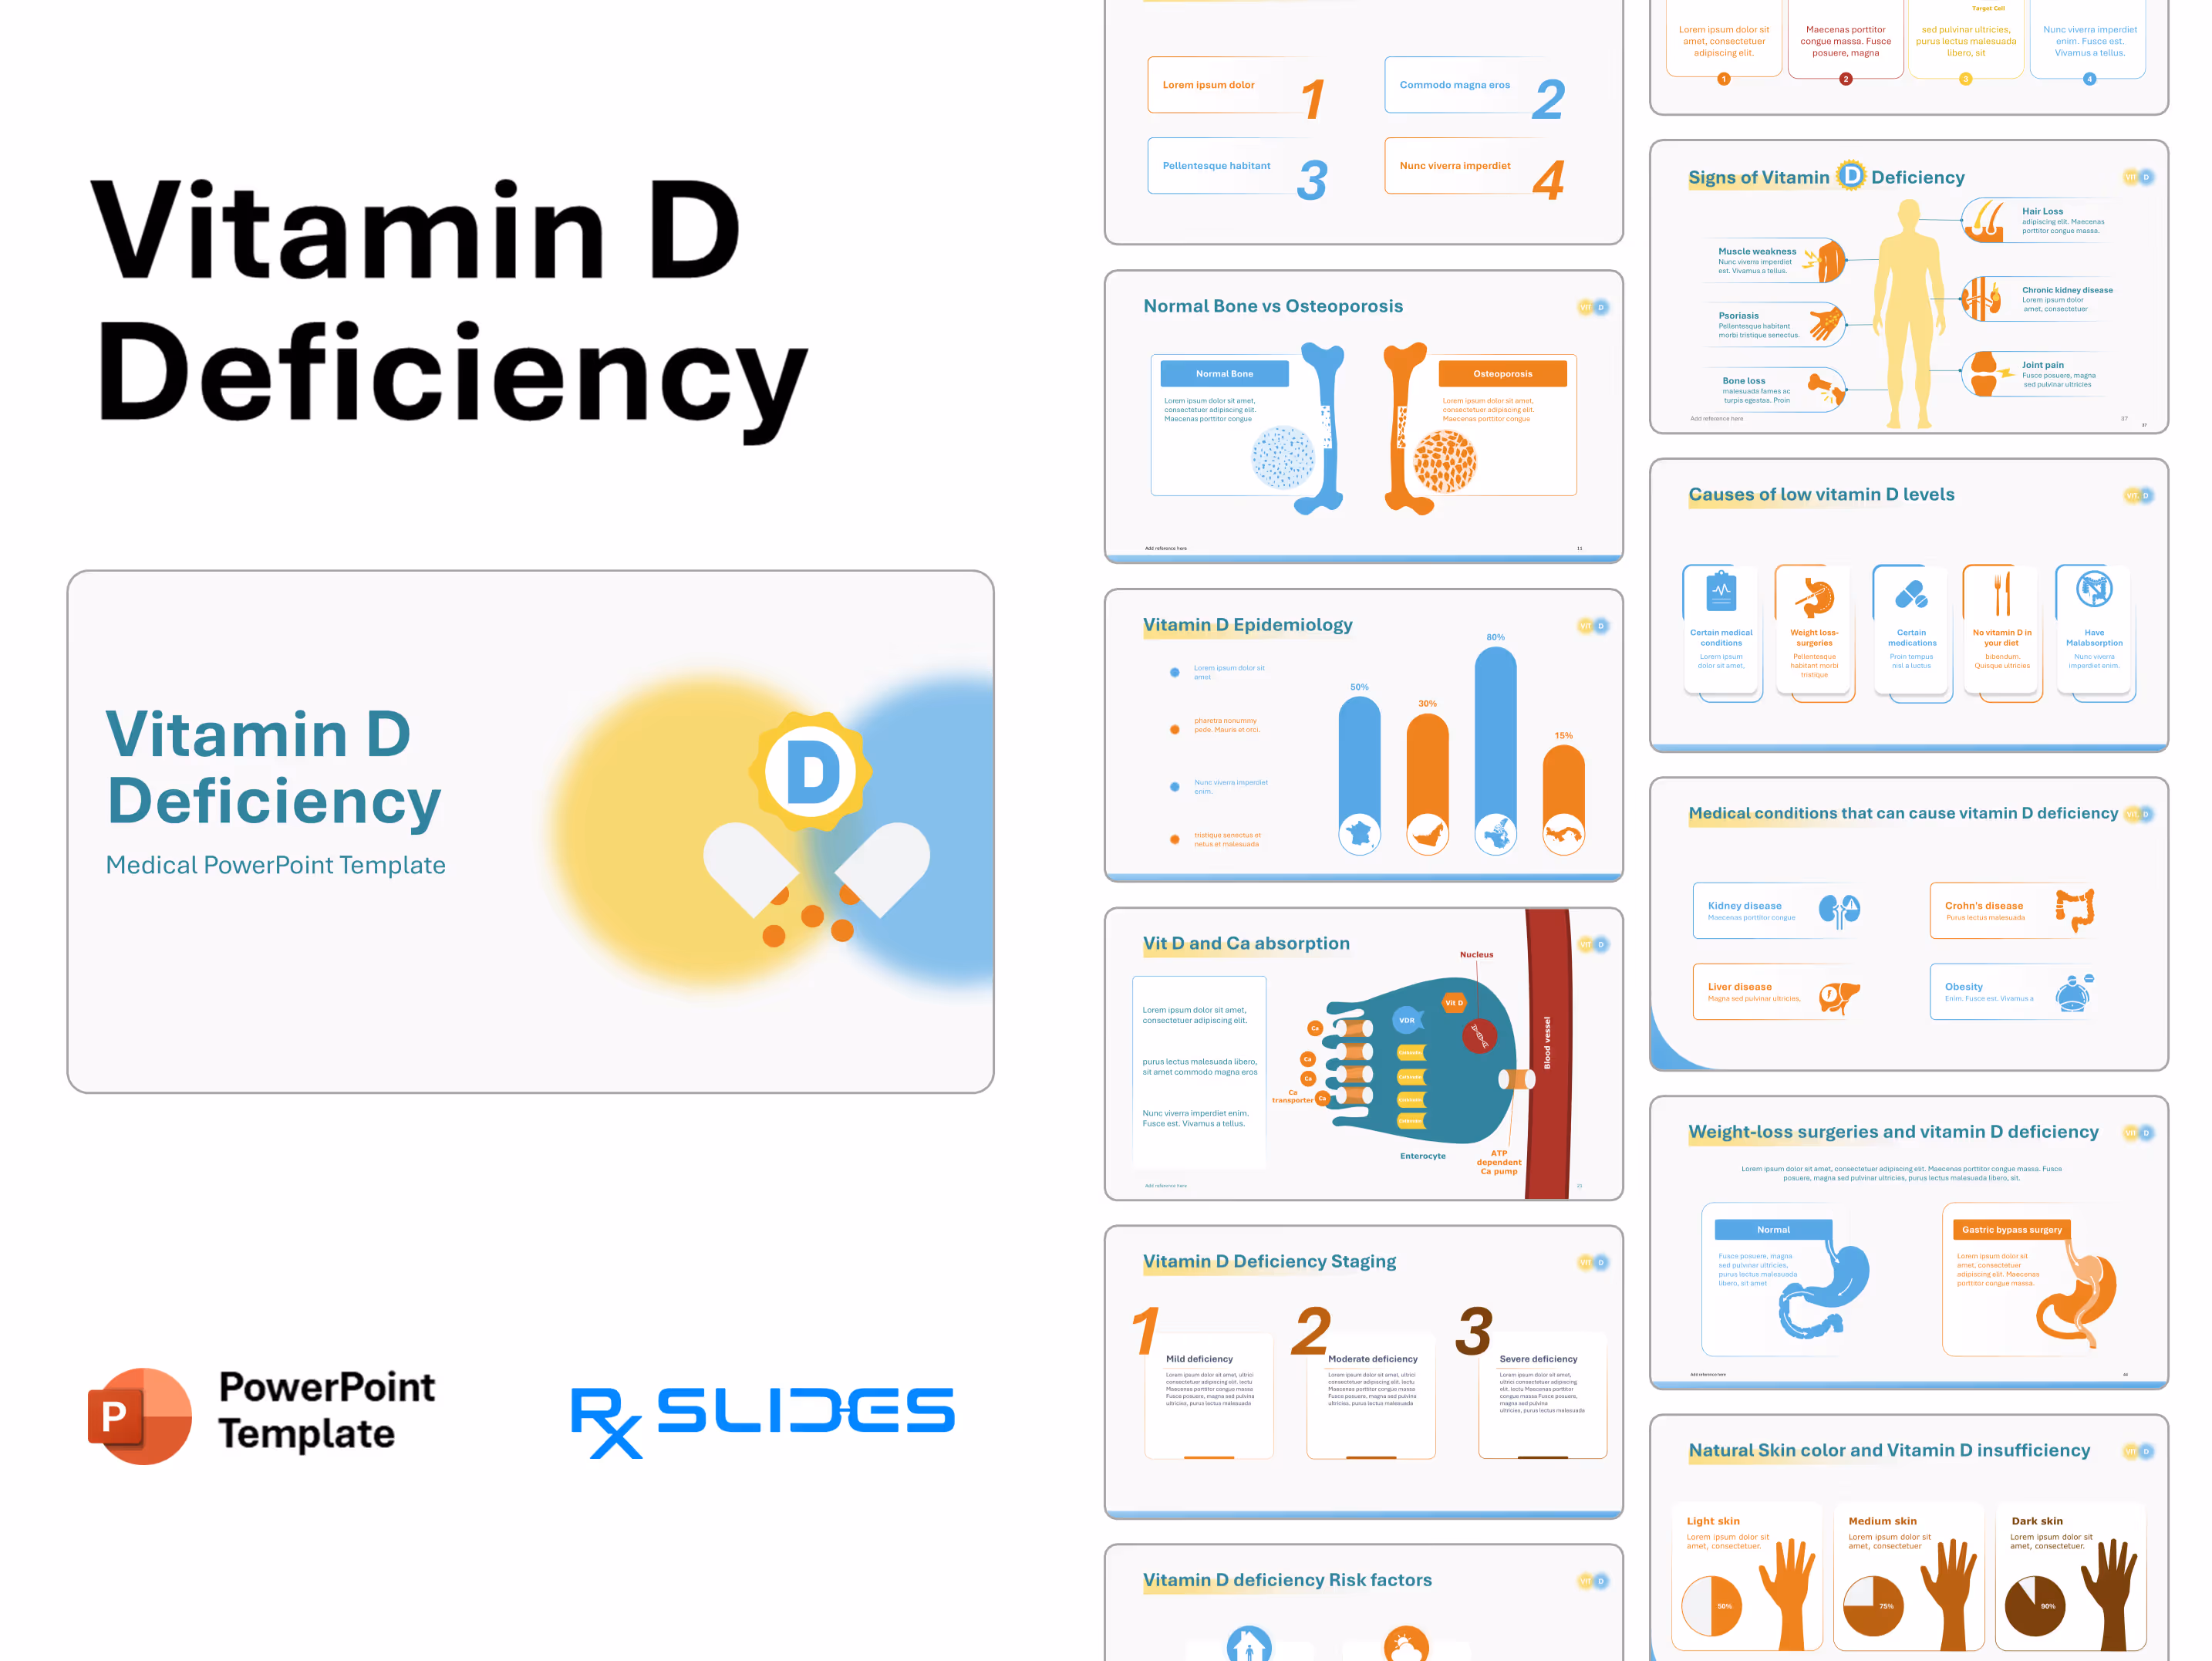
Slide 2 - Table of Content (Navigation)
.avif)
- Structures the presentation into four key sections.
- The clean layout features numbered boxes in the template's signature orange and blue, offering high readability and an engaging, modern visual style.
Slide 3 - Introduction to Vit D (Function Detail)
.avif)
- Introduces the three major roles of Vitamin D, visually explaining its benefits for key body systems.
- The design uses three distinct icons representing the Nervous, Immune, and Musculoskeletal Systems.
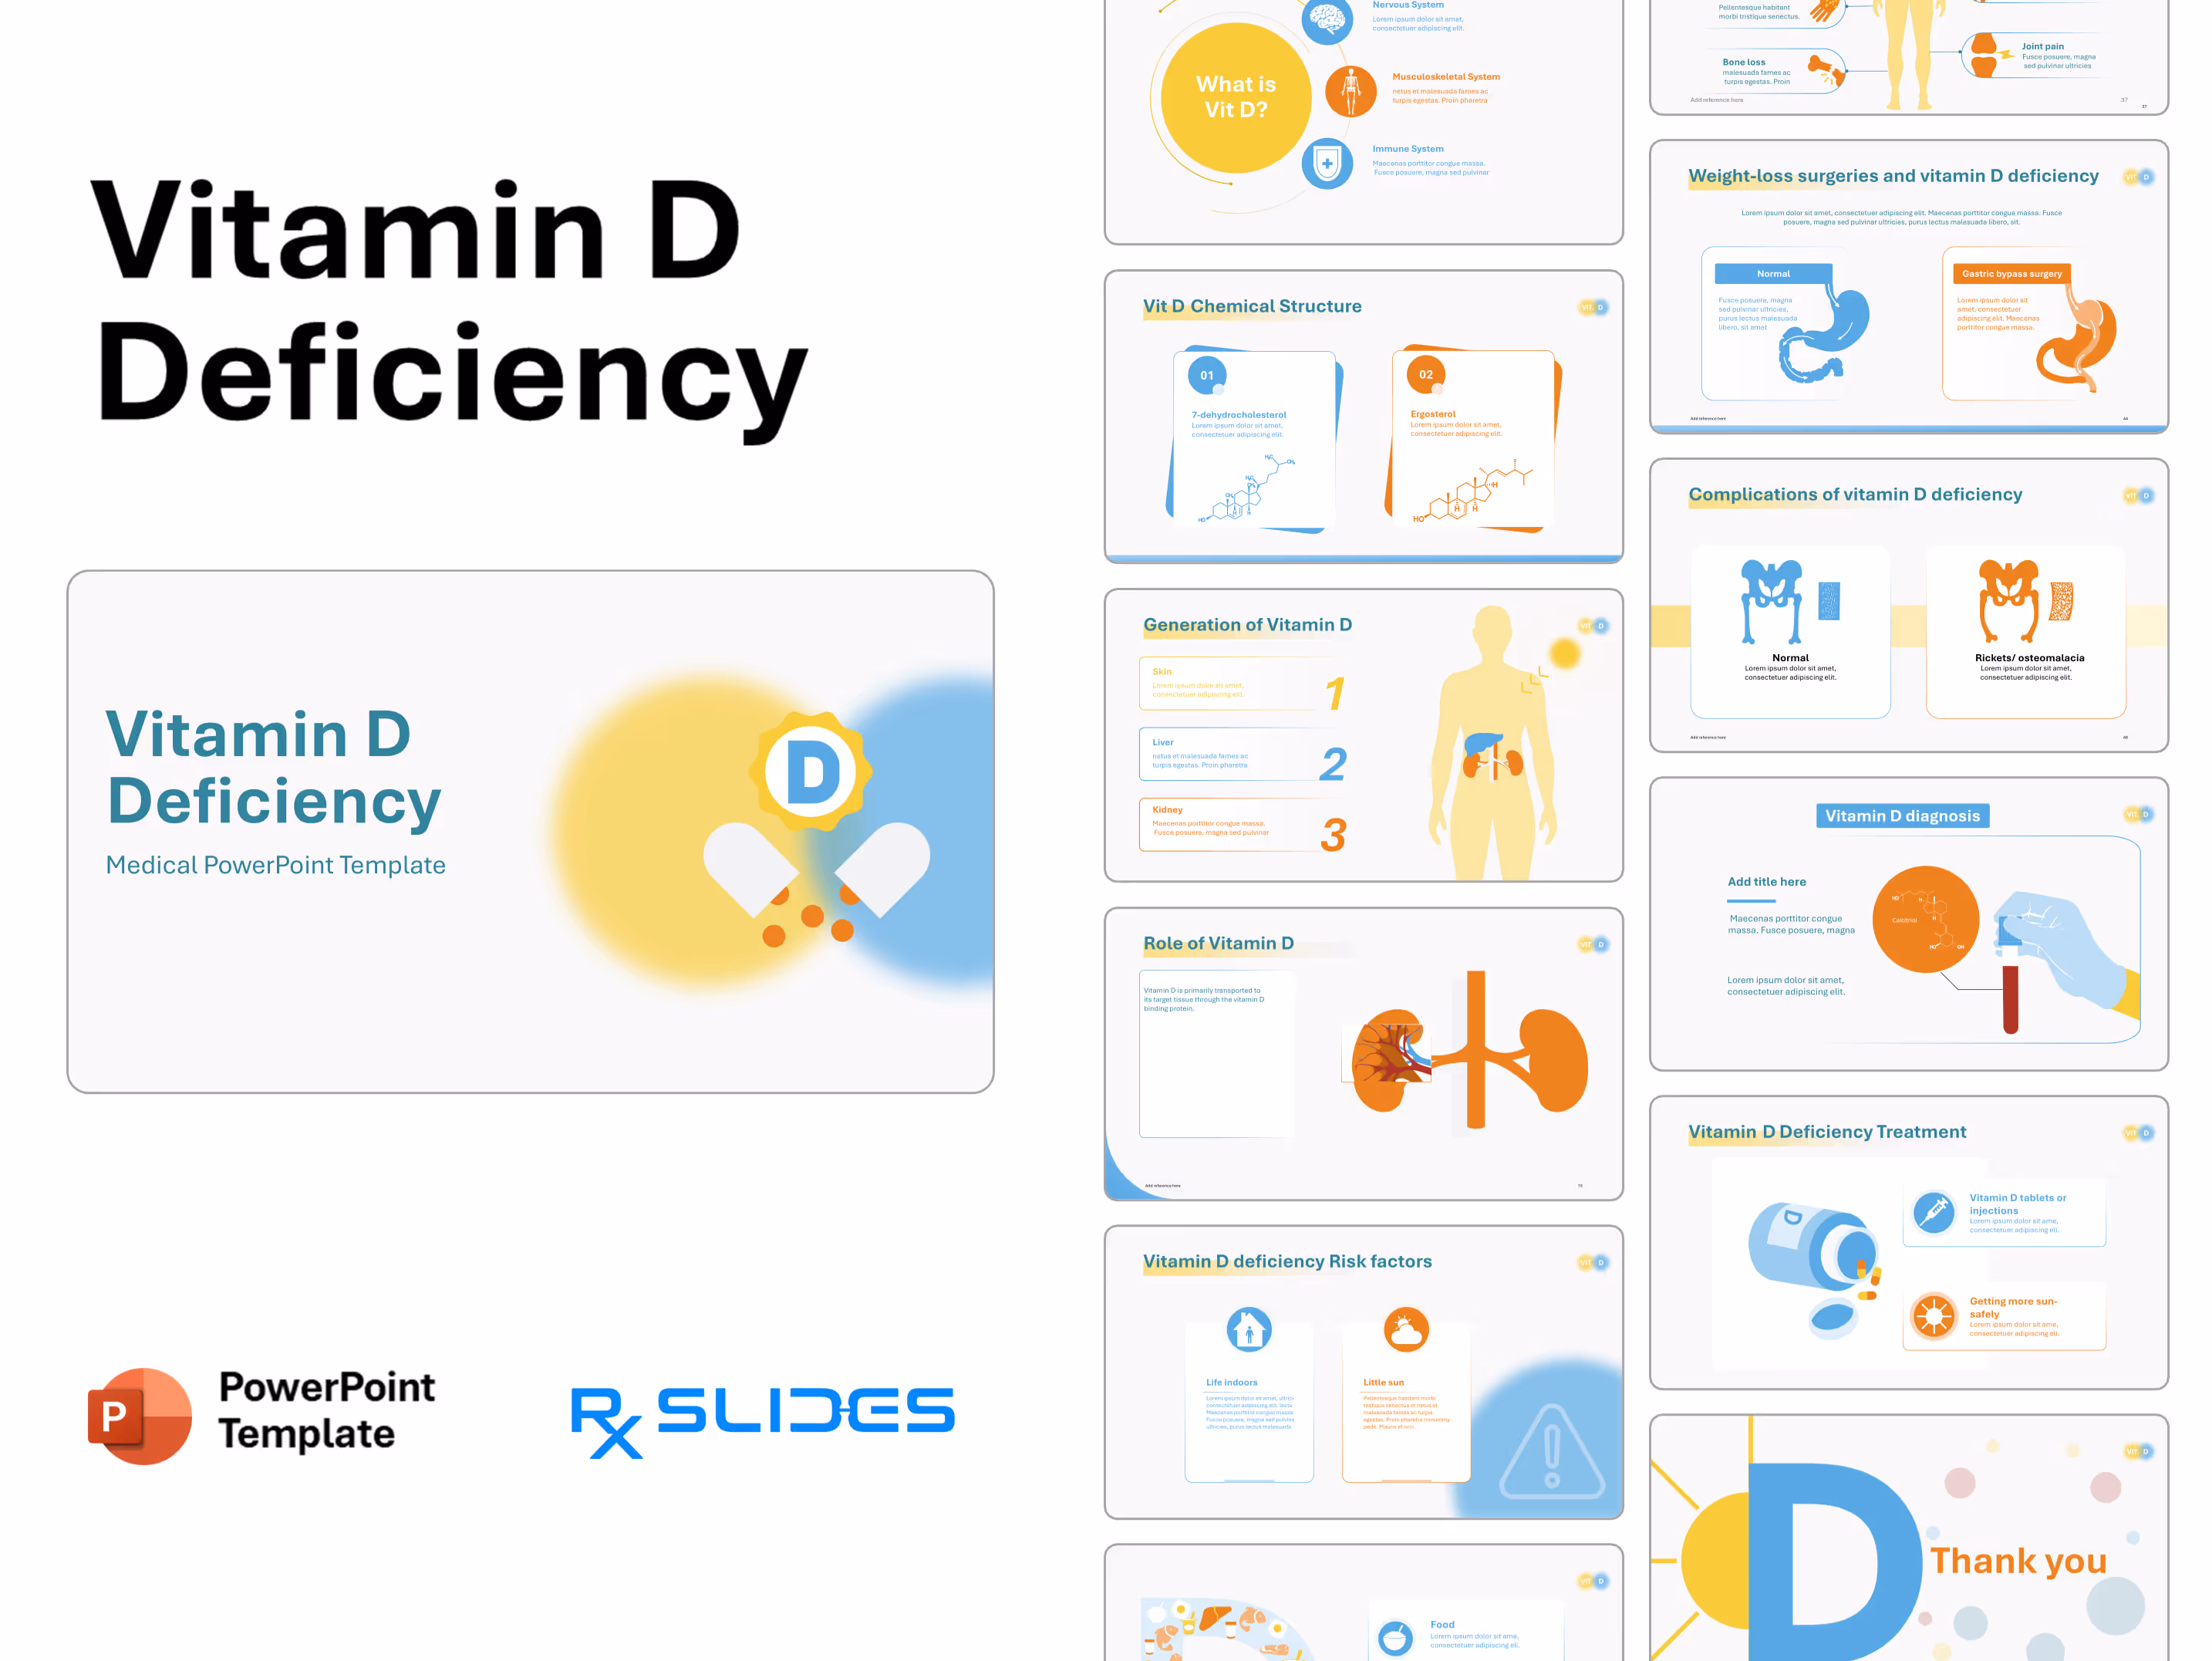
Slide 4 - What is Vit D? (Key Functions Summary)
.avif)
- Answers the core question "What is Vit D?".
- The layout features a large yellow circle emphasizing the question, with three supporting icons that neatly summarize the key impact areas: Nervous, Musculoskeletal, and Immune Systems.
Slide 5 - Vitamin D Types (Chemical Structure)
.avif)
- Introduces the chemical foundation of Vitamin D types.
- The design is dominated by a large, clear illustration of the steroid-like molecular structure with yellow and blue background theme.
Slide 6 - Vit D Types (Molecular Comparison)
.avif)
- Presents the two major forms of Vitamin D precursors: 7-dehydrocholesterol and Ergosterol.
- The layout uses two adjacent, color-coded boxes (blue and orange) to display the unique chemical structures side-by-side.
Slide 7 - Vit D Chemical Structure (Detail View)
.avif)
- Provides detailed information on the two essential Vitamin D precursors, 7-dehydrocholesterol and Ergosterol.
- The design uses two distinct, numbered cards with floating borders.
Slide 8 - Vitamin D Functions (Section Title)
.avif)
- Section divider slide to transmit to topic of Vitamin D Functions.
- The slide features graphic of cells rotating between the blue and yellow gradients.
Slide 9 - Vitamin D Food Sources (Detail Icons)
.avif)
- Details the various food sources and supplements that provide Vitamin D, using a structured four column layout.
- The design shows four distinct medical icons above large, contrasting text boxes.
Slide 10 - Benefits of Vitamin D (Key Advantages)
.avif)
- Details the four major Benefits of Vitamin D, focusing on areas like bone strength, immunity, and cellular health.
- The design uses four distinct medical icons, each paired with a color-coded text box.
Slide 11 - Normal Bone vs Osteoporosis (Comparison)
.avif)
- Demonstrates the difference between Normal Bone structure and the effects of Osteoporosis.
- The slide features side-by-side bone illustrations, using color-coded close-up views.
Slide 12 - Synthesis of active Vit D (Process Flow)
.avif)
- Maps out the three-step process of Vitamin D activation in the body, from initial precursor to its active form.
- The design illustrates the flow from Skin to Liver to Kidney, detailing the chemical structures and organ icons involved in each color-coded stage.
Slide 13 - Vitamin D Formation (Flow Chart)
.avif)
- Shows intuitive flow chart slide to clearly map out the process of Vitamin D formation across the body, from initial exposure to the final active state.
- The design organizes the steps into three color-coded boxes—Skin, Liver, and Kidney—showing the transformation of compounds alongside a subtle, relevant human figure illustration.
Slide 14 - Generation of Vitamin D (Numbered Steps)
.avif)
- Details the three step Generation of Vitamin D process, emphasizing the role of the Skin, Liver, and Kidney.
- The vertical layout features large numbers (1, 2, 3) and color-coded boxes that directly correspond to the organs illustrated on the adjacent human figure graphic.
Slide 15 - Role of Vitamin D (Kidney Detail)
.avif)
- Highlights the Role of Vitamin D, illustrating the critical function of the kidney in its action or transport.
- The design features a large, striking illustration of the kidneys with a magnified inset.
Slide 16 - Role of Vitamin D (Magnified Detail)
.avif)
- Focuses on the intricate vascular detail within the kidney, clearly illustrating the mechanics of Vitamin D transport and activation.
- The design features a large, detailed cross-section of the organ with red and blue vessels.
Slide 17 - Role of Vitamin D (Transport Mechanism)
- Illustrates how Vitamin D is transported through the bloodstream to reach its target tissues in the body.
- The design features a compelling close-up graphic of a blood vessel, highlighting the Vitamin D molecule bound to a Binding Protein for clear mechanistic explanation.
Slide 18 - Role of Vitamin D (Cellular Action)
.avif)
- Explains the final step: how Vitamin D enters a Target Cell and binds to its receptor to trigger biological action.
- The design features a compelling diagram of the cell, showing the release of active Vitamin D from its carrier and its subsequent binding near the nucleus (VDR).
Slide 19 - Role of Vitamin D (Gene Expression)
.avif)
- Illustrates how activated Vitamin D influences gene expression by binding to DNA and altering protein synthesis.
- The design features a compelling graphic showing the activated hormone (1,25 D) and its receptor (VDR) interacting near a large, clear illustration of the DNA helix and mRNA.
Slide 20 - Role of Vitamin D (Four-Step Summary)
.avif)
- Reviews the entire four-step action of Vitamin D, from organ involvement to genetic regulation.
- The design organizes the complex process into four distinct, numbered cards, visually detailing transport, cell entry, and the final impact on DNA/mRNA.
Slide 21 - Vit D and Ca absorption (Cellular Mechanism)
.avif)
- Illustrates the crucial mechanism of Vitamin D enhancing Calcium absorption at the cellular level within the intestine.
- The design features a detailed graphic of an Enterocyte, showing the roles of the Vitamin D receptor (VDR), Calbindin, and the Calcium pump for professional clarity.
Slide 22 - Vitamin D Epidemiology (Section Title)
.avif)
- Section divider slide to smoothly transition the audience to the crucial topic of Vitamin D Epidemiology and prevalence data.
- The slide features a prominent bar chart graphic with a sharply rising orange arrow, symbolizing growth and the need to analyze trends and statistics.
Slide 23 - How common is vitamin D deficiency? (Global Statistic)
.avif)
- Answer the question of how common vitamin D deficiency is?
- The design pairs a clear, alarming statistic (e.g., "1 in 8 people worldwide") with a compelling globe graphic surrounded by figures, highlighting prevalence.
Slide 24 - Vitamin D Epidemiology (Regional Data)
.avif)
- Presents regional statistics on Vitamin D deficiency.
- The design features four color-coded bars, each with a specific country silhouette beneath it and a corresponding percentage above.
Slide 25 - Vitamin D Epidemiology (Demographic Comparison)
.avif)
- You can use this dynamic comparison slide to clearly present differences in Vitamin D data across two demographics, such as gender (male vs. female) or age groups.
- The design features two prominent doughnut charts, color-coded orange and blue, with large percentage indicators and corresponding male and female figures.
Slide 26 - Vitamin D Level in Blood (Status Chart)
.avif)
- Defines and categorize the four states of Vitamin D levels in the blood, from Deficient to Too High.
- The design features four color-coded test tubes, visually linking ranges (e.g., <20 to >100) to status labels (e.g., Insufficient, Optimal).
Slide 27 - Vitamin D Stages (Section Title)
.avif)
- Section divider slide to transmit to topic of Vitamin D Stages or the phases of deficiency/treatment.
- The design features the prominent orange Vitamin D sun seal set against the signature yellow and blue gradients.
Slide 28 - Vitamin D Deficiency Staging (Progression View)
.avif)
- Illustrates the three stages of Vitamin D Deficiency, from Mild to Severe impact.
- The design features a large bone graphic shading from light orange to dark brown.
Slide 29 - Vitamin D Deficiency Staging (Detailed Columns)
.avif)
- Outlines the detailed differences between the three stages of Vitamin D Deficiency: Mild, Moderate, and Severe.
- The design utilizes three large, numbered columns to provide ample space for detailed text.
Slide 30 - Vitamin D Deficiency Risk Factors (Section Title)
.avif)
- Section divider slide to transmit to Vitamin D Deficiency Risk Factors.
- The slide prominently features a large caution sign icon.
Slide 31 - Vitamin D Deficiency Risk factors (Key Comparison)
.avif)
- Details two major Vitamin D deficiency risk factors: Life indoors and Little sun exposure.
- The design uses two color-coded cards with distinct icons (house/person and sun/cloud) .
Slide 32 - Vitamin D Deficiency Risk Factors (Central Focus)
.avif)
- Details two major Vitamin D deficiency risk factors with the topic centered for maximum impact.
- The design places the title "Vitamin D deficiency risk factors" in a central bubble.
Slide 33 - Vitamin D Sources (Section Title)
.avif)
- Section divider slide to transmit to Vitamin D Sources.
- The slide features a prominent sun icon set against the signature yellow and blue gradients.
Slide 34 - Vitamin Sources (Three Pathways)
.avif)
- Outlines the three major pathways for getting Vitamin D: Food, Supplements, and Sun.
- The design organizes the information around a large 'D' graphic made of food icons, with three color-coded boxes detailing each source with its relevant icon.
Slide 35 - Vitamin D Reservoirs (Three Sources)
.avif)
- Outlines the three major Reservoirs (Sources) of Vitamin D: Food, Supplements, and Sun.
- The design uses a central blue bubble to highlight the topic, with three large, color-coded horizontal cards detailing each source with its relevant icon.
Slide 36 - Vitamin D Deficiency Symptoms (Section Title)
.avif)
- Section divider slide to transmit to Vitamin D Deficiency Symptoms.
- The slide prominently features an illustration of a fractured bone, set against the blue and yellow gradients.
Slide 37 - Signs of Vitamin D Deficiency (Detailed View)
.avif)
- Details six key Signs of Vitamin D Deficiency, including physical symptoms and related disease states.
- The design features a central human silhouette connected by lines to six color callouts.
Slide 38 - Effects of low vitamin D (Key Symptoms)
.avif)
- Details six common Effects of low vitamin D, ranging from Mood changes to Bone loss.
- The design uses six color-coded, icon-driven callouts, allowing you to highlight various physical and emotional symptoms of the deficiency in an organized grid.
Slide 39 - Hypovitaminosis D (Symptoms Cycle)
.avif)
- Details five key symptoms of Hypovitaminosis D (Vitamin D Deficiency).
- The design places the five blue and orange icon symptoms (e.g., Bone pain, Decreased performance, weak immune system, periodontal disease and Fatigue) in a circle.
Slide 40 - Vitamin D Deficiency Causes (Section Title)
.avif)
- Section divider slide to transmit to Vitamin D Deficiency Causes.
- The slide prominently features a bold graphic of the intestines crossed out, visually emphasizing malabsorption issues as a key cause of deficiency.
Slide 41 - Vitamin D Deficiency Causes (Five Categories)
.avif)
- Details five major Vitamin D Deficiency Causes.
- The design uses five distinct icons (e.g., medical chart, stomach surgery, drugs and cutlery )
Slide 42 - Causes of low vitamin D levels (Five Risk Areas)
.avif)
- Details five major Causes of low vitamin D levels, spanning diet, medication, and underlying medical conditions.
- The design uses five distinct icon cards to simplify complex issues like Malabsorption and Weight loss surgeries into easily digestible points.
Slide 43 - Medical Conditions That Cause Vitamin D Deficiency
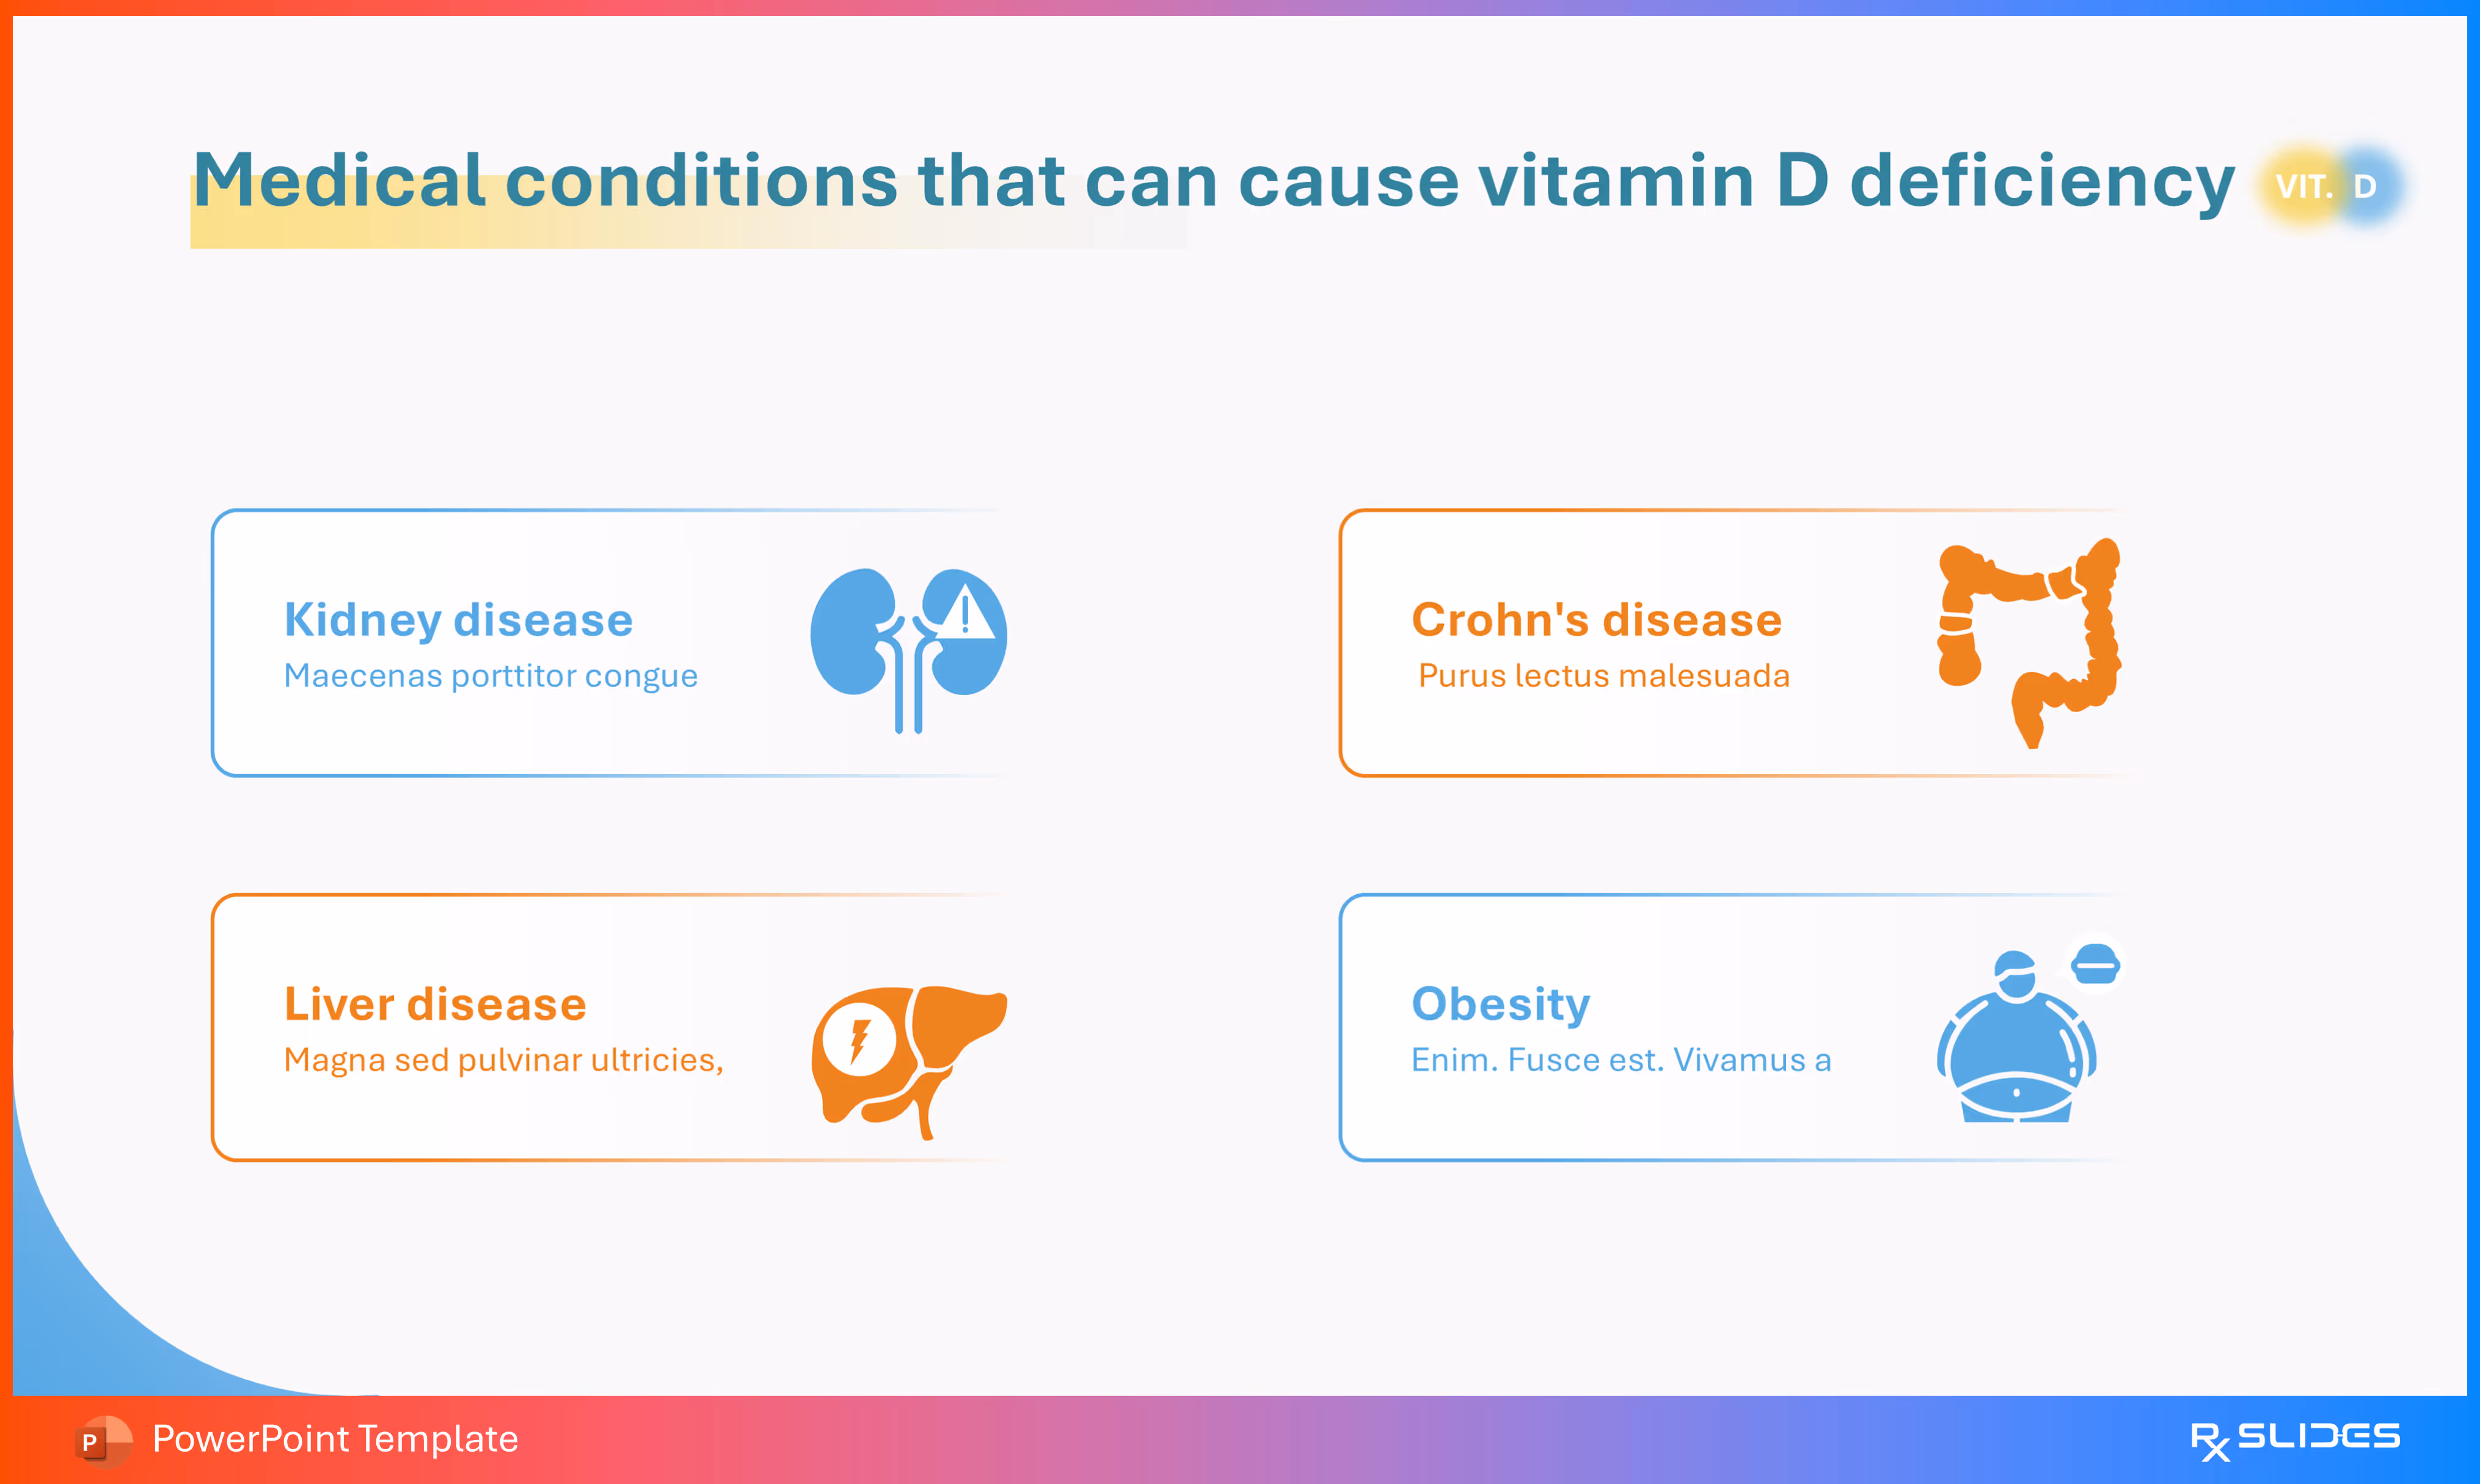
- Presents four key Medical Conditions that can lead to Vitamin D deficiency.
- The design uses four box grid with colored icons (blue and orange) to highlight conditions like Kidney disease (kidney icon), Crohn's disease (intestine icon), Liver disease (liver icon), and Obesity (person on scale icon).
Slide 44 - Weight-loss surgeries and vitamin D deficiency (Comparison)
.avif)
- Explains the link between Weight-loss surgeries and the risk of Vitamin D deficiency.
- The design contrasts a Normal stomach and digestive system diagram (blue) with the post-surgery Gastric bypass arrangement (orange).
Slide 45 - Vitamin D Food Sources (Five Key Foods)
.avif)
- A flowchart that presents five primary Vitamin D food sources.
- The design uses five linked circular icons in an orange and blue palette to highlight food sources: Cereal (bowl icon), Whole egg (yolk icon), Fortified yogurt, Cup fortified milk, and Salmon (fish icon).
Various food sources and supplements that provide Vitamin D, using a structured four-column layout.
Slide 46 - Vitamin D Absorption (Section Title)
.avif)
- Section divider slide to transmit to Vitamin D Absorption.
- The slide features a graphic of a cell layer with arrows pointing down.
Slide 47 - Natural Skin color and Vitamin D insufficiency (Pigmentation Impact)
.avif)
- Illustrates the relationship between Natural Skin Color and Vitamin D Insufficiency rates.
- The design uses three comparative hand graphics (Light, Medium, Dark) paired with pie charts.
Slide 48 - Complications of vitamin D deficiency (Rickets/Osteomalacia)
.avif)
- illustrates the severe bony complications of Vitamin D deficiency: Rickets/Osteomalacia.
- The design clearly contrasts a Normal pelvic skeleton (blue) with the skeleton affected by Rickets/Osteomalacia (orange), paired with magnified bone tissue views.
Slide 49 - Vitamin D deficiency Diagnosis (Section Title)
.avif)
- Section divider slide to transmit to Vitamin D deficiency Diagnosis.
- The slide features an illustrated human profile with a prominent brain/spinal cord icon.
Slide 50 - Vitamin D diagnosis (Testing Mechanism)
.avif)
- Illustrates the diagnostic process for Vitamin D deficiency, specifically highlighting the blood test used.
- The design features a hand holding a blood test tube next to a magnified illustration of the Calcitriol molecule.
Slide 51 - Vitamin D Diagnosis (Testing and Risk Factors)
.avif)
- outlines five major factors impacting Vitamin D status.
- The design uses five distinct icons to simplify complex issues like End-stage liver disease and Inadequate sunlight exposure.
Slide 52 - Assessment of Vitamin D Status
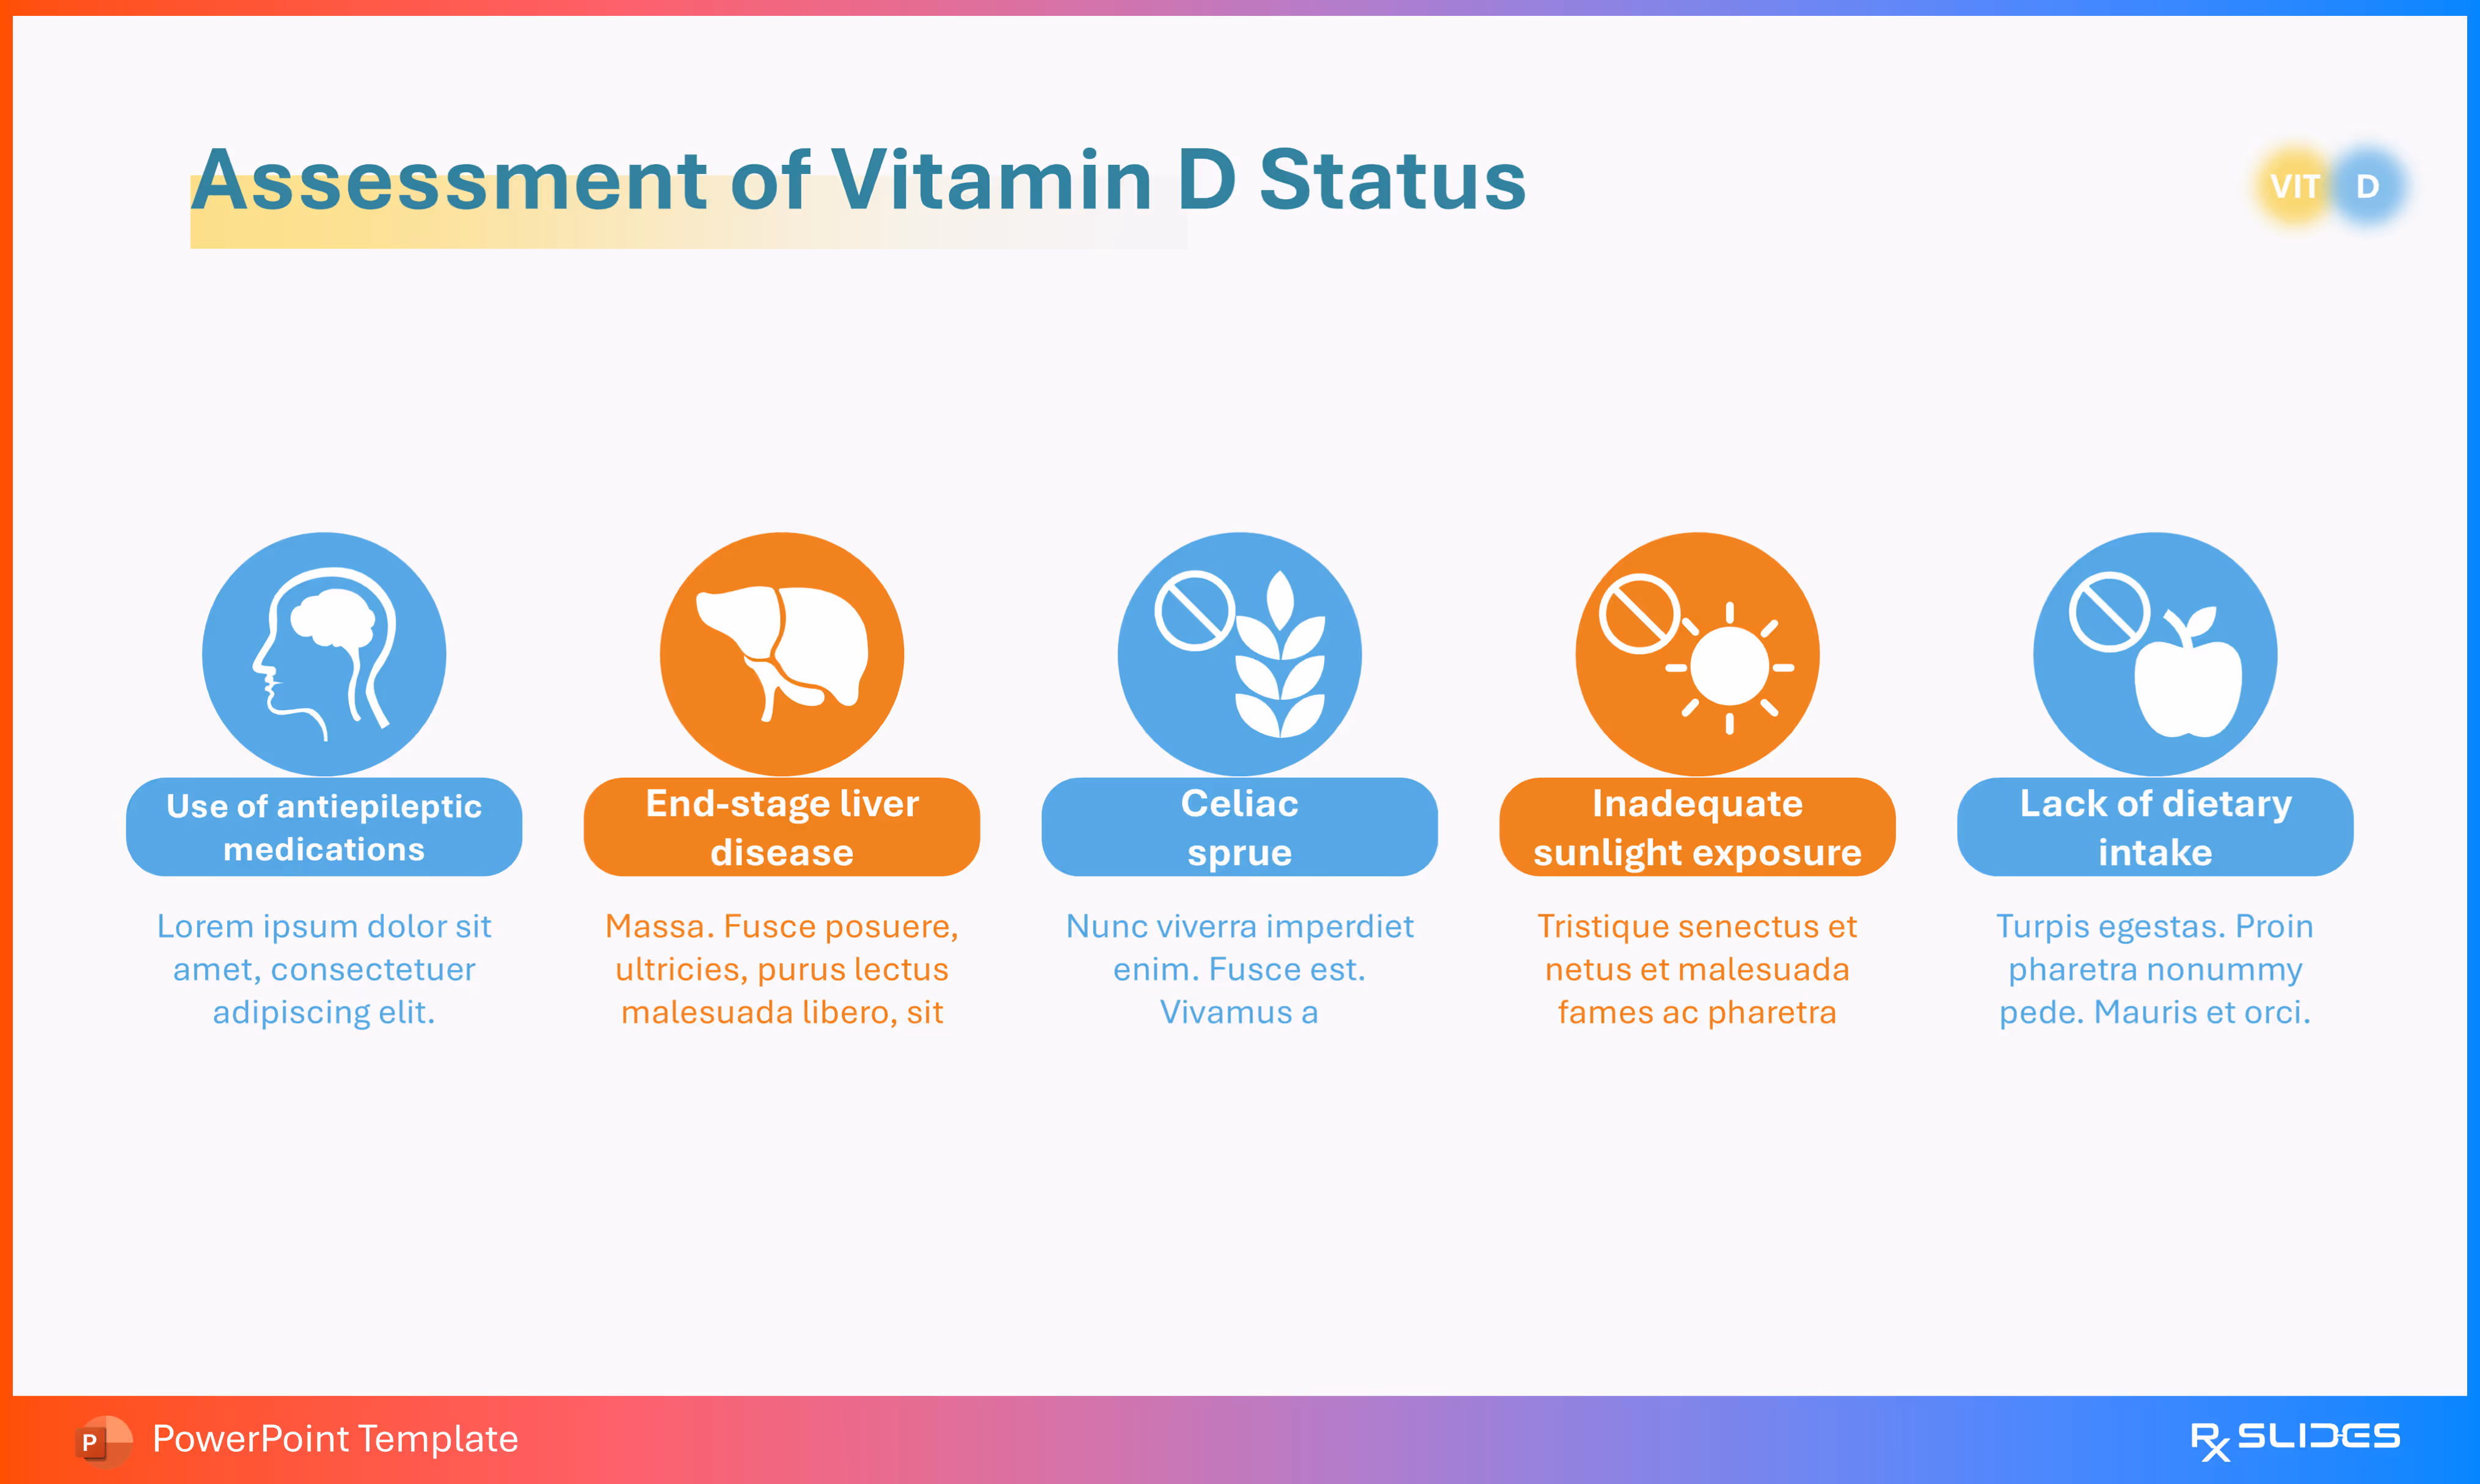
- is an alternative for slide 51
Slide 53 - Vitamin D Deficiency Treatment (Section Title)
.avif)
- section divider slide to transmit to Vitamin D Deficiency Treatment.
- The slide features a prominent orange icon of a pill bottle with capsules spilling out.
Slide 54 - Vitamin D Deficiency Treatment (Two Key Methods)
.avif)
- Outlines the two primary approaches to treating Vitamin D deficiency: Supplements/Injections and Sun Exposure.
- The design features a large visual of a pill bottle, complemented by two distinct boxes with icons for injections/tablets (syringe) and sun exposure (sun graphic).
Slide 55 - Intervention for low vitamin D (Sunlight and Supplementation)
.avif)
- Presents two primary Interventions for low Vitamin D.
- The design uses two colored boxes with large icons to highlight management approaches: one for Getting more sun safely (large sun icon in orange) and one for Vitamin D tablets or injections (large syringe icon in blue).
Slide 56 - Vitamin D Toxicity Effects (Section Title)
.avif)
- Section divider slide to transmit to Vitamin D Toxicity Effects (Hypervitaminosis D).
- The slide features an image of a muscle contracting or twitching, with orange 'lightning bolt' arrows.
Slide 57 - Acute intoxication of vitamin D (Hypervitaminosis Symptoms)
.avif)
- Details five key Acute symptoms of Vitamin D intoxication (Toxicity).
- The design uses five icons to simplify serious adverse effects like Confusion, Polyuria, Anorexia, Polydipsia, and Vomiting.
Slide 58 - Chronic intoxication of vitamin D (Long-term Effects)
.avif)
- outlines the serious, long-term consequences of chronic Vitamin D intoxication (Toxicity).
- The design uses two distinct, numbered boxes with icons to highlight major issues: Nephrocalcinosis (kidney icon) and Bone pain (damaged joint icon).
Slide 59 - Thank you (Closing Slide)
.avif)
- Ends the presentation with a clear "Thank you".
- The design features a large, stylized blue 'D' next to a yellow sun graphic.
Features of the Template
- 100% editable PowerPoint template.
- Editable colors, you can change according to your presentation style and company branding guidelines.


.avif)