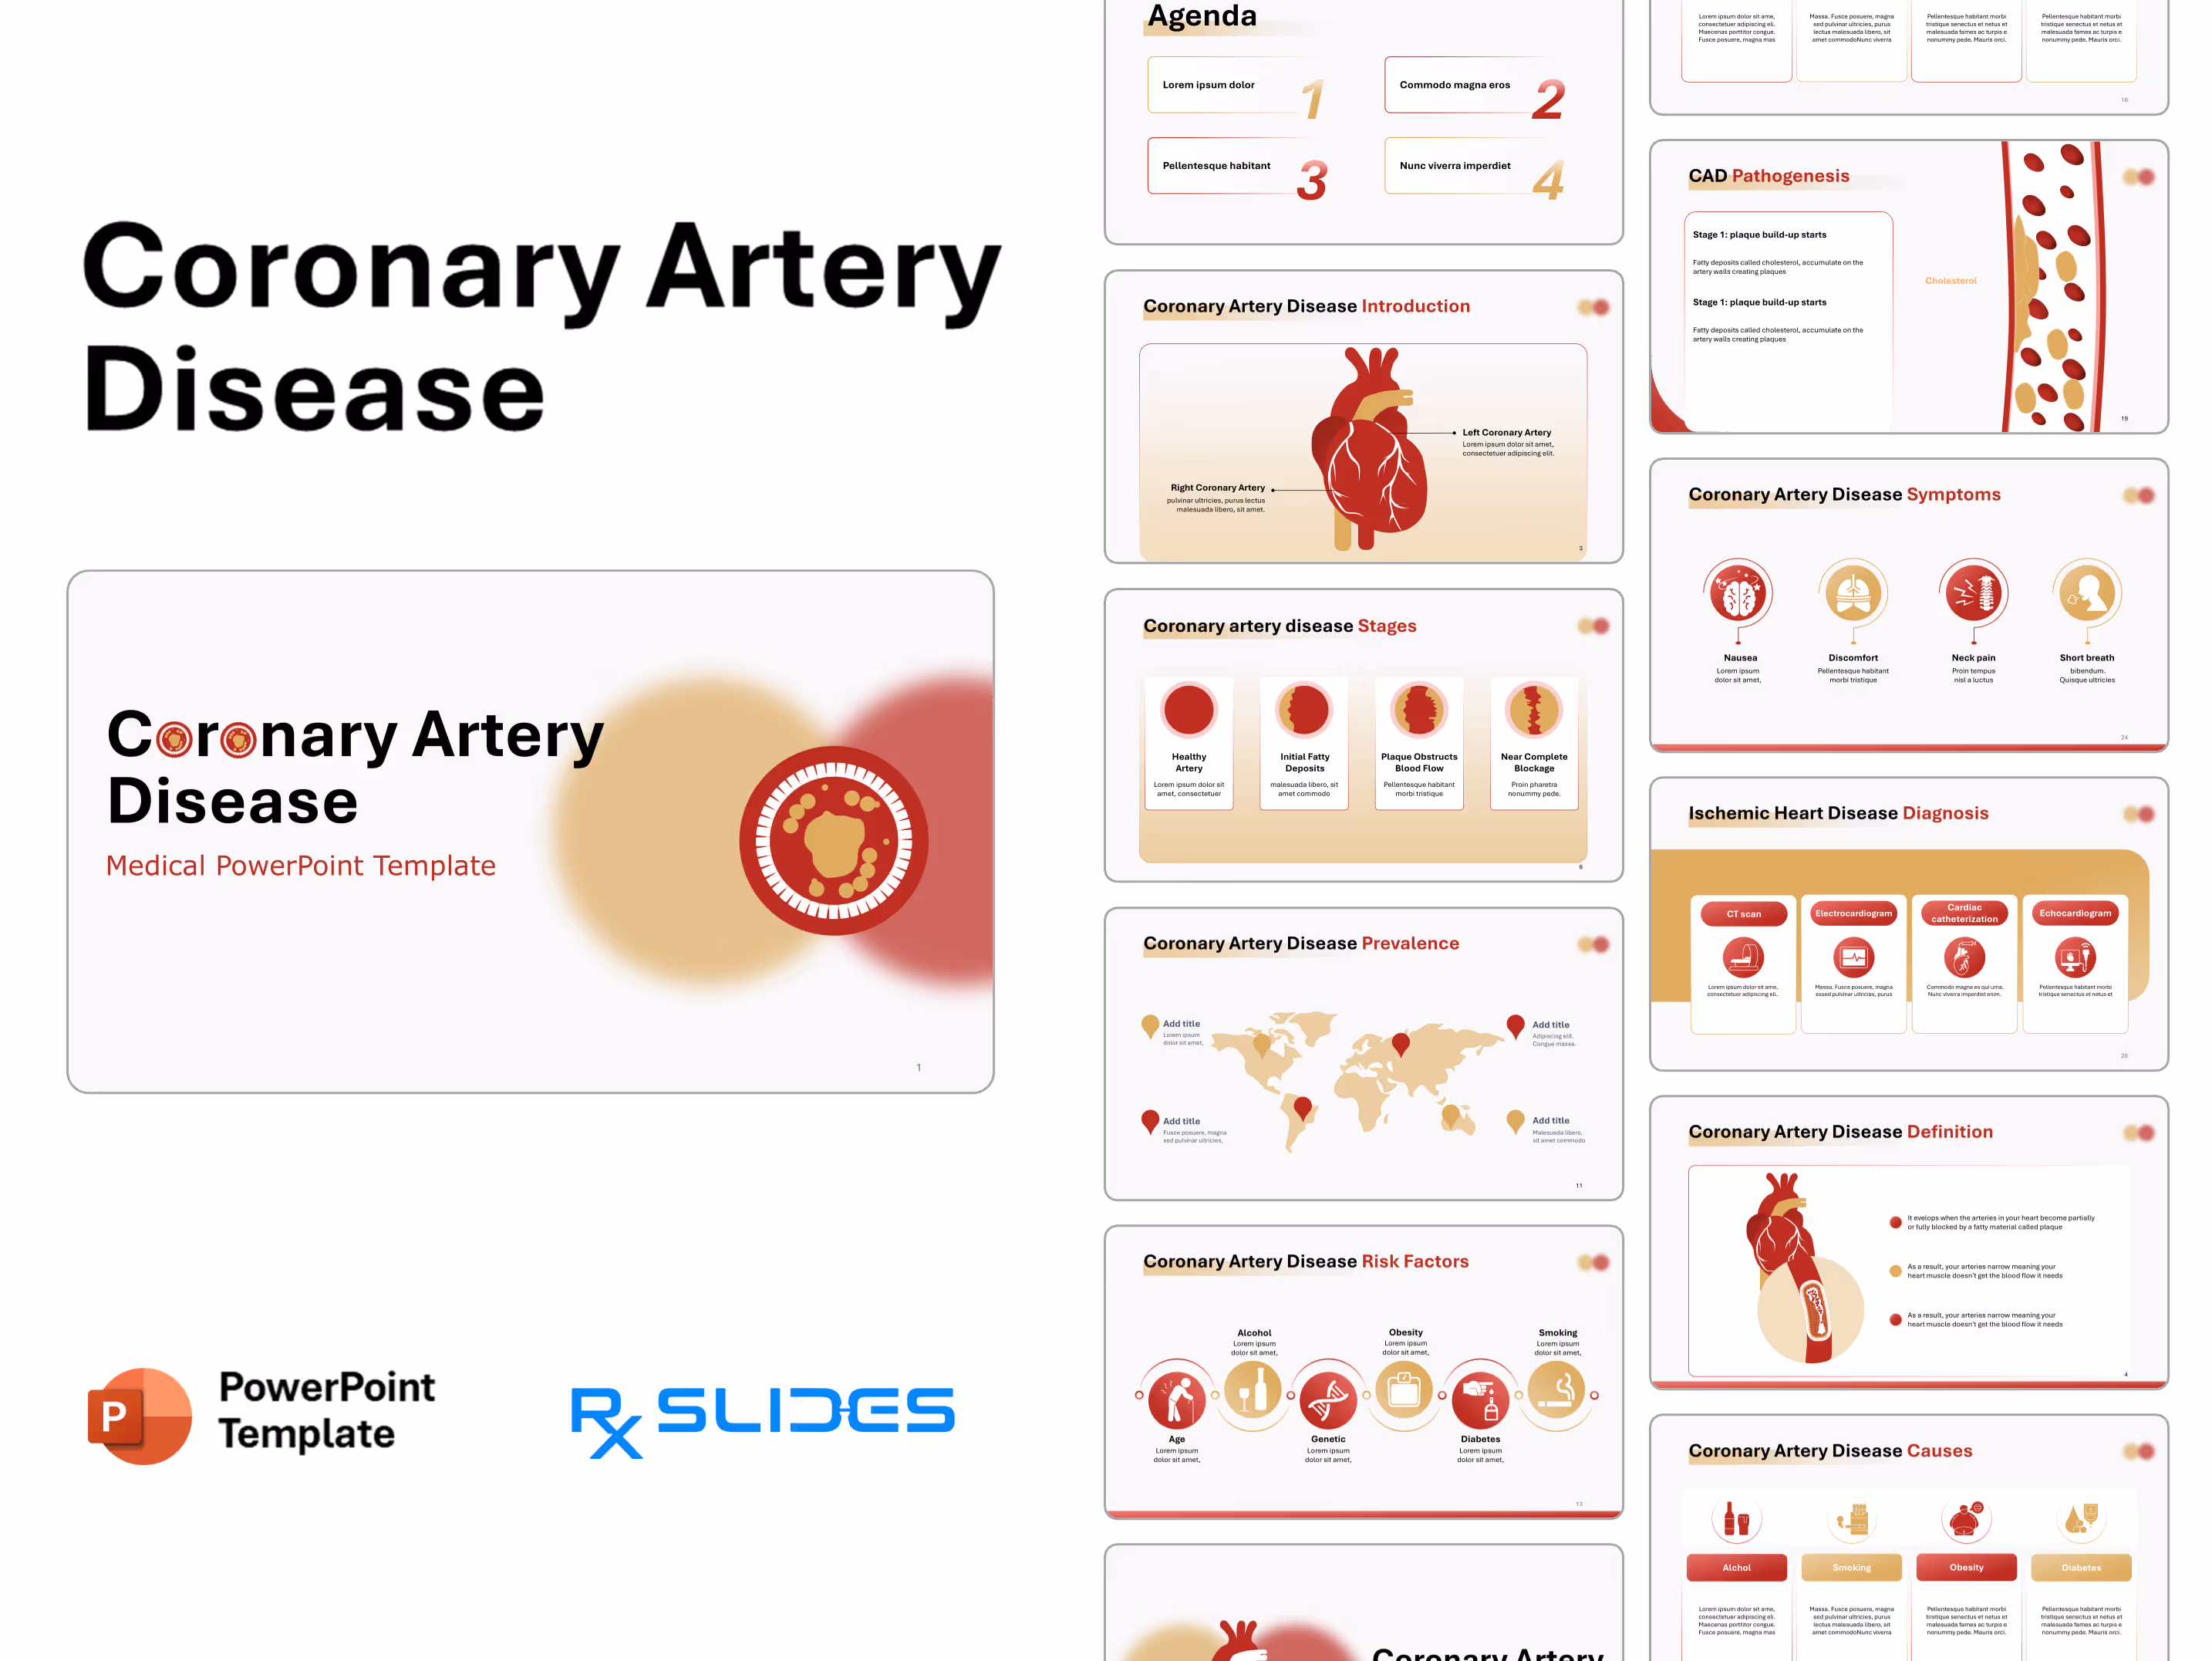
Coronary Artery Disease PowerPoint Template
No items found.
Coronary Artery Disease Presentation: Medical PowerPoint Template
- The Coronary Artery Disease PPT template is an animated medical PowerPoint presentation that will help you explore the full potential of your presentation.
- RxSlides medical presentation templates include medical animations and infographics that will attract your audience.
- You can use our demonstrated infographics to present a dynamic and appealing coronary artery disease for medical professionals or patient education purposes.
- Take your cardiology presentations from traditional static to engaging with our library of animated Cardiac PowerPoint Templates and impress your audience with dynamic visuals to enhance understanding and retention.
Coronary Artery Disease PowerPoint Template Preview
Coronary Artery Disease PowerPoint Template Content
Slide 1 - Cover Slide
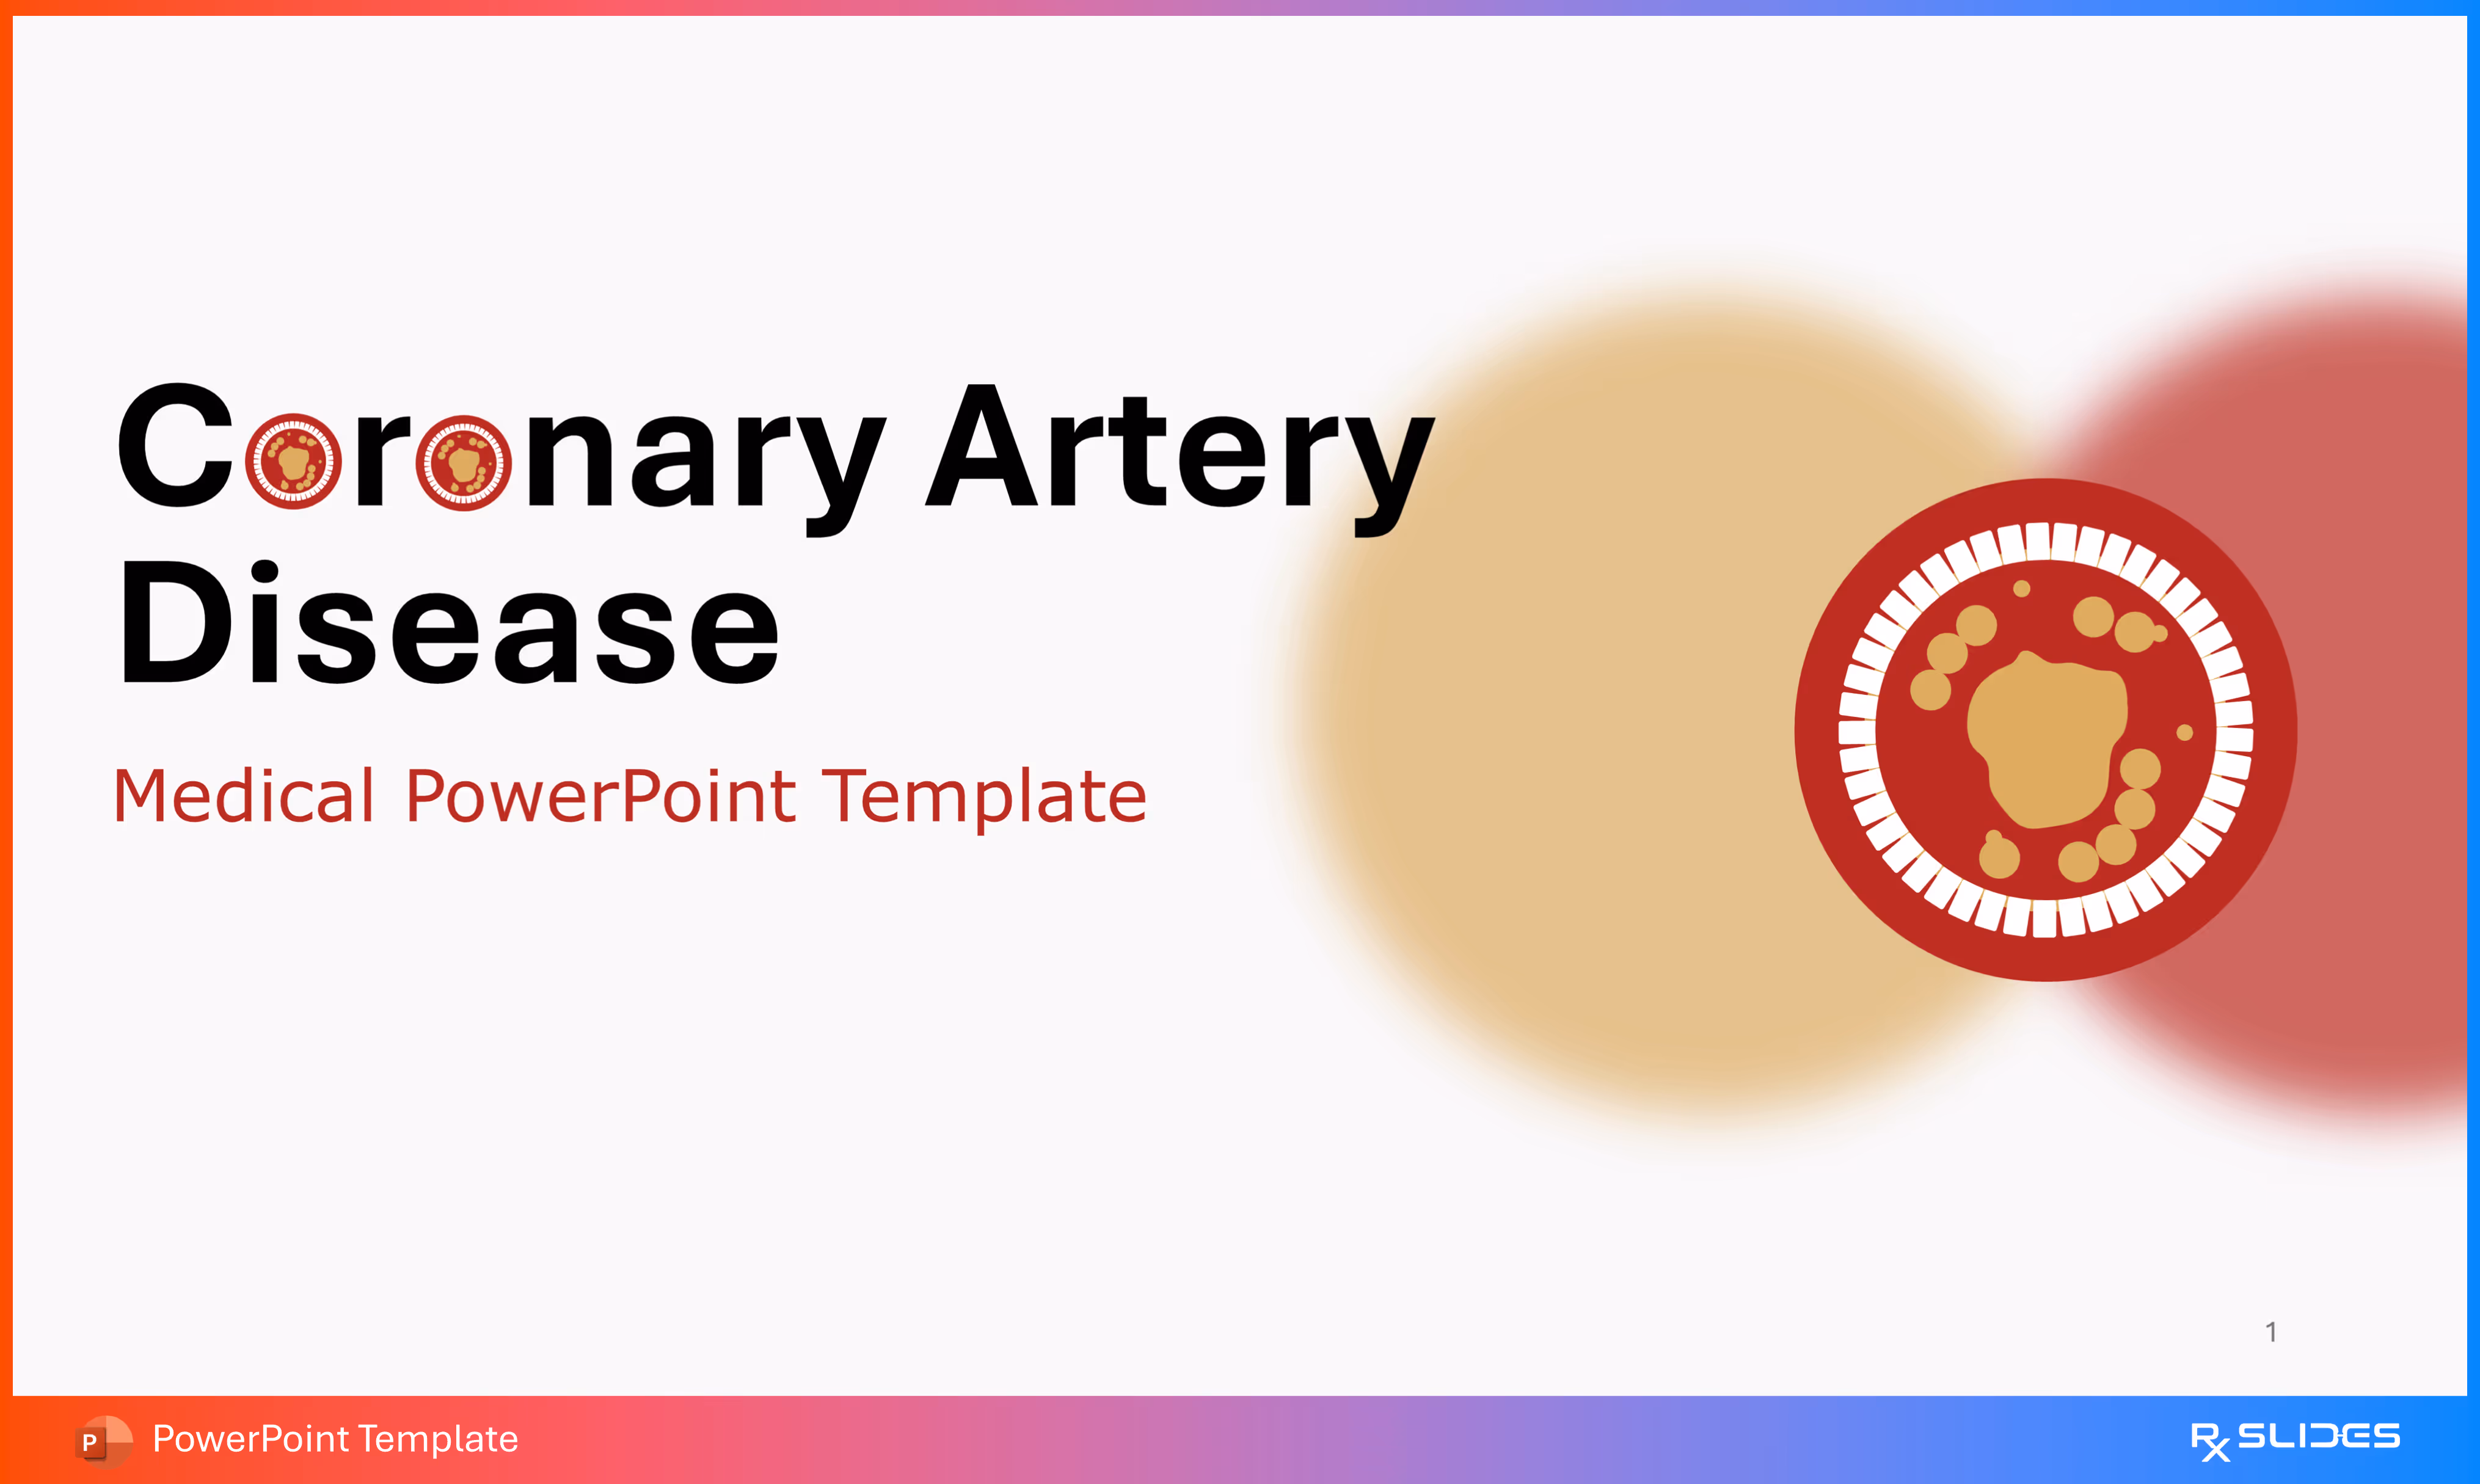
- The slide features a prominent graphic that illustrates a cross-section of an artery with plaque buildup (atherosclerosis). This visual immediately defines the core mechanism of the disease.
- The color scheme is based on black, red, and warm beige/yellow tones.
Slide 2 - Agenda
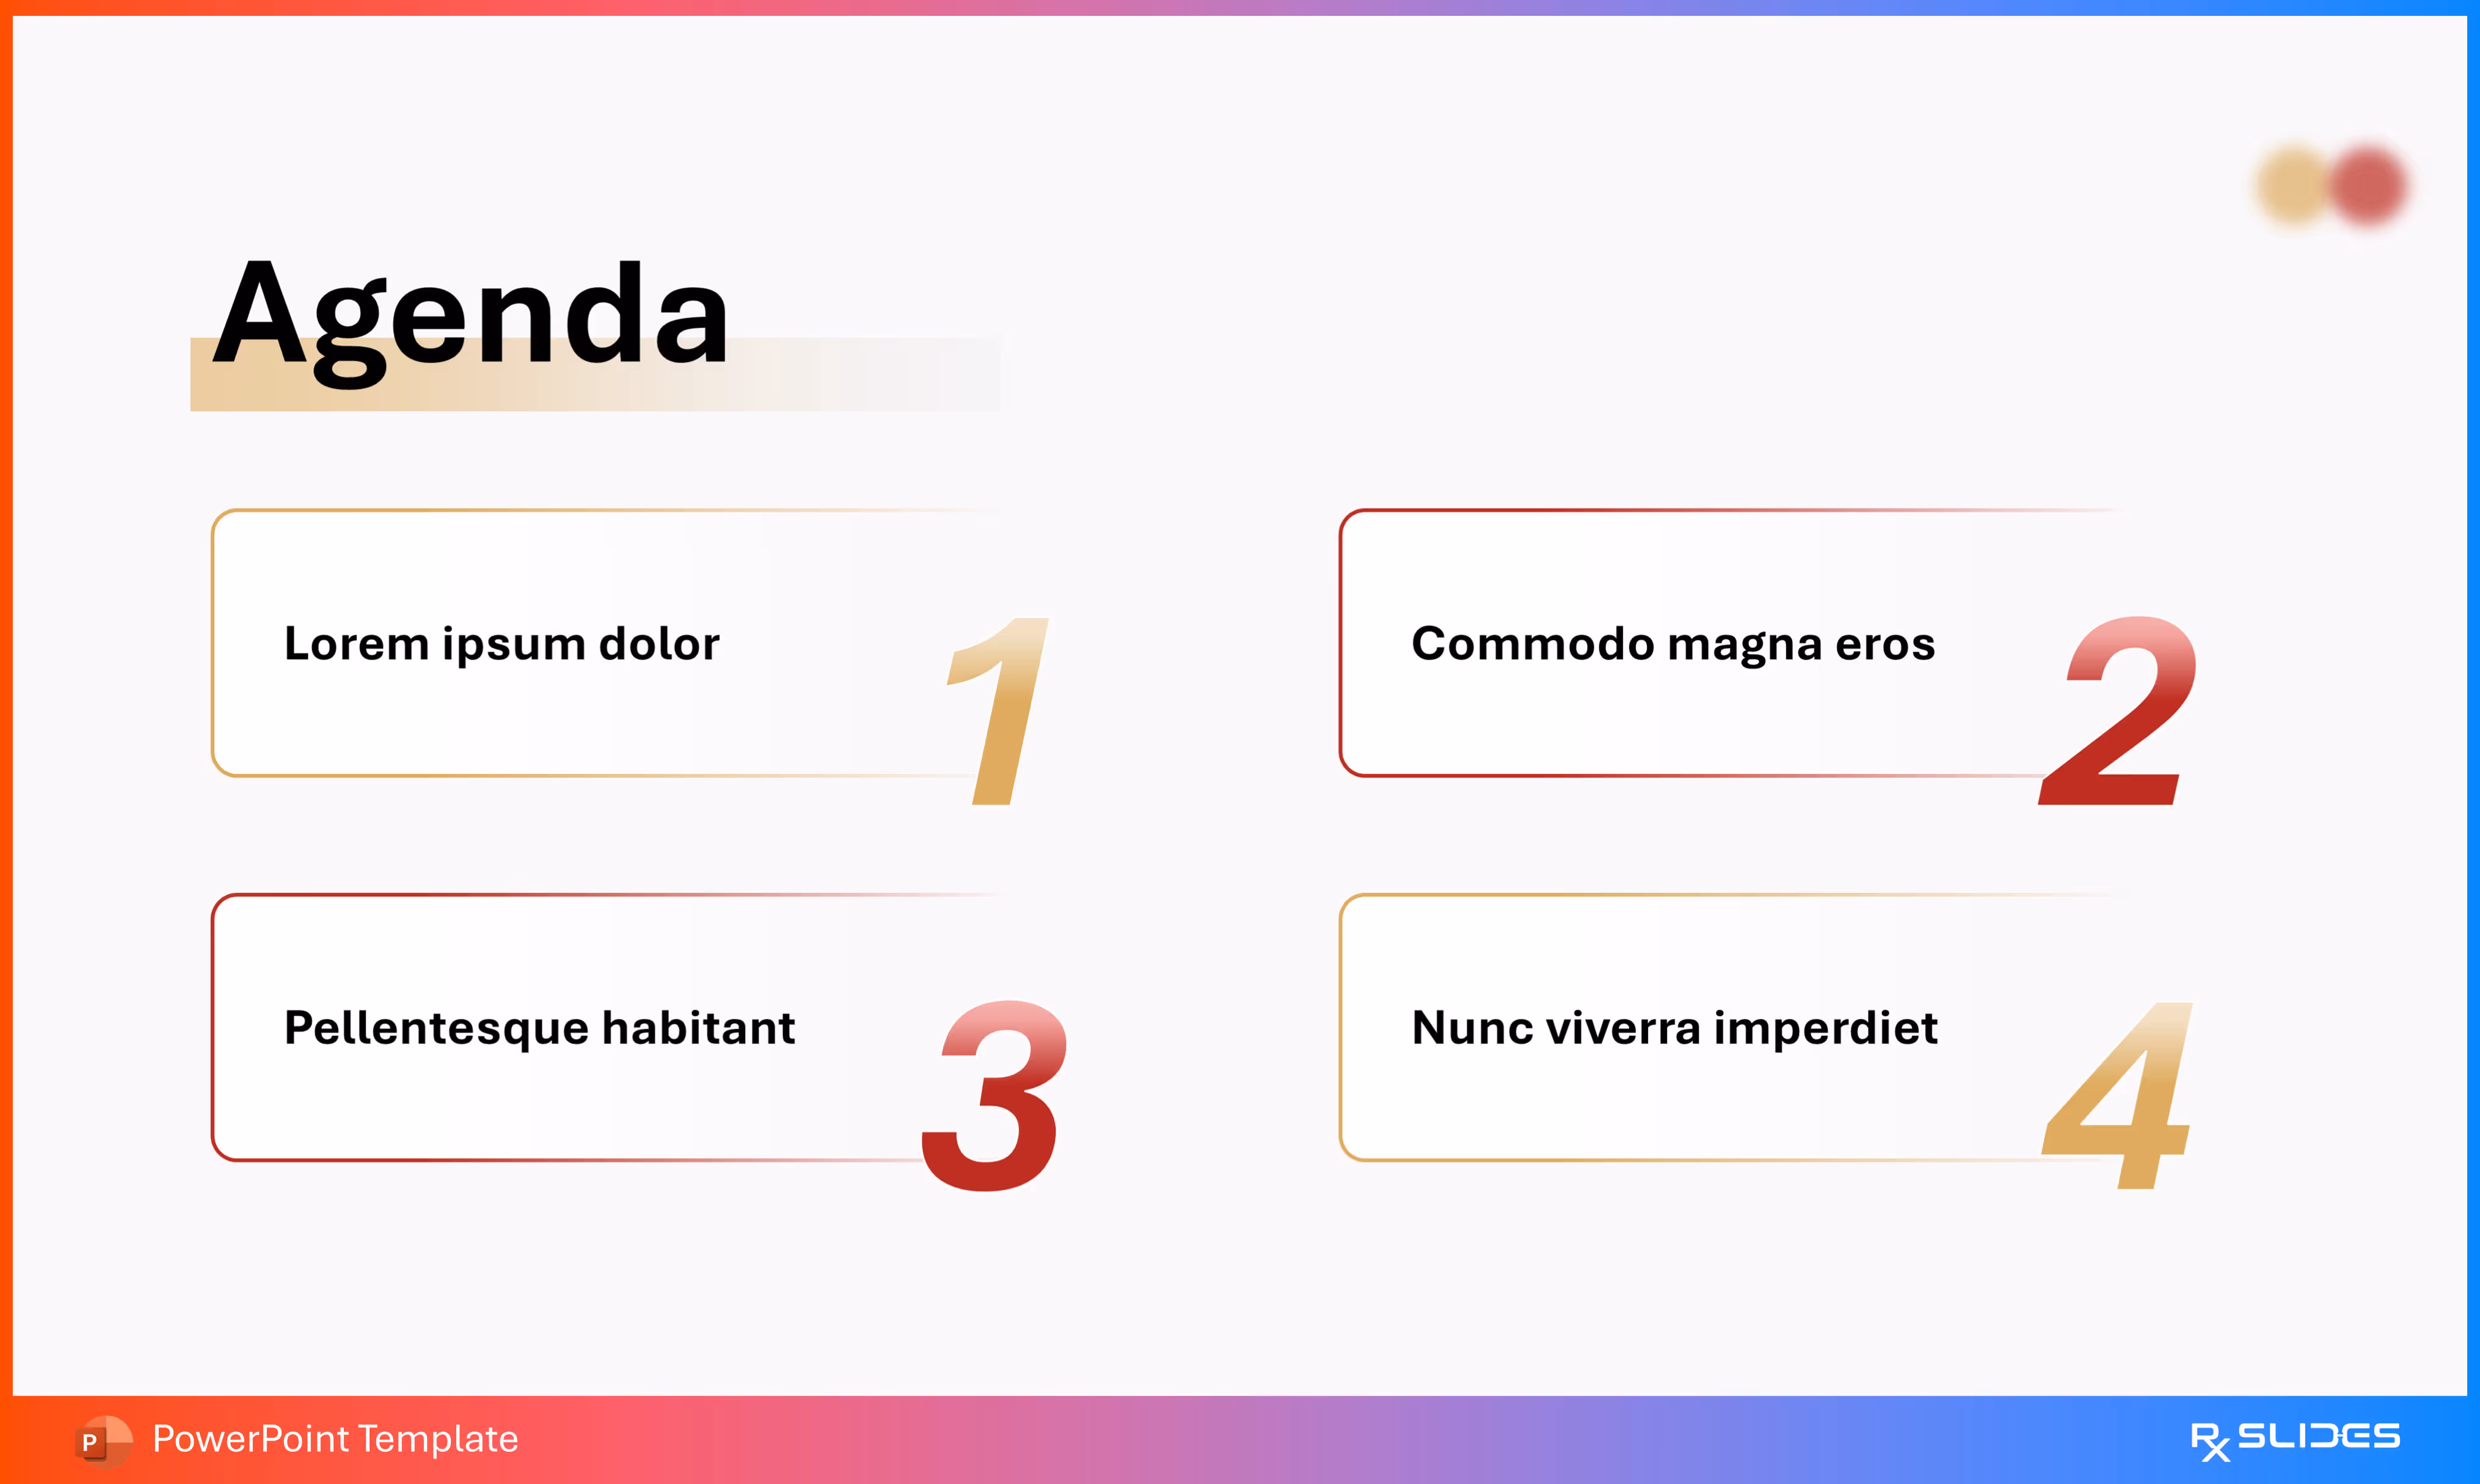
- The slide features four placeholders for major content sections, arranged in two columns. Each section has a large, stylized number (1, 2, 3, 4) indicating the sequence.
Slide 3 - Introduction & Coronary Anatomy
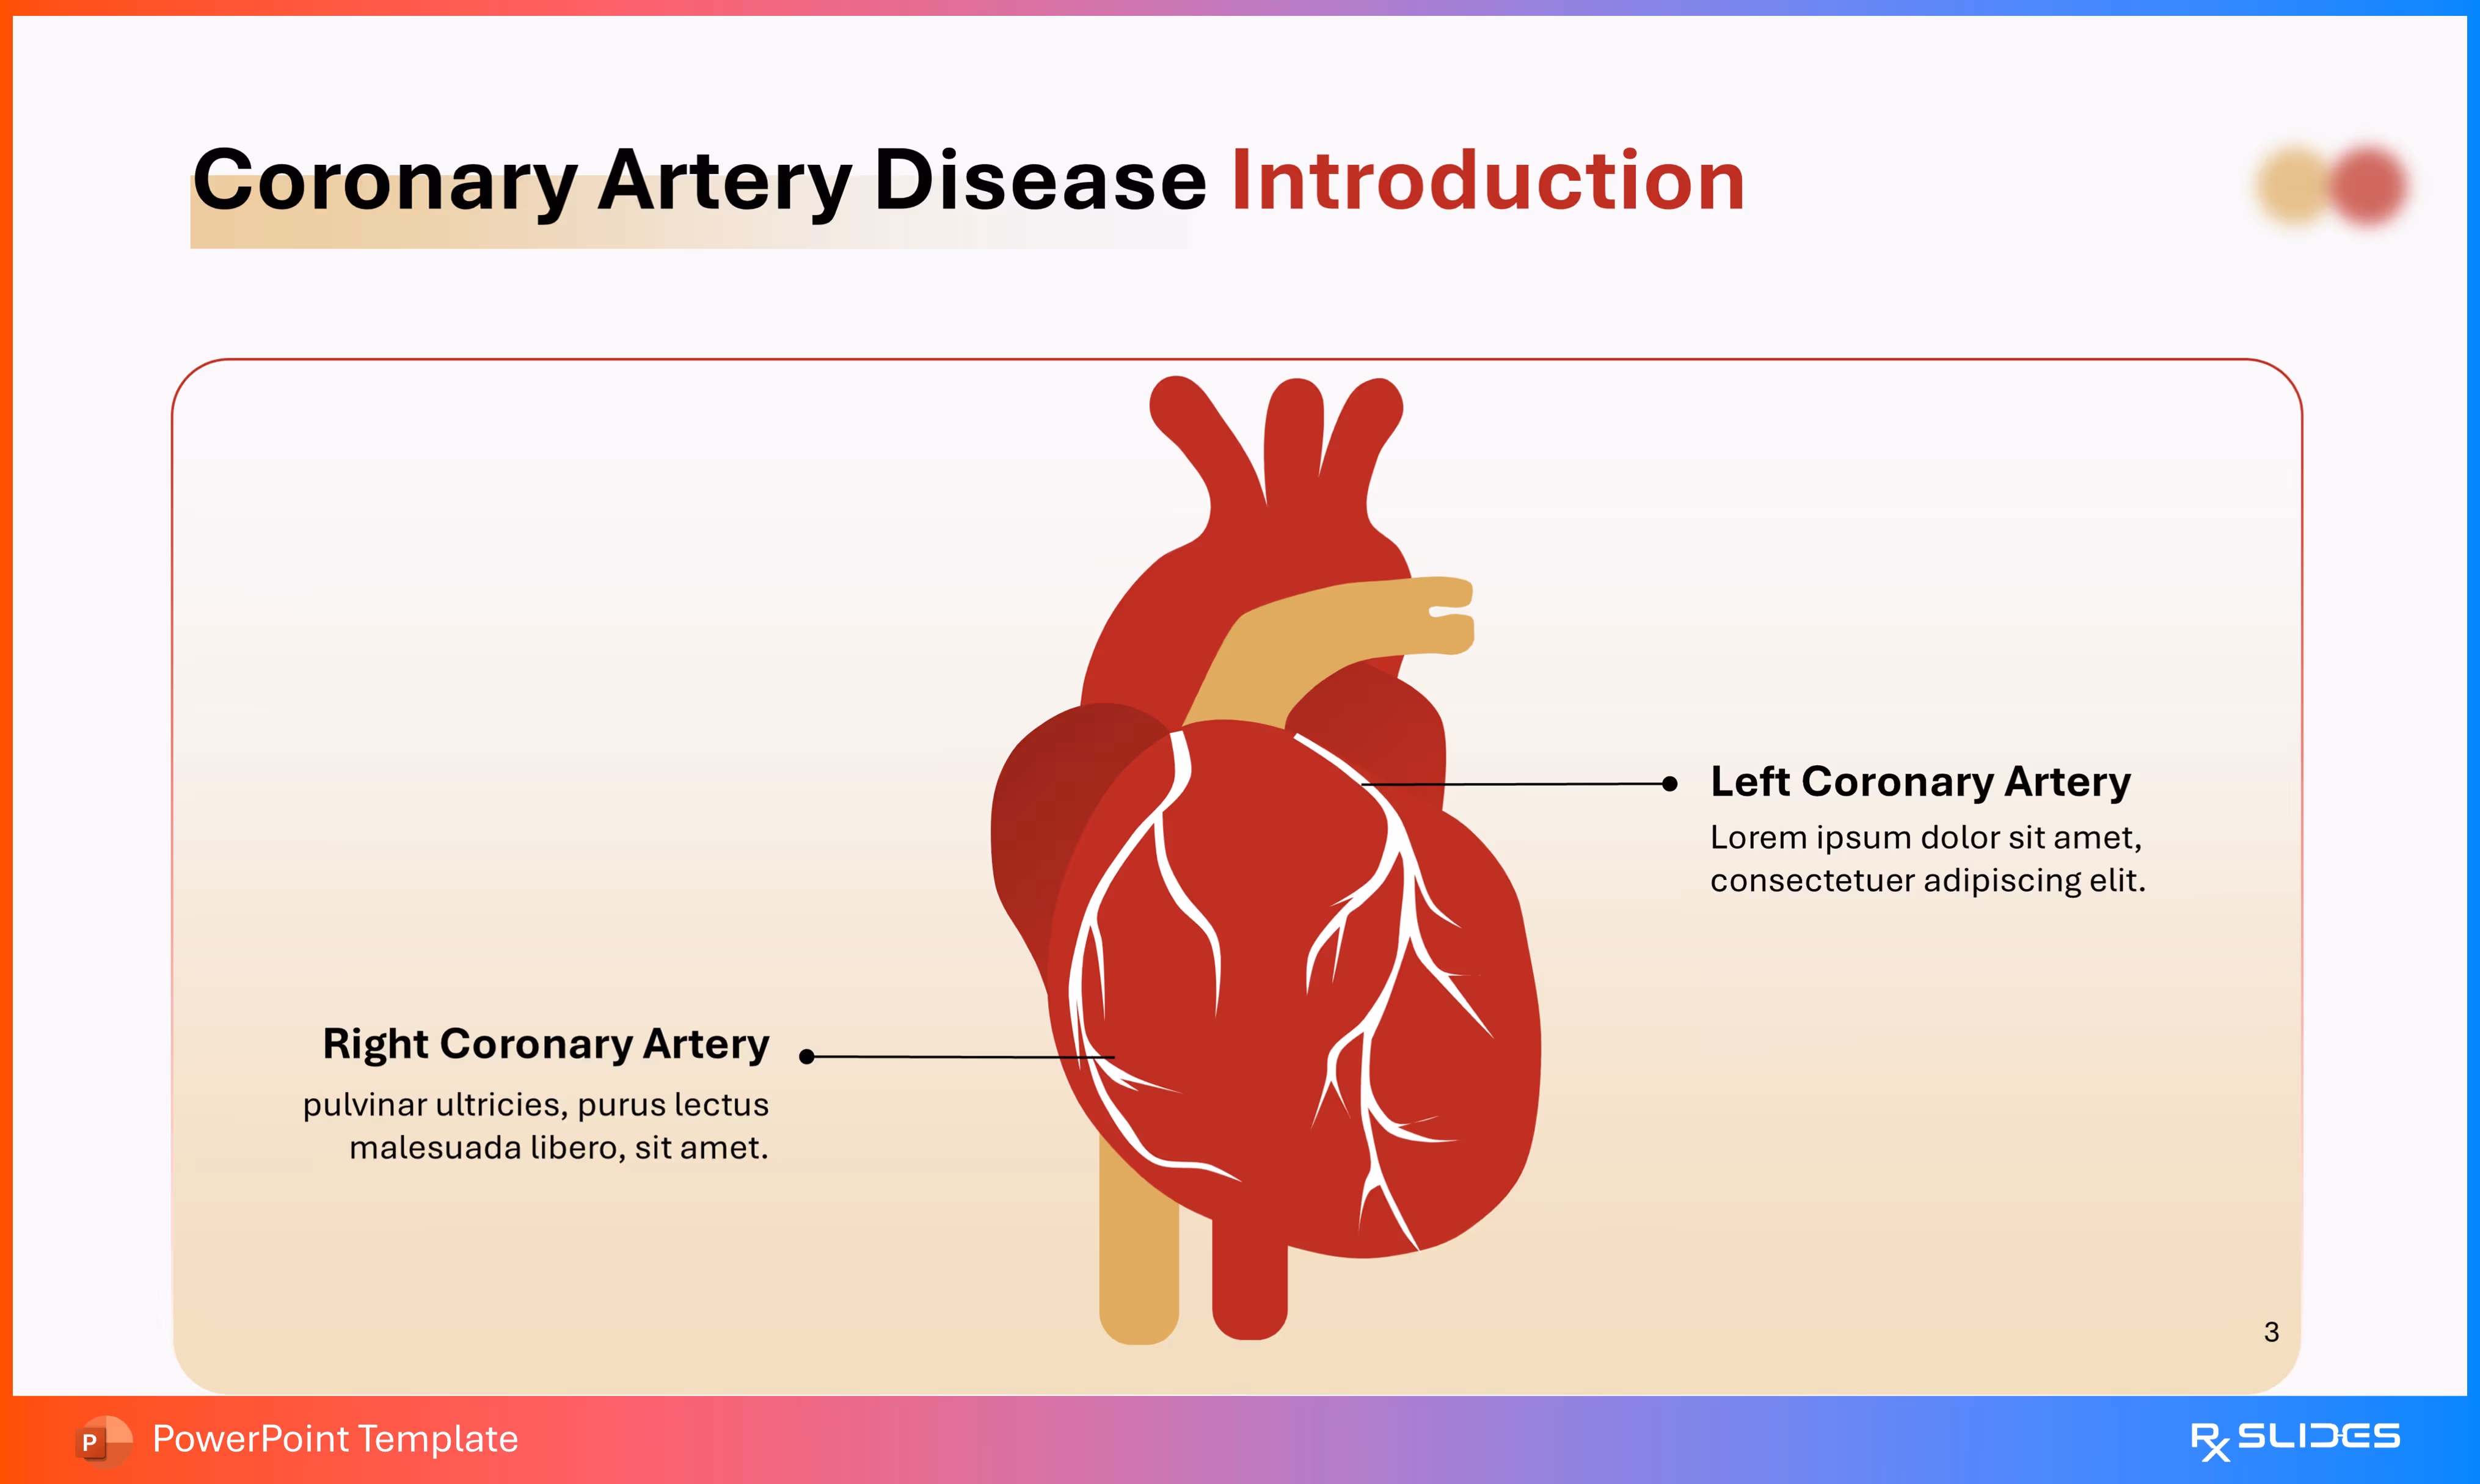
- The main graphic is a large, central, stylized illustration of the human heart. The coronary arteries are clearly visible on the surface of the heart muscle.
- The diagram specifically points out and labels the two major coronary arteries:
- Right Coronary Artery (RCA).
- Left Coronary Artery (LCA).
- The slide uses the template's color scheme, with a prominent red heart illustration framed by a rounded border.
Slide 4 - Definition
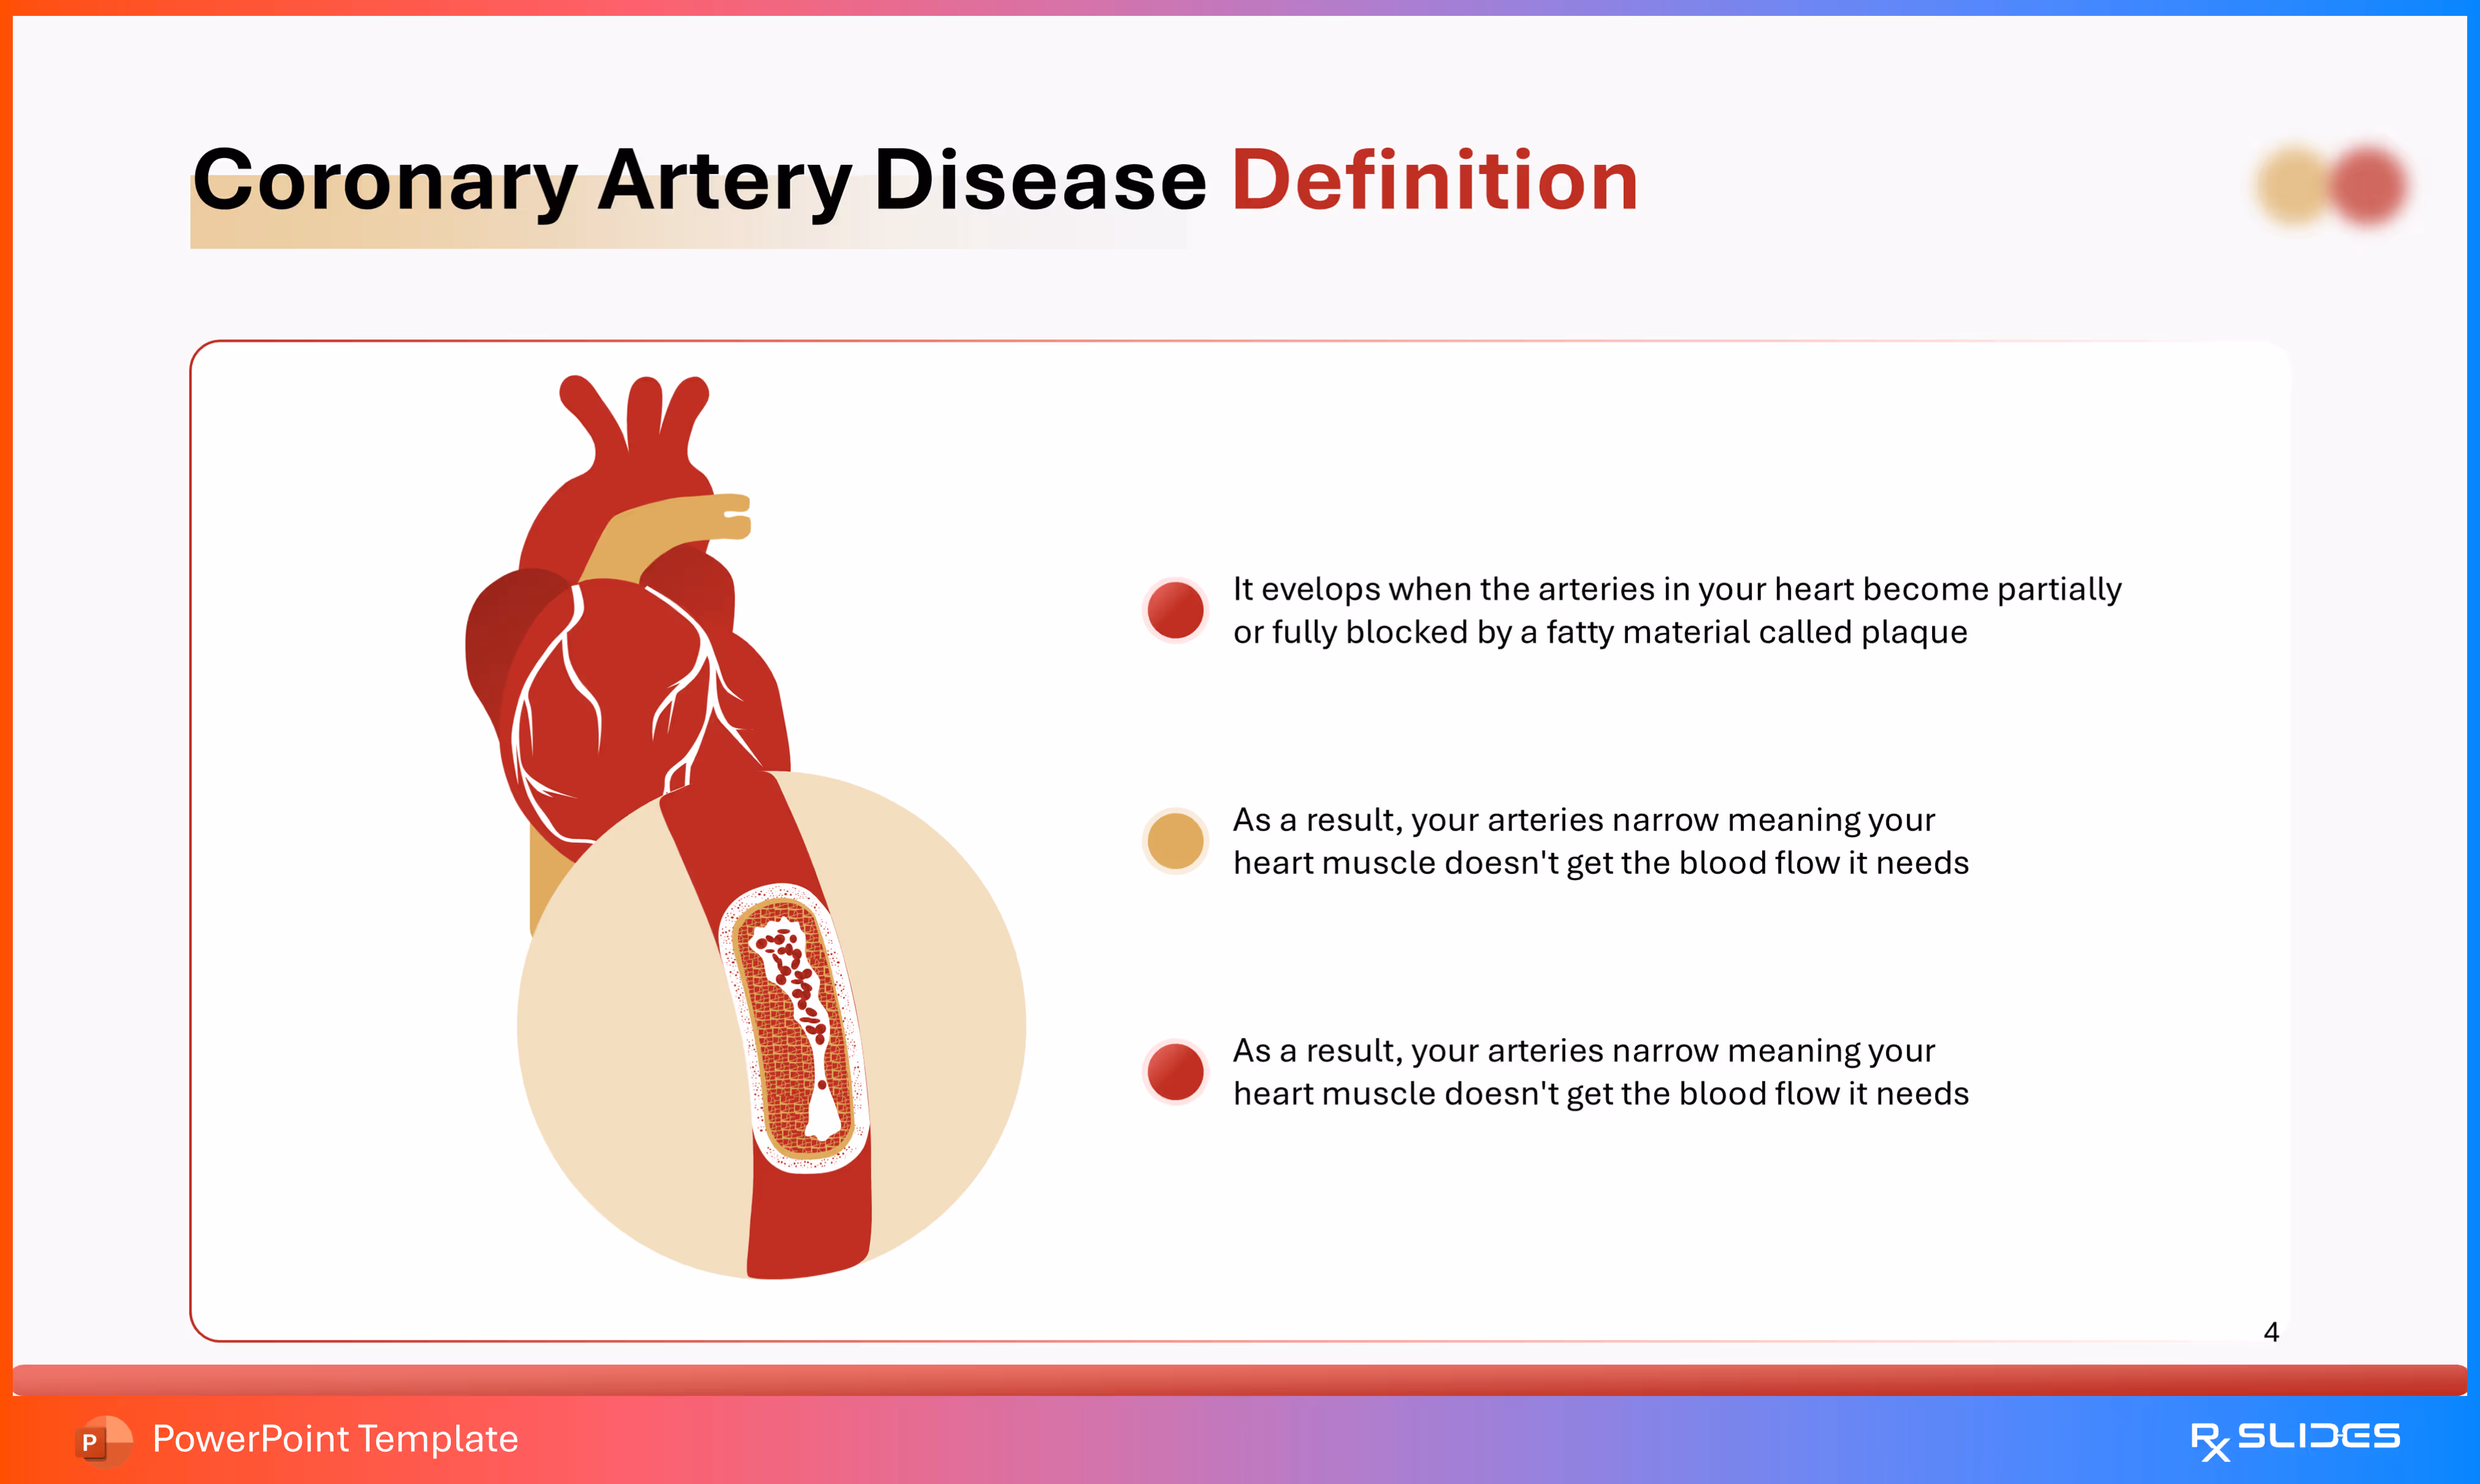
- The left side of the slide features a heart graphic and a magnified cross-section of a coronary artery.
- The cross-section clearly shows plaque buildup narrowing the artery's lumen.
- The slide defines CAD based on the following points:
- It develops when the arteries in your heart become partially or fully blocked by a fatty material called plaque.
Slide 5 - Stages (Section Divider)
.avif)
- The slide features a large, central red icon showing a profile of a human head and neck with a clogged artery visible. This graphic suggests the progression or effect of arterial narrowing.
- Aesthetics: It maintains the template's red, white, and warm beige/yellow color scheme with blurred circular background shapes.
Slide 6 - Stages of Coronary Artery Disease
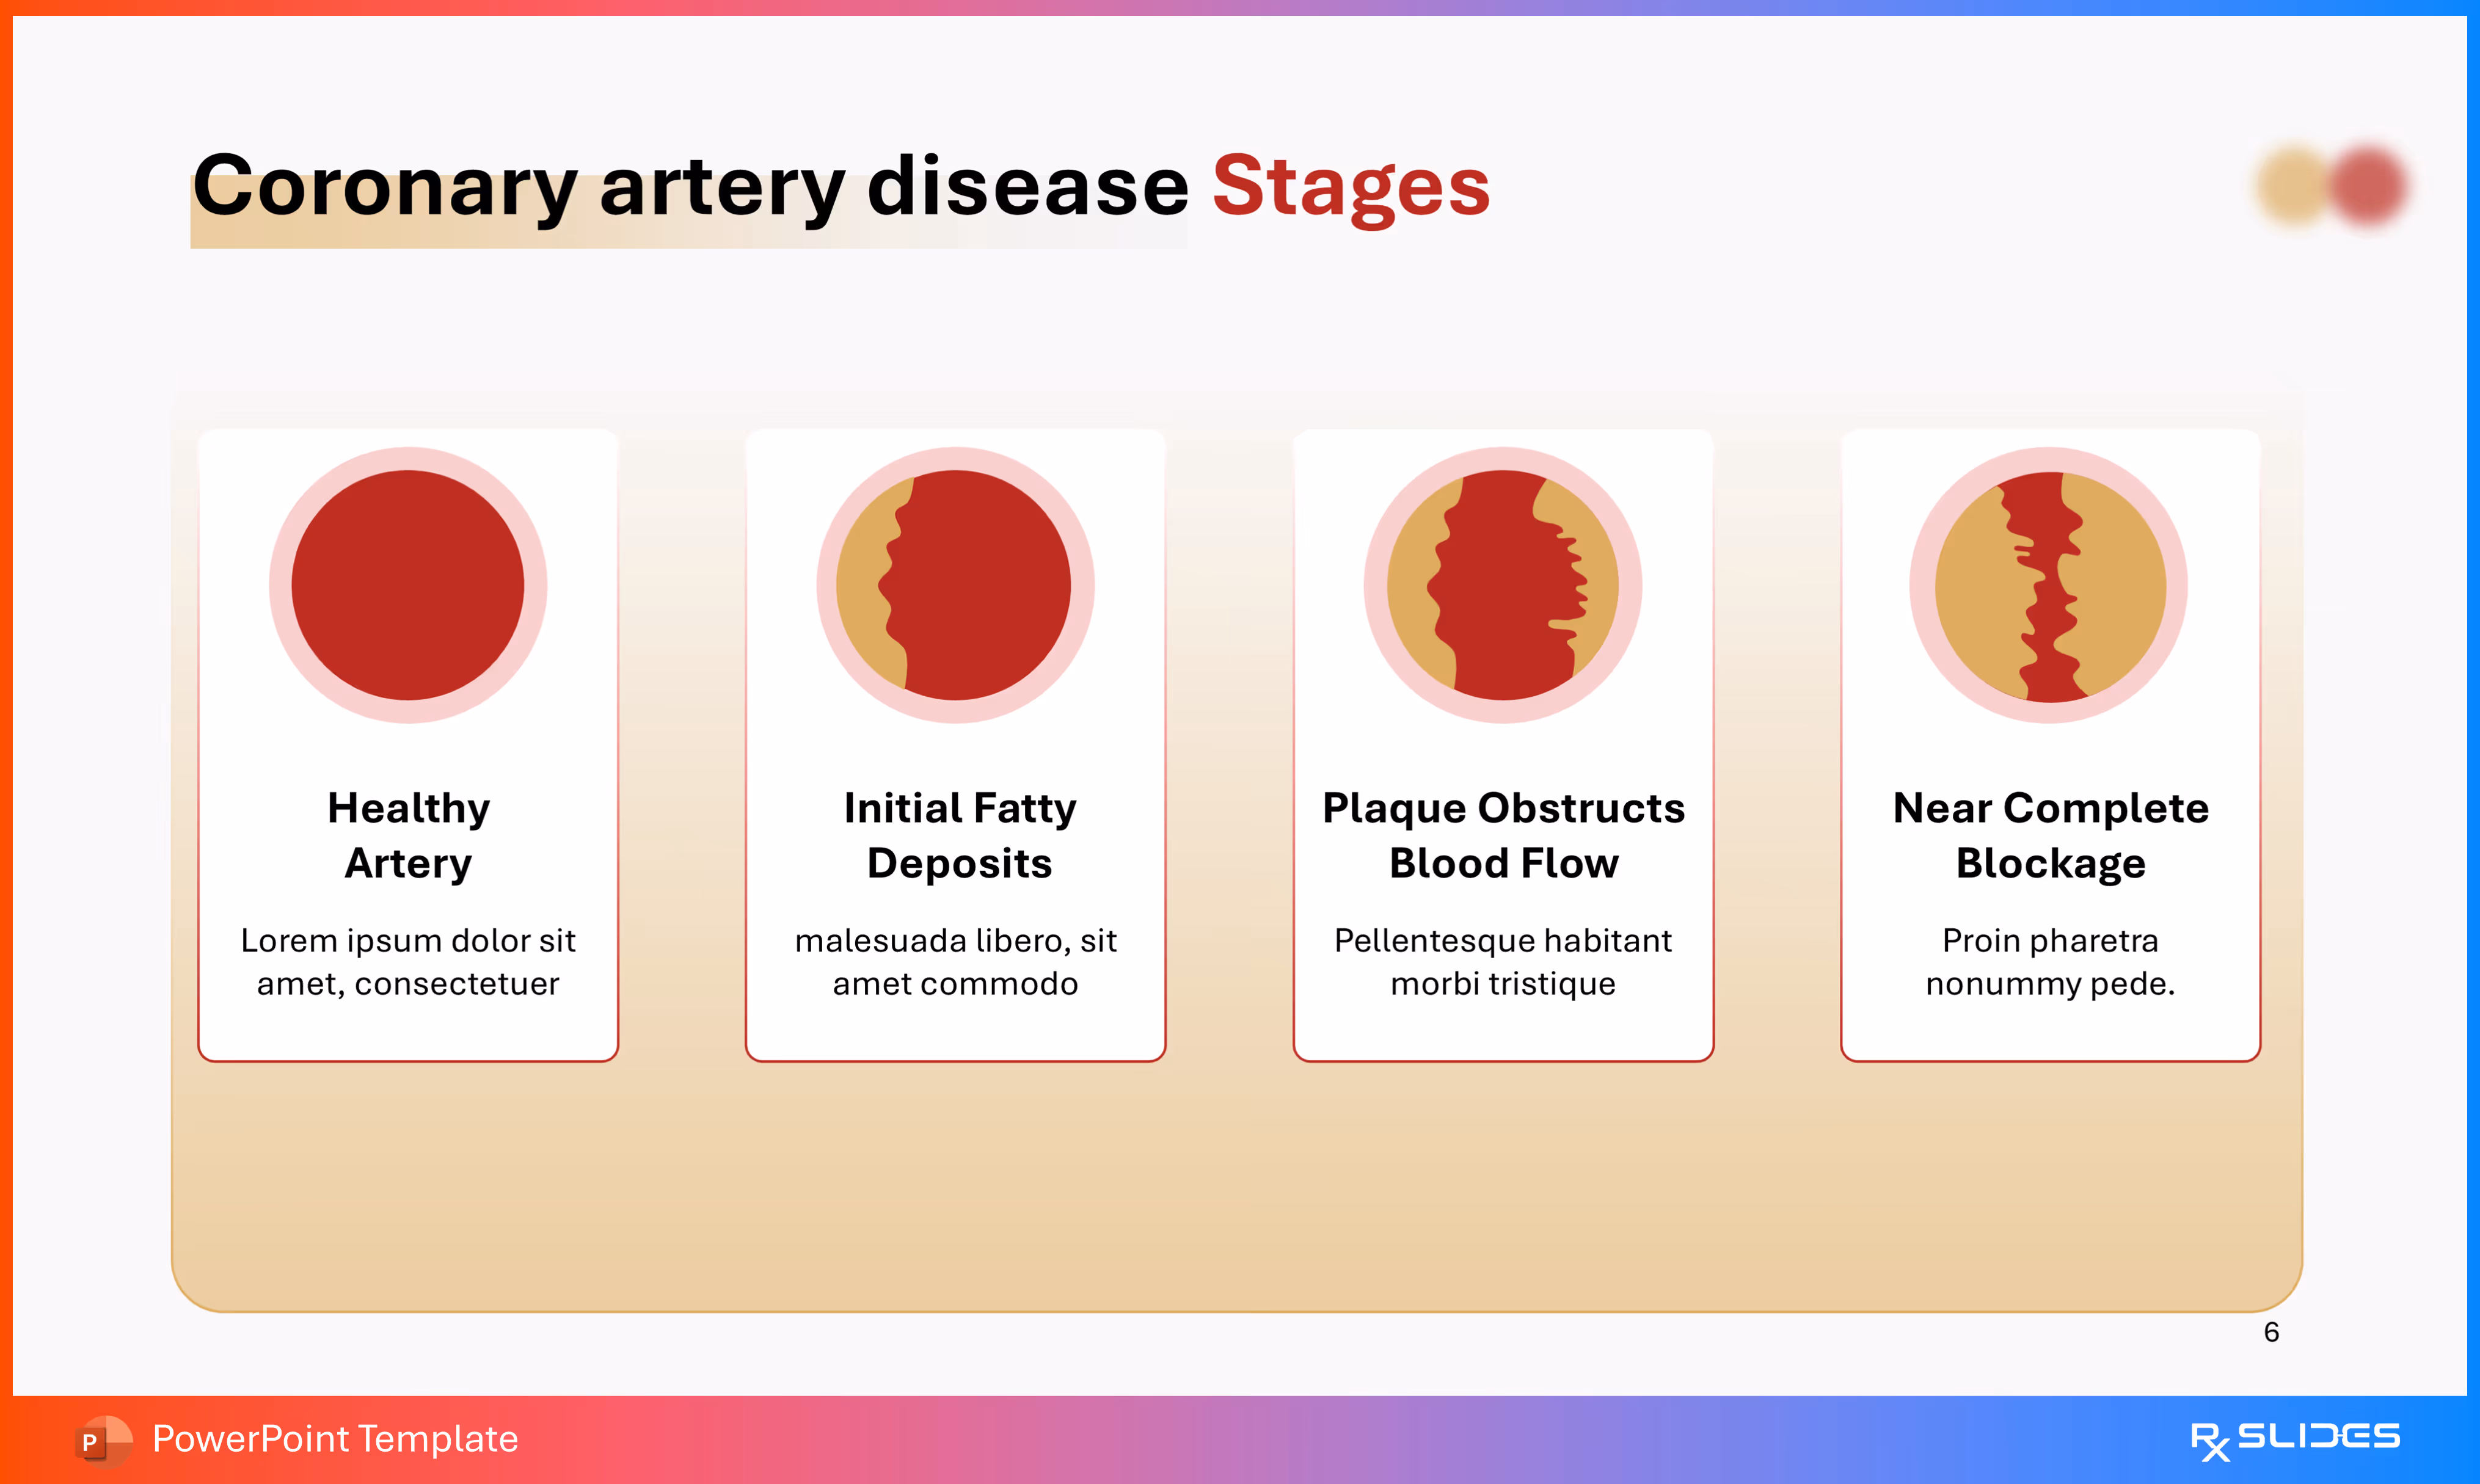
- The slide uses four large, sequential cards, each representing a stage with a corresponding icon showing an artery cross-section.
- Content Sections (Stages):
- Healthy Artery: The artery icon shows a completely open blood vessel.
- Initial Fatty Deposits: The artery icon shows a small amount of yellow/beige plaque beginning to form on the artery walls.
- Plaque Obstructs Blood Flow: The plaque significantly thickens and obstructs the blood vessel, but there is still some opening.
- Near Complete Blockage: The plaque buildup has almost completely closed the artery, leaving only a tiny channel for blood flow.
- The presentation of the stages uses a clear visual progression, and the bottom of the slide is framed by the template's warm beige/yellow footer.
Slide 7 - Ischemic Heart Disease Stages (Alternative Layout)
.avif)
- This slide presents the four stages in a vertical, staircase-like flow, numbered 01 through 04, using angled, colored banners.
- Content Sections (Stages): The four stages are identical to those detailed on Slide 6, but the presentation is different:
- Healthy Artery (Icon: Open red circle).
- Initial Fatty Deposits (Icon: Minor plaque buildup).
- Plaque Obstructs Blood Flow (Icon: Significant obstruction).
- Near Complete Blockage (Icon: Severely narrowed artery).
- The slide uses a darker red for the stage banners and features a prominent red footer.
Slide 8 - Prevalence (Section Divider)
.avif)
- The slide features a prominent red and white icon of a globe on a stand, indicating the worldwide scope or spread of the disease.
- The design maintains the template's color palette, featuring the red and warm beige/yellow blurred circles in the background.
Slide 9 - Prevalence Visualization
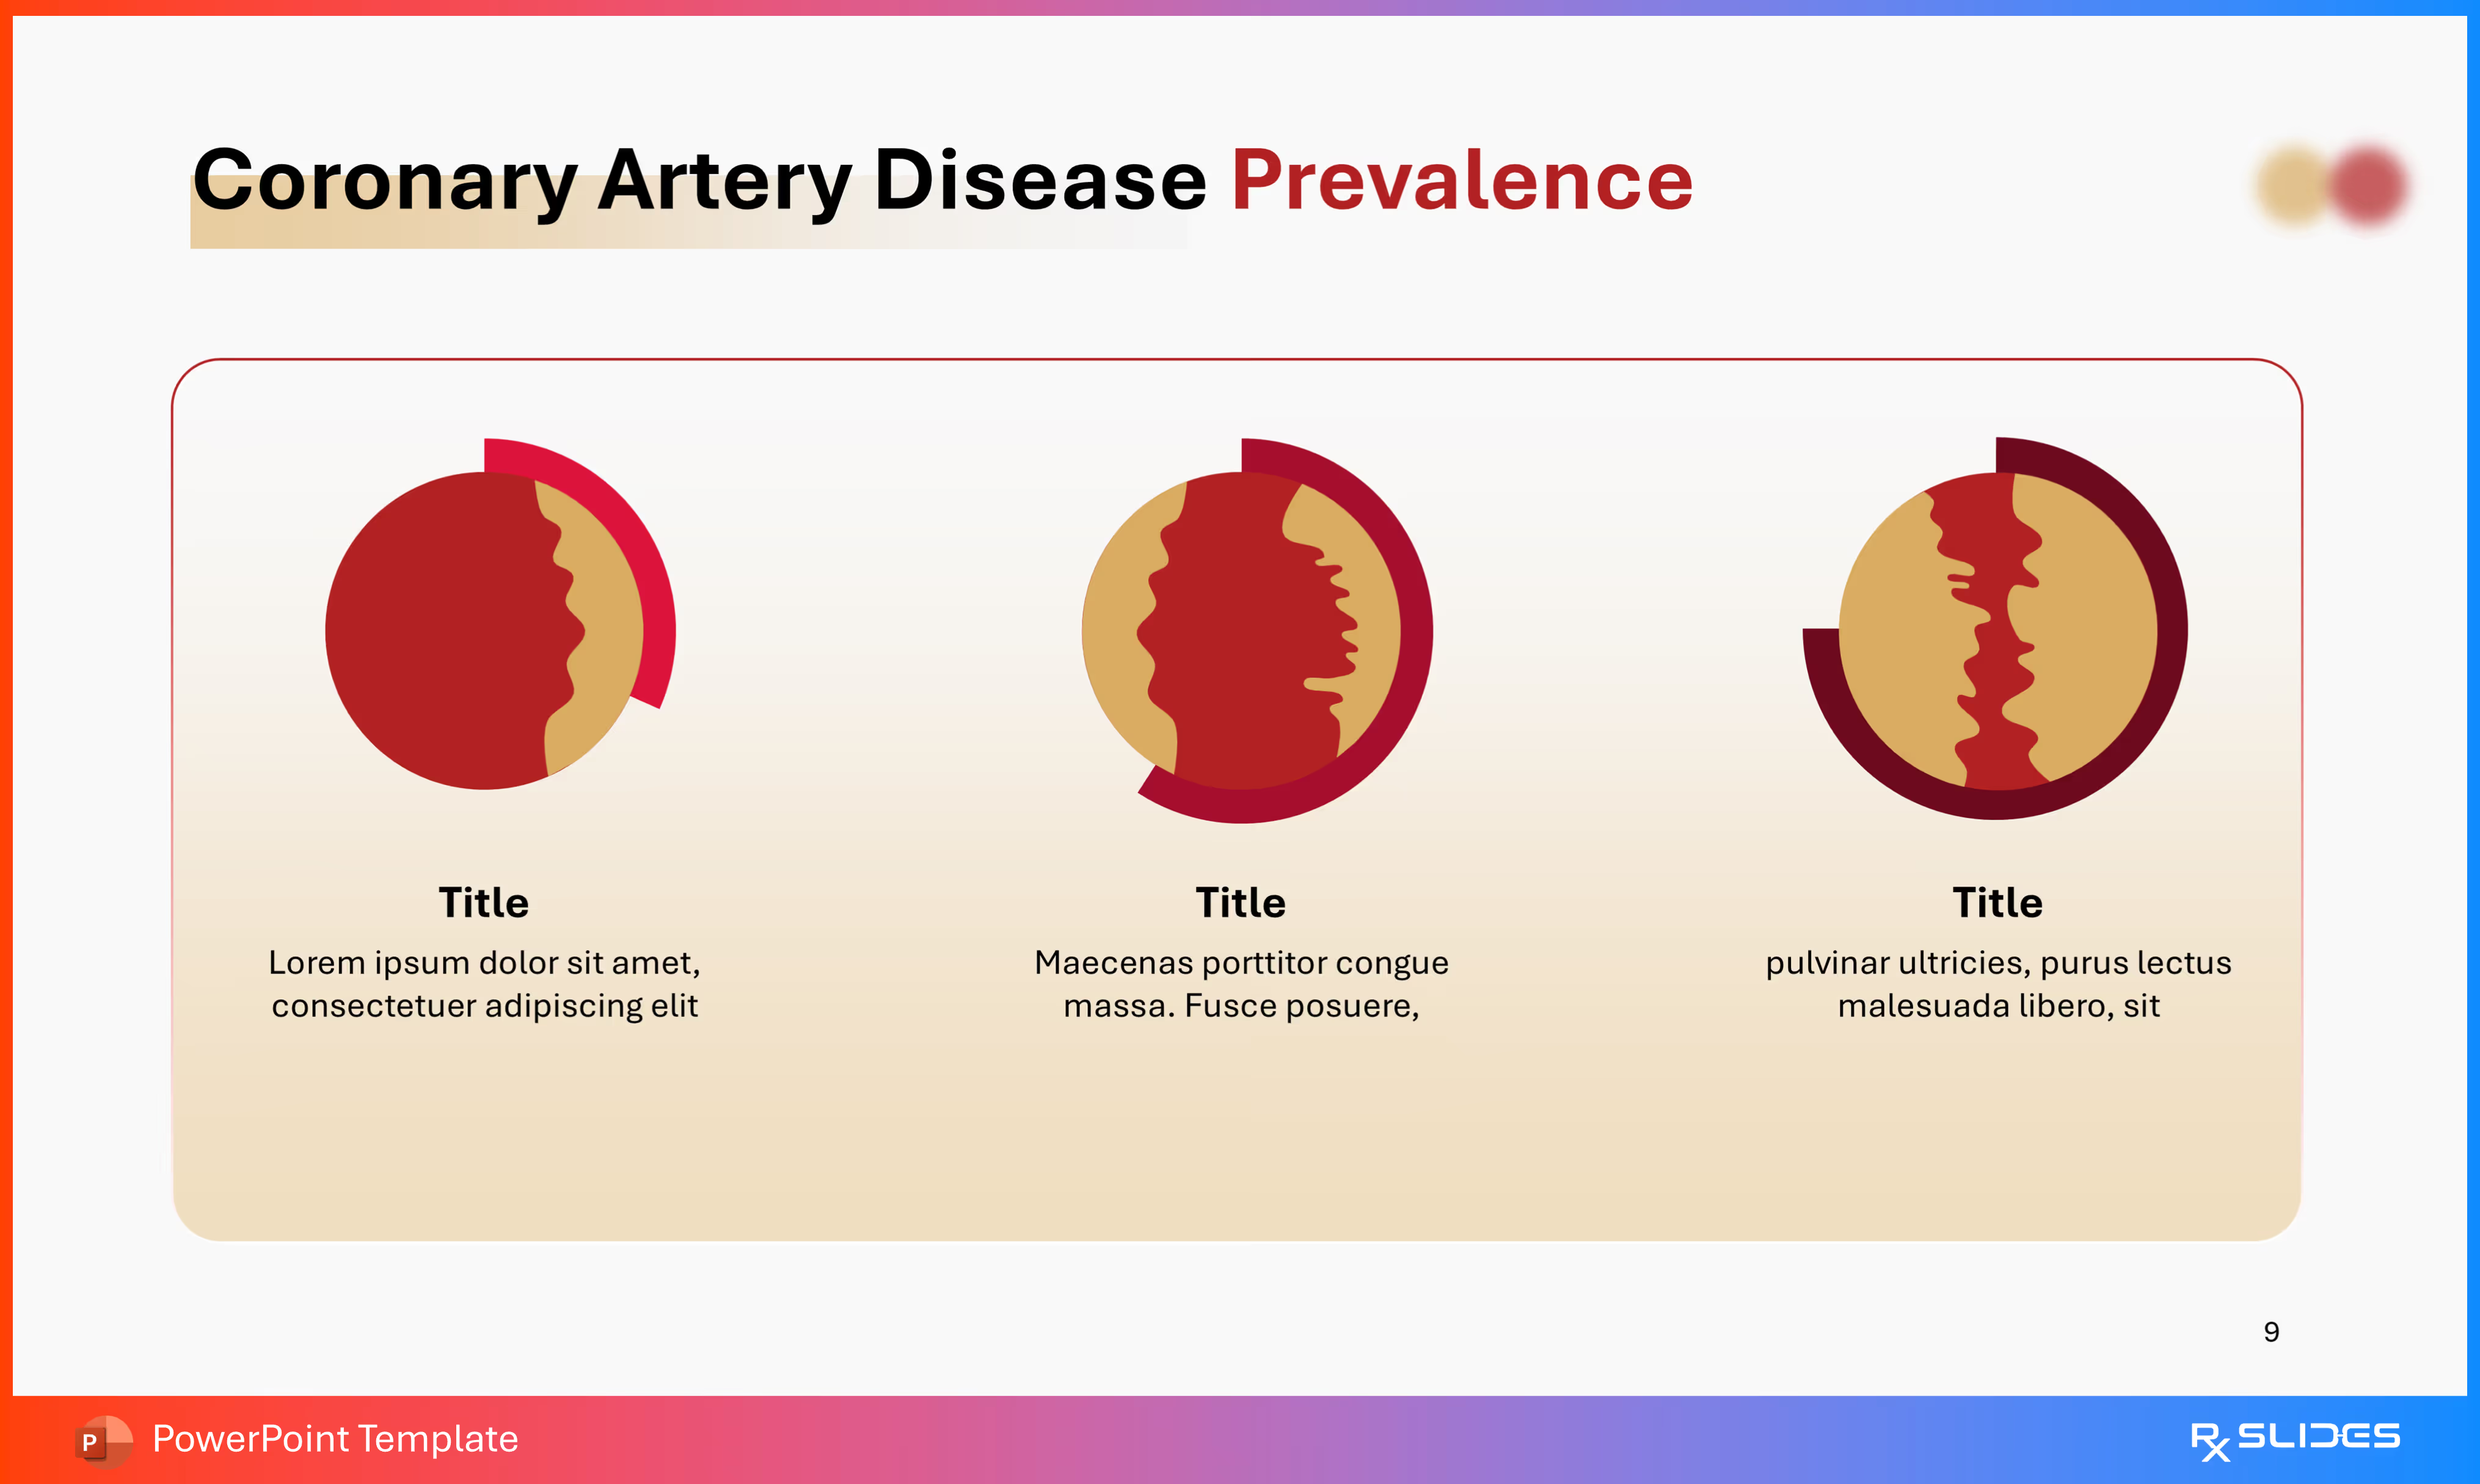
- The slide uses three circular, segmented chart-like graphics to visually represent comparative data, likely showing the proportion of the population affected or the disease's impact across different regions or demographics.
- Each of the three main graphics is an artery cross-section icon combined with a circle that has a portion cut out, suggesting a statistical comparison.
- The content below the visuals is placeholder text.
- It continues the template's red and warm beige/yellow color scheme.
Slide 10 - Ischemic Heart Disease Prevalence (Bar Charts)
.avif)
- The slide presents three horizontal bar charts, designed to compare prevalence data across three different categories.
- Visual Elements:
- Each row features a stylized artery cross-section icon with varying degrees of plaque buildup, suggesting that the prevalence data might correlate with the severity or stage of the disease.
- Next to each icon is a long, dark red bar chart with a placeholder percentage (XX%) at the end to be filled with statistical data.
- The visual flow utilizes the template's characteristic red, beige, and white color scheme.
Slide 11 - Prevalence: Global Map Visualization
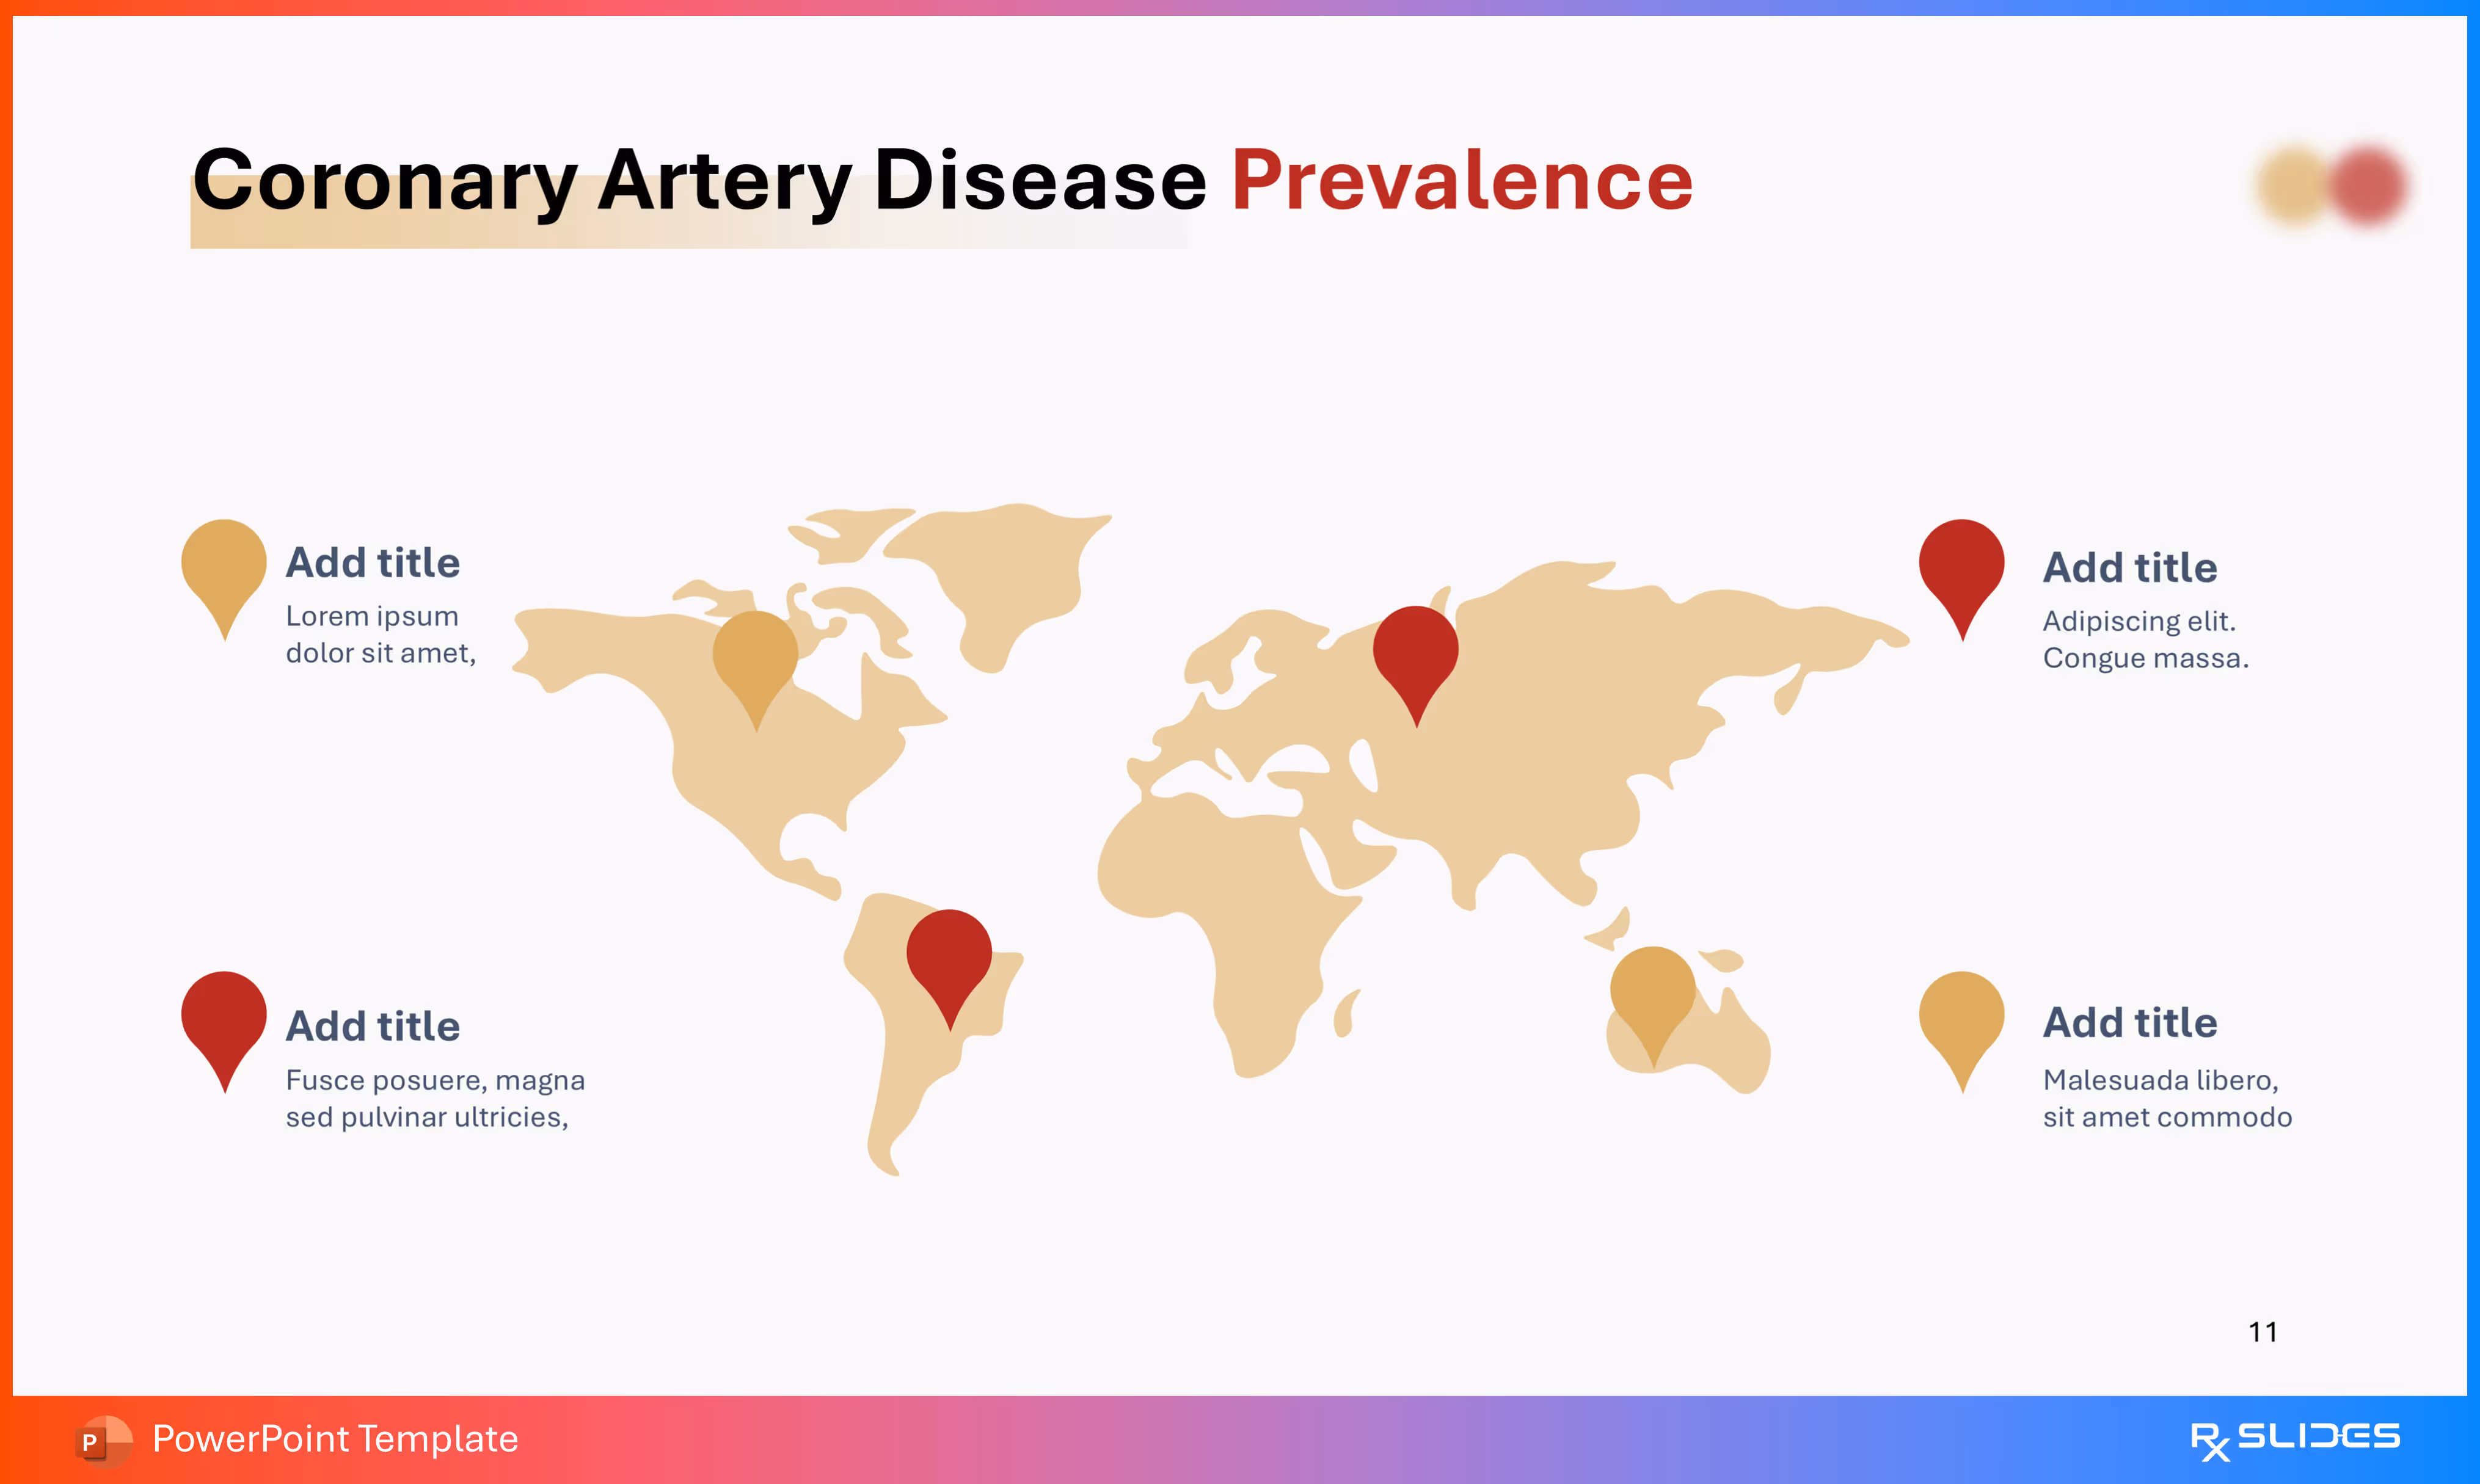
- The slide features a world map where key geographical locations are highlighted using map pins.
- Visual Elements:
- The map itself uses the template's warm beige/yellow tone.
- Four map pins are used to mark regions, with two in the red color and two in the yellow color, likely signifying different levels of prevalence or key data points.
- Each pin is associated with a text box (e.g., "Add title," "Lorem ipsum dolor sit amet") for detailing specific regional statistics or facts.
- This slide effectively combines geographical data presentation with the template's established color scheme.
Slide 12 - Risk Factors (Section Divider)
.avif)
- The slide features a prominent stylized DNA double helix icon. This icon strongly suggests that one of the focus areas in the subsequent slides will be genetic or hereditary risk factors for the disease.
- The icon and text use the template's signature red, white, and warm beige/yellow colors with blurred circles providing the background effects.
Slide 13 - Risk Factors (Detail)
.avif)
- The slide uses six circular icons connected by a horizontal line, presenting the factors in a linear flow.
- Content Sections (Risk Factors):
- Age: Represented by an icon of an elderly person with a cane.
- Alcohol: Represented by a wine bottle and a glass icon.
- Genetic: Represented by a stylized DNA helix icon.
- Obesity: Represented by a clipboard/record icon, possibly signifying related health measurements or body mass index.
- Diabetes: Represented by a hand holding an insulin pen/needle icon.
- Smoking: Represented by a cigarette with rising smoke icon.
- The factors are highlighted using the template's red and warm beige/yellow color scheme.
Slide 14 - Ischemic Heart Disease Risk Factors (Alternative Layout)
.avif)
- This slide uses a linear flow, featuring six square cards aligned horizontally, each containing an icon and text.
- The six risk factors are the same as those listed on Slide 13, but the icon coloring has been adjusted (more gold/yellow)
- This version features a strong red footer and uses the gold/yellow color prominently in the icons.
Slide 15 - Causes (Section Divider)
.avif)
- The slide features a prominent, stylized red icon of an overweight or obese person.
- This visual directly relates to one of the major risk factors (Obesity, mentioned on Slides 13 and 14) and suggests the upcoming slides will focus on direct or underlying causes, likely focusing on lifestyle or metabolic issues.
- The design uses the template's characteristic red, white, and warm beige/yellow blurred circles and colors.
Slide 16 - Causes (Detail)
.avif)
- The slide uses four vertical columns, each representing a primary cause with a matching icon and a title banner.
- Content Sections (Causes):
- Alcohol: Icon shows a wine bottle and a glass/cup.
- Smoking: Icon shows a lit cigarette in a pack.
- Obesity: Icon shows an overweight person with a clipboard/check mark, suggesting assessment or related health issues.
- Diabetes: Icon shows a glucose meter and test strips, representing blood sugar management issues.
- These four "Causes" overlap significantly with the "Risk Factors" listed on Slide 13 and 14, highlighting their direct role in the disease's development.
- The presentation alternates the banner colors between red and warm beige/yellow.
Slide 17 - Ischemic Heart Disease Causes (Alternative Layout)
.avif)
- This slide uses four vertical content blocks, similar to Slide 16, but with a different visual style where the content text is placed below the title banner and icon.
- The icons are simpler line art within circles, but they represent the same four key causes
- The slide features alternating dark red and warm beige/yellow banners for the cause titles, and a prominent red footer at the bottom.
Slide 18 - Pathogenesis (Section Divider)
.avif)
- The slide features a prominent stylized red icon of the human heart.
- This is highly relevant as the pathogenesis of CAD involves the physical development of atherosclerosis within the coronary arteries that supply the heart muscle.
- The design maintains the template's characteristic red, white, and warm beige/yellow blurred circles and colors.
Slide 19 - Pathogenesis: Stage 1 (Plaque Build-up)
.avif)
- The slide focuses on the initial stage of the disease's development:
- Stage 1: Plaque build-up starts.
- Fatty deposits called cholesterol, accumulate on the artery walls creating plaques.
- The right side of the slide features a large, magnified illustration of a blood vessel cross-section.
- Red blood cells are visible flowing through the center.
- Large, irregular yellow/beige deposits (plaque) are shown accumulating on the inner wall of the artery.
- The word "Cholesterol" is explicitly labeled near the plaque formation.
- The visual elements use the template's dark red and warm beige/yellow colors.
Slide 20 - Pathogenesis: Stage 2 (Artery Narrowing)
.avif)
- The slide focuses on the progression from initial buildup to obstruction:
- Stage 2: more plaque build-up.
- The arteries are being tightened and making it difficult for blood to flow to the heart.
- The right side shows an advanced, magnified illustration of a blood vessel cross-section.
- The artery is severely narrowed by a large, irregular mass of plaque (yellow/beige deposits), with only a small channel remaining for blood flow.
- The word "Plaque" is explicitly labeled near the obstruction.
Slide 21 - Pathogenesis: Stage 3 (Clot Formation/Occlusion)
.avif)
- The slide focuses on the event that often leads to a heart attack:
- Stage 3: significant reduction in blood flow.
- Blood clots or thrombus that totally occludes the blood flow.
- The right side shows a magnified illustration of a blood vessel that is completely blocked.
- The atherosclerotic plaque is visible, and a large cluster of dark red material, labeled "Thrombus," is shown covering the remaining narrow opening.
- This thrombus (blood clot) prevents any blood from passing through.
- This illustrates the transition to an acute event (like unstable angina or myocardial infarction) where the artery becomes completely blocked, consistent with the "Near Complete Blockage" stage mentioned on Slide 6.
Slide 22 - Pathogenesis: Myocardial Infarction/Heart Attack
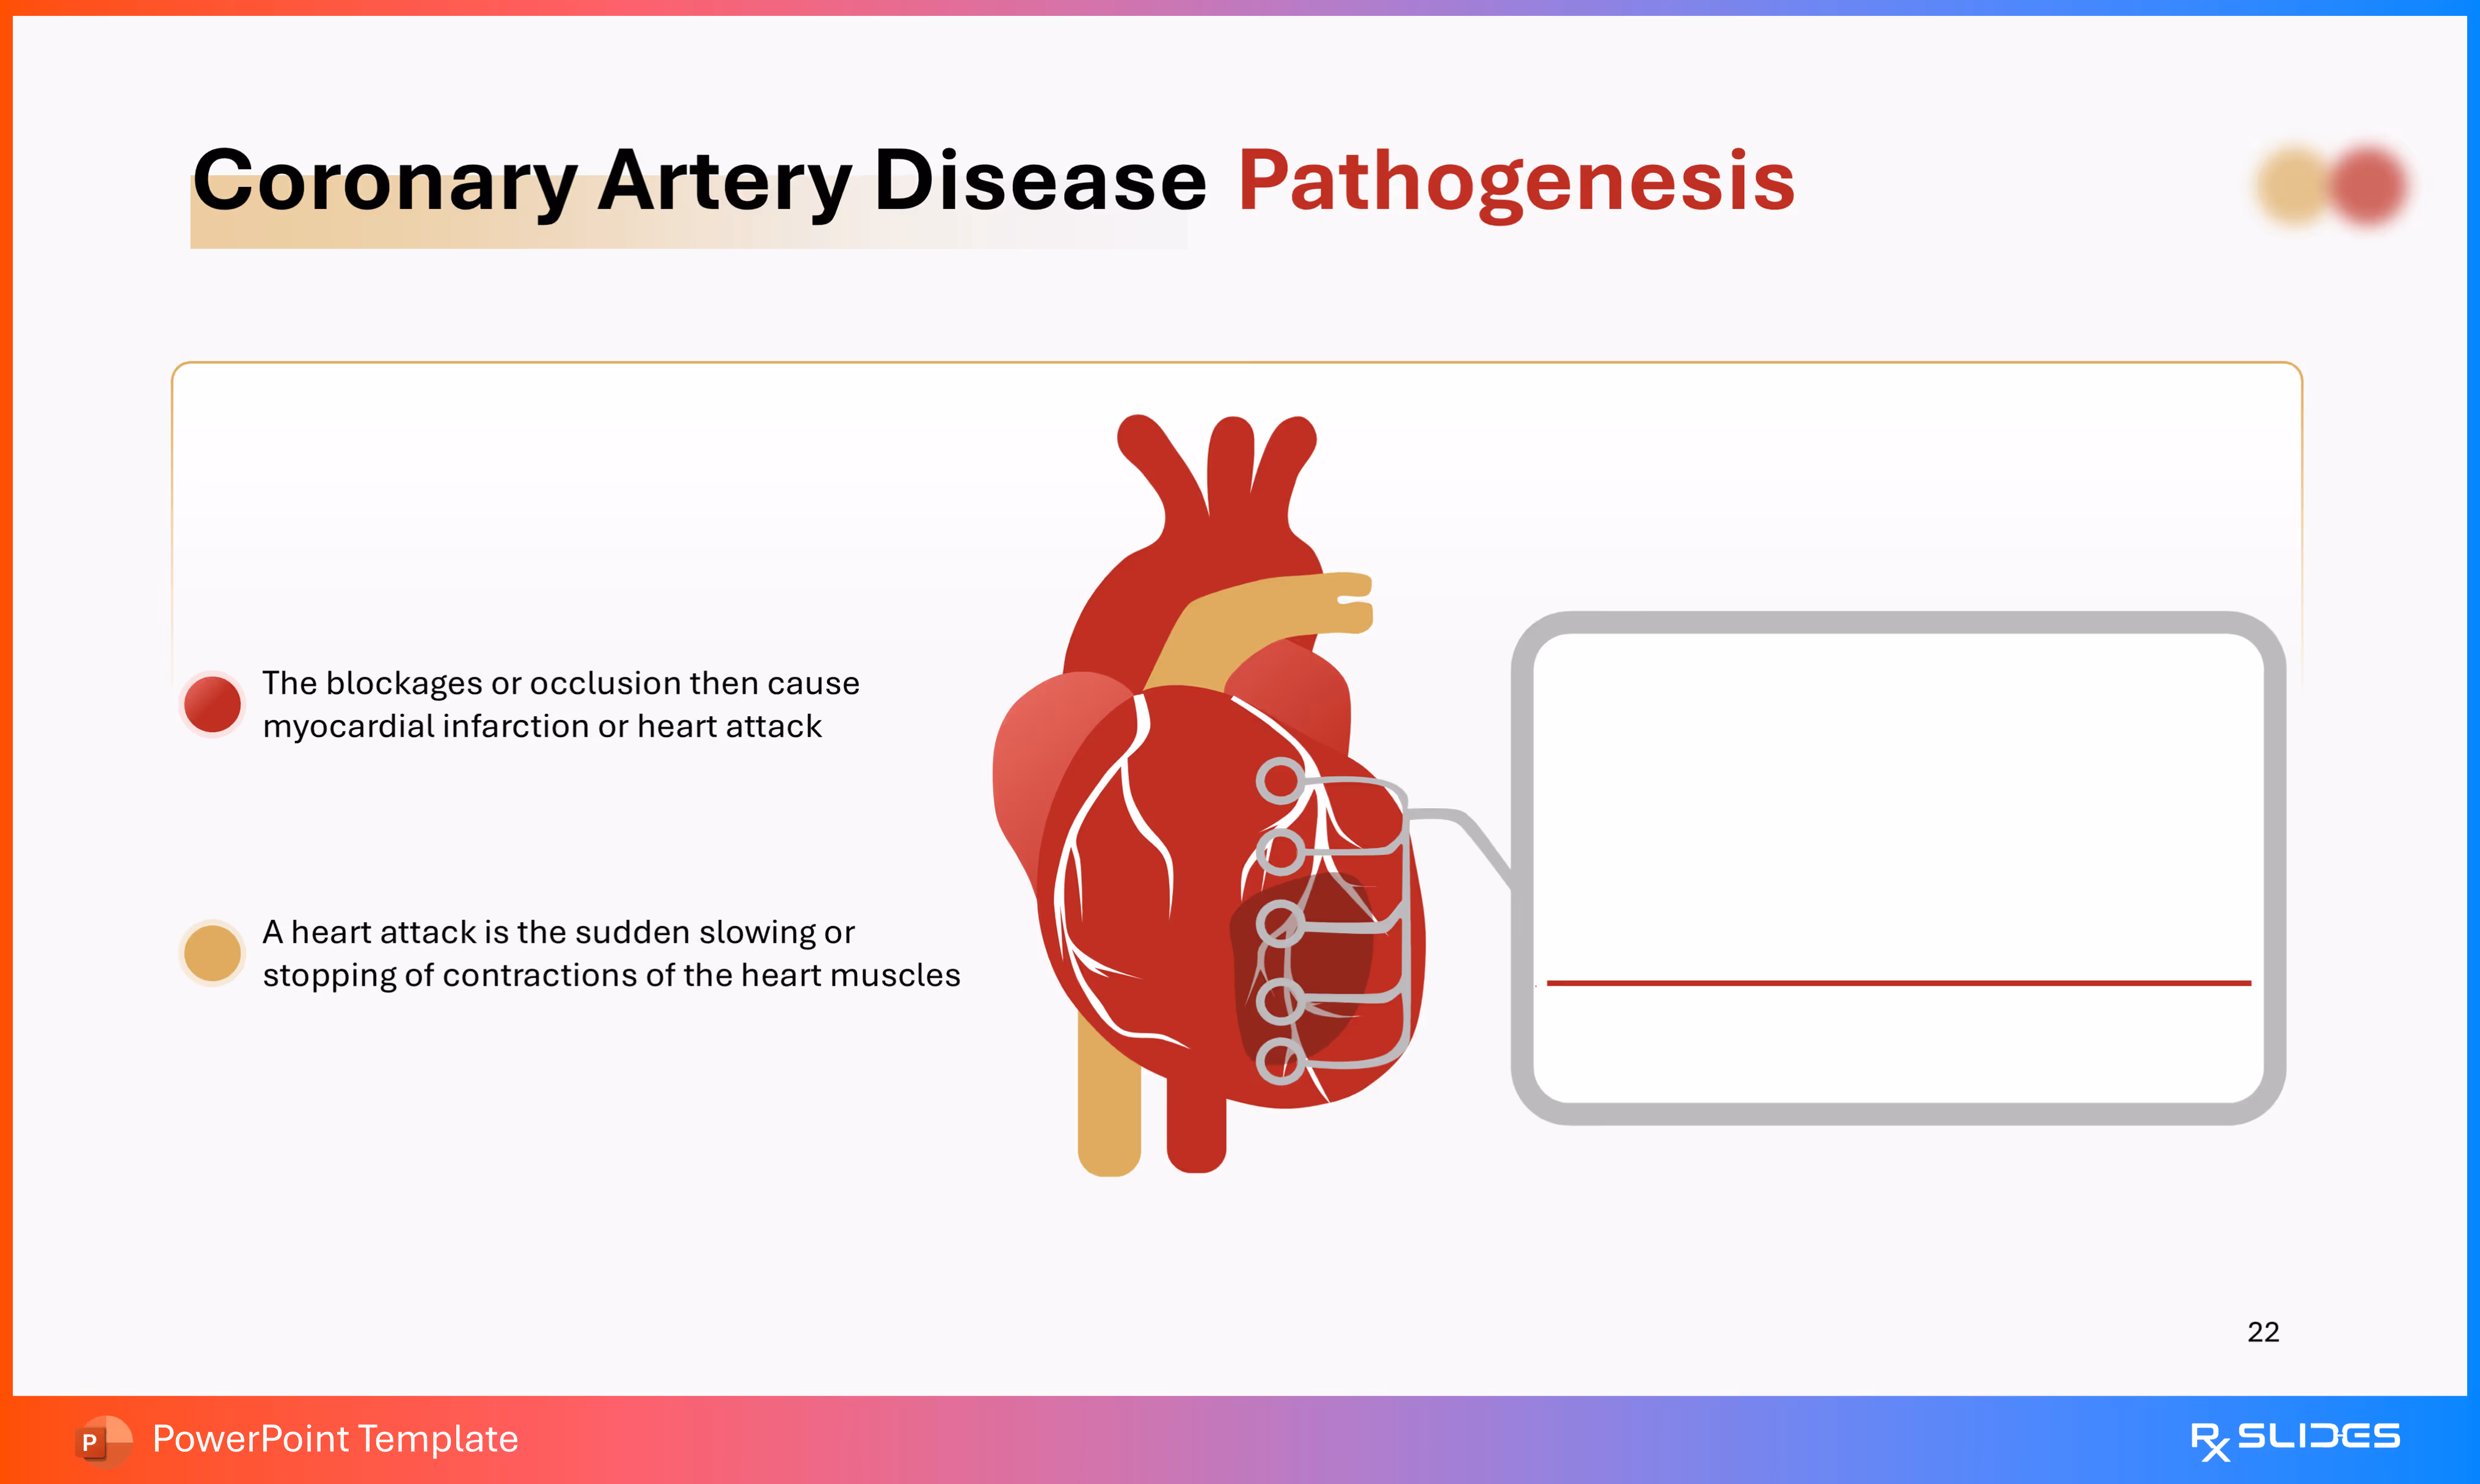
- This slide links the disease process (Pathogenesis) to the clinical event:
- The blockages or occlusion then cause myocardial infarction or heart attack.
- A heart attack is the sudden slowing or stopping of contractions of the heart muscles.
- The slide features a large illustration of the heart.
- A magnified view is pulled out from the heart's surface, showing a blocked coronary artery (similar to Stage 3 on Slide 21).
- A chart-like graphic is also included, which may be intended to show the loss of heart function (e.g., stopping of muscle contractions) following the occlusion.
Slide 23 - Symptoms (Section Divider)
.avif)
- The slide features a prominent, stylized red icon of a person with arms crossed over their chest and lightning bolts radiating from their chest/throat area.
- This icon is a classic representation of chest pain (angina), the primary symptom of CAD.
- The design maintains the CAD template's characteristic red, white, and warm beige/yellow blurred circles and colors.
Slide 24 - Symptoms (Detail)
.avif)
- The slide uses four circular icons in a horizontal flow to detail key symptoms.
- Content Sections (Symptoms):
- Nausea: Represented by a brain/head icon with stars, often signifying dizziness or illness.
- Discomfort: Represented by a lung/chest cavity icon, suggesting general chest or respiratory discomfort.
- Neck pain: Represented by a stylized spine with lightning bolts, indicating pain radiating to the neck, jaw, or back.
- Short breath: Represented by a person's head with a stylized breathing or gasping icon.
- The presentation features a red footer and alternates the icon colors between red and warm beige/yellow.
Slide 25 - Ischemic Heart Disease Symptoms (Alternative Layout)
.avif)
- This slide uses three prominent icons placed in boxes, detailing symptoms in a vertical format.
- Content Sections (Symptoms): The symptoms are similar to those on Slide 24 but are reduced to three main points:
- Short breath: Represented by a person clutching their chest/head area.
- Discomfort: Represented by a person with arms crossed over their chest/stomach area.
- Nausea: Represented by a person clutching their chest/head area.
- The presentation features an alternating red and warm beige/yellow color scheme for the symptom boxes and icons.
Slide 26 - Diagnosis (Section Divider)
.avif)
- The slide features a prominent stylized icon of a heart shown on a computer monitor next to an ultrasound probe/transducer.
- This image strongly suggests that the upcoming slides will cover diagnostic methods such as echocardiograms (ultrasound), ECGs/EKGs, or other forms of cardiac monitoring.
- The design uses the template's signature red, white, and warm beige/yellow blurred circles and colors.
Slide 27 - Diagnosis (Detail)
.avif)
- The slide uses four rectangular boxes arranged in two rows, detailing specific diagnostic procedures.
- Content Sections (Diagnostic Methods):
- CT scan: Represented by a medical scanner icon.
- Echocardiogram: Represented by a heart icon on a monitor with an ultrasound probe.
- Electrocardiogram: Represented by a heartbeat waveform (ECG/EKG) icon.
- Cardiac catheterization: Represented by a stylized heart with a catheter entering it.
- The layout uses the template's characteristic red borders and warm beige/yellow background accent.
Slide 28 - Ischemic Heart Disease Diagnosis (Alternative Layout)
.avif)
- This slide uses four vertical columns to present the same diagnostic methods as Slide 27, but with a different background color and layout. The design uses a large, warm beige/yellow shape as a background accent.
- The four methods are listed in a different order from Slide 27
- The layout emphasizes a strong red and warm beige/yellow color palette, contrasting with the mostly white background of Slide 27.
Slide 29 - CAD Diagnosis (Alternative Flow Chart Layout)
.avif)
- This slide presents the four diagnostic methods in a circular flow chart layout, with a large central circle containing the main title.
- The four methods are the same as on Slides 27 and 28
- The icons are arranged around the center and connected by a sweeping arrow or arc, suggesting a sequence of steps or a collection of related options.
Slide 30 - Treatment (Section Divider)
.avif)
- The slide features a prominent, stylized red icon of a heart with a large syringe or injection entering it.
- This visual clearly signals the upcoming content will cover medical interventions, ranging from medication to advanced cardiac procedures.
- The design maintains the CAD template's characteristic red, white, and warm beige/yellow blurred circles and colors.
Slide 31 - Ischemic Heart Disease Treatment: Medication

- The slide uses a circular diagram surrounding a central illustration of a medicine bottle and pills. This focuses the content specifically on pharmacological treatments.
- Five types of medications commonly used to treat CAD/IHD are listed:
- Cholesterol drugs.
- (ACE) inhibitors.
- Nitroglycerin.
- Aspirin.
- Beta-blockers.
- The visual flow connects the listed medications back to the central illustration.
Slide 32 - Coronary Artery Disease Surgeries
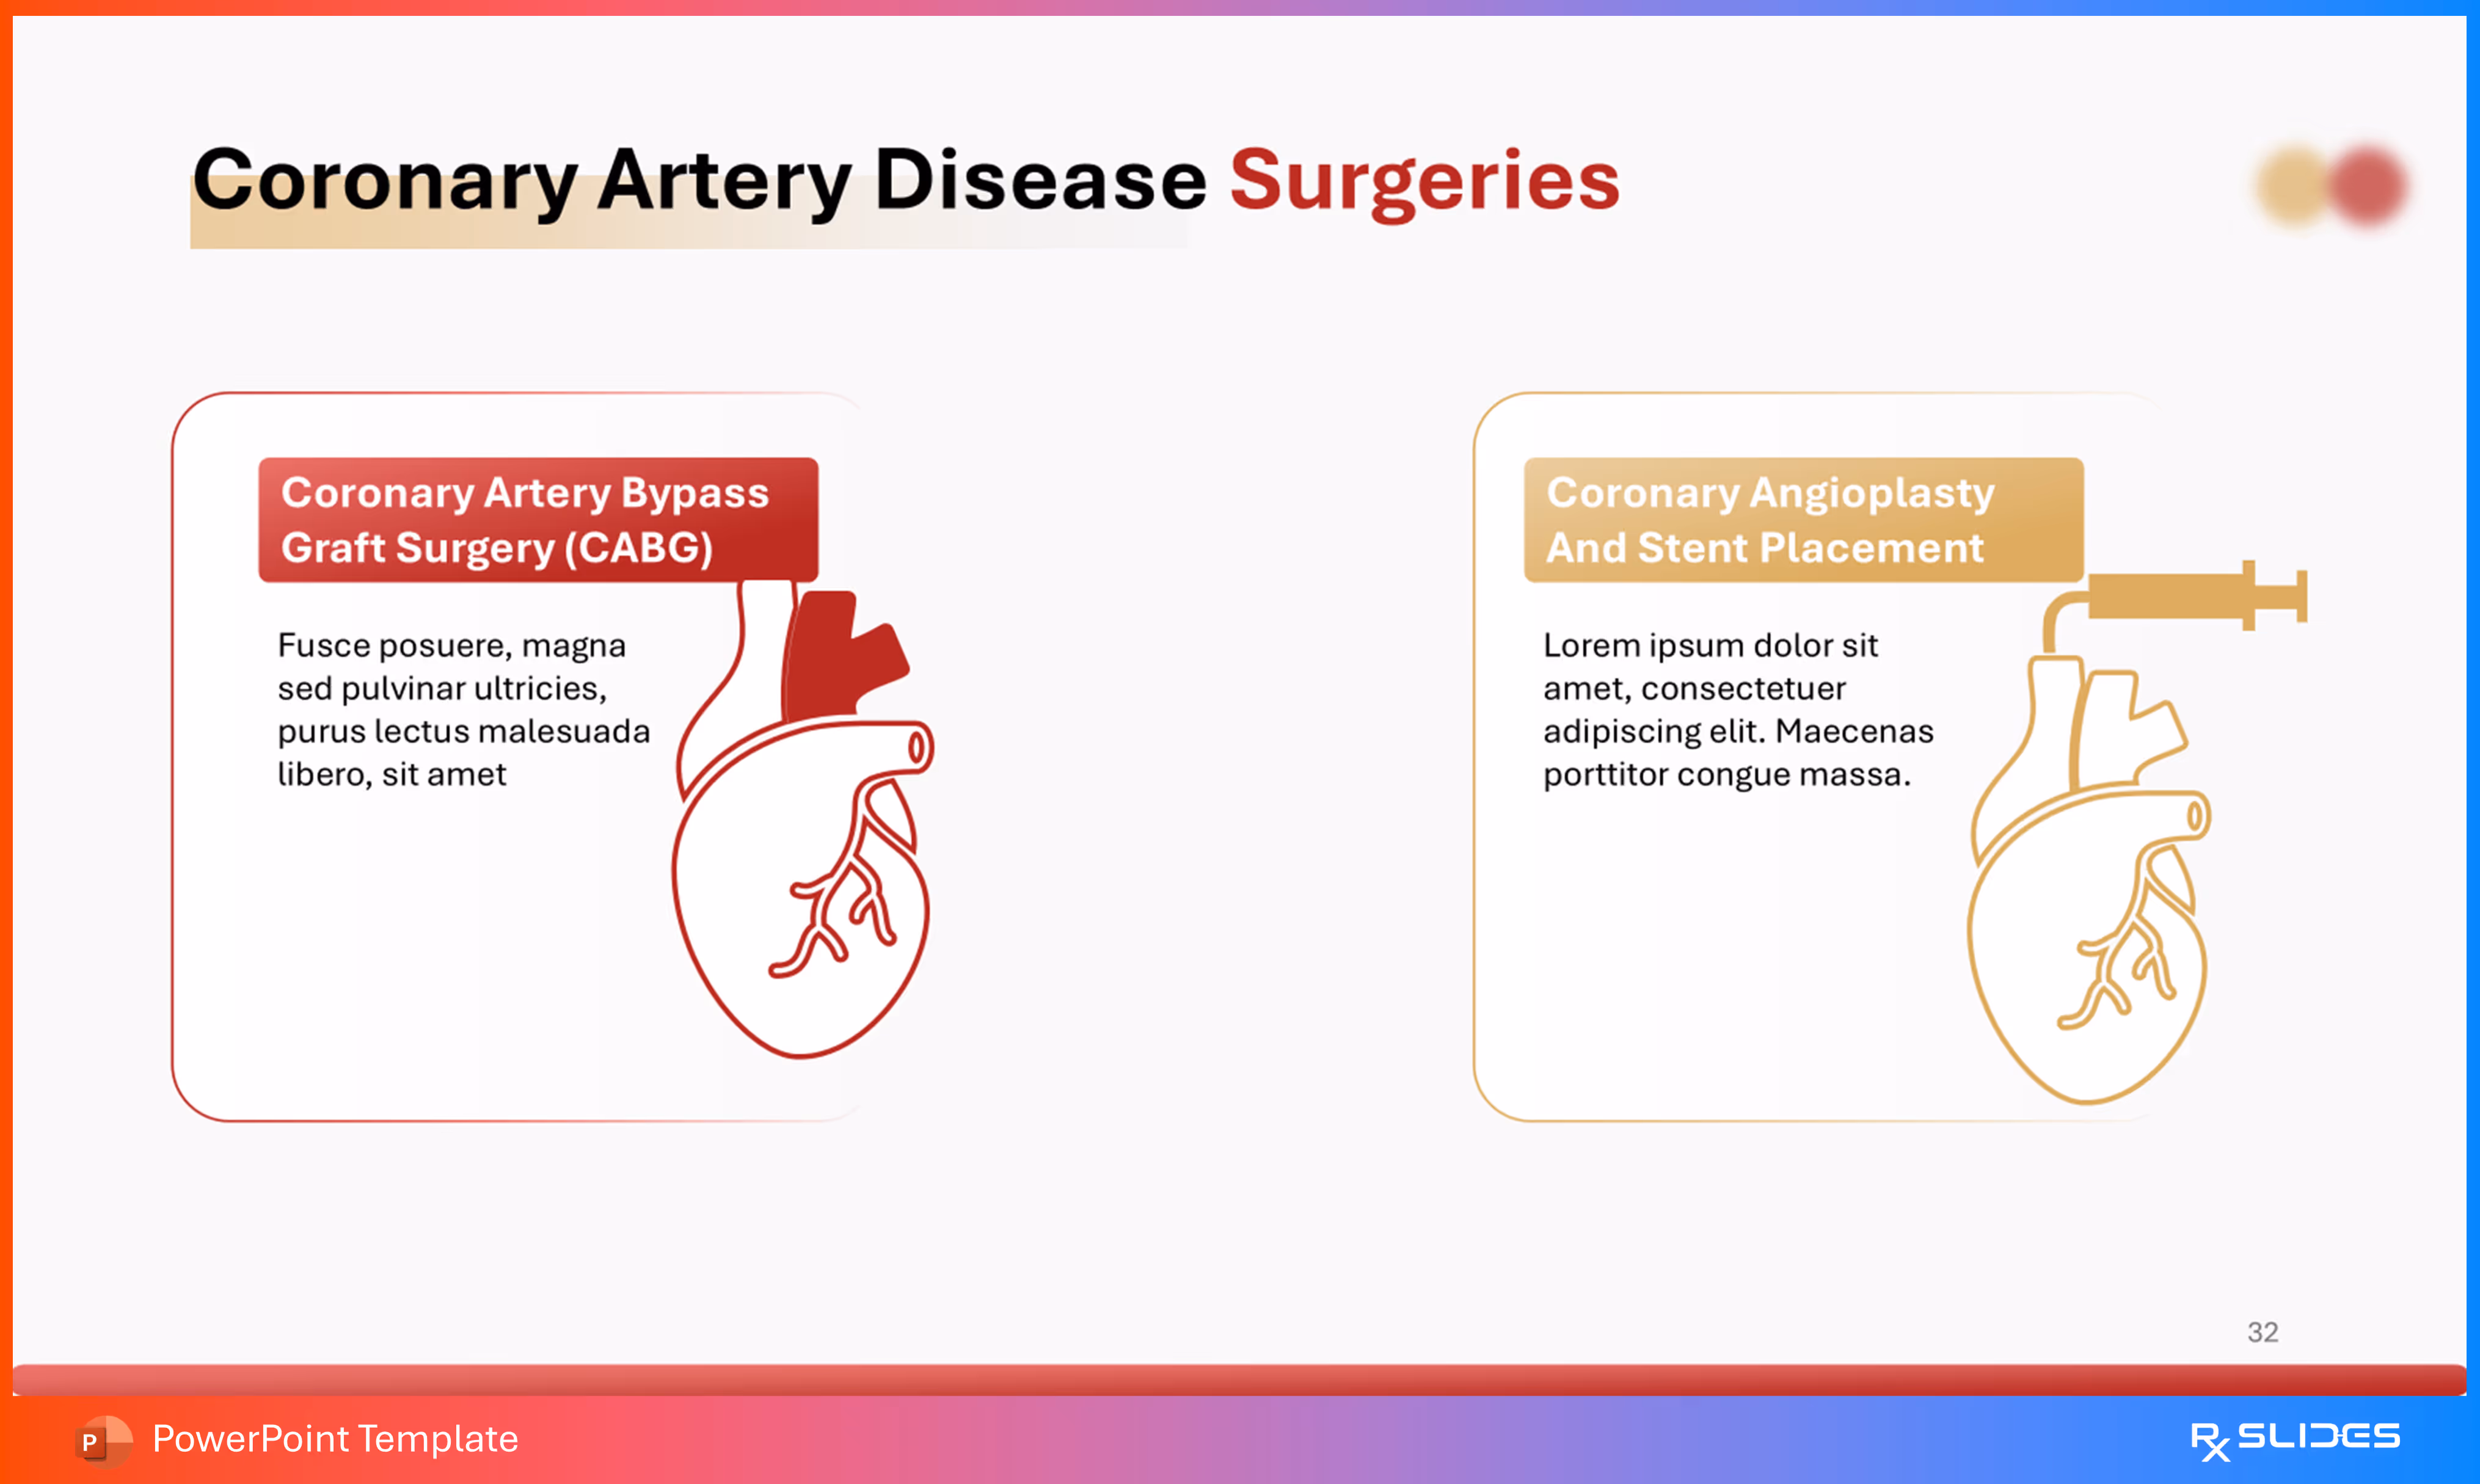
- The slide uses two distinct, side-by-side boxes to detail the two major surgical treatment options.
- Content Sections (Surgical Treatments):
- Coronary Artery Bypass Graft Surgery (CABG): This section is highlighted in red and features an outline of the heart with its coronary arteries.
- Coronary Angioplasty And Stent Placement: This section is highlighted in warm beige/yellow and features an outline of a heart with an artery being accessed by a catheter/syringe device.
Slide 33 - Coronary Artery Bypass Graft Surgery (CABG) Detail
%20Detail.avif)
- The text explains the core concept of the surgery:
- "A surgeon takes a healthy blood vessel from another part of the body to create a new path for blood in the heart".
- "The blood then goes around the blocked or narrowed coronary artery".
- The slide features a large illustration of the heart showing the surgical result:
- It clearly labels the "Bypass" which is shown as a new vessel segment diverting blood flow around the obstruction.
- It also labels the "Blocked artery".
- A smaller inset illustration shows a magnified view of the bypassed artery segment.
Slide 34 - Coronary Angioplasty And Stent Placement Detail
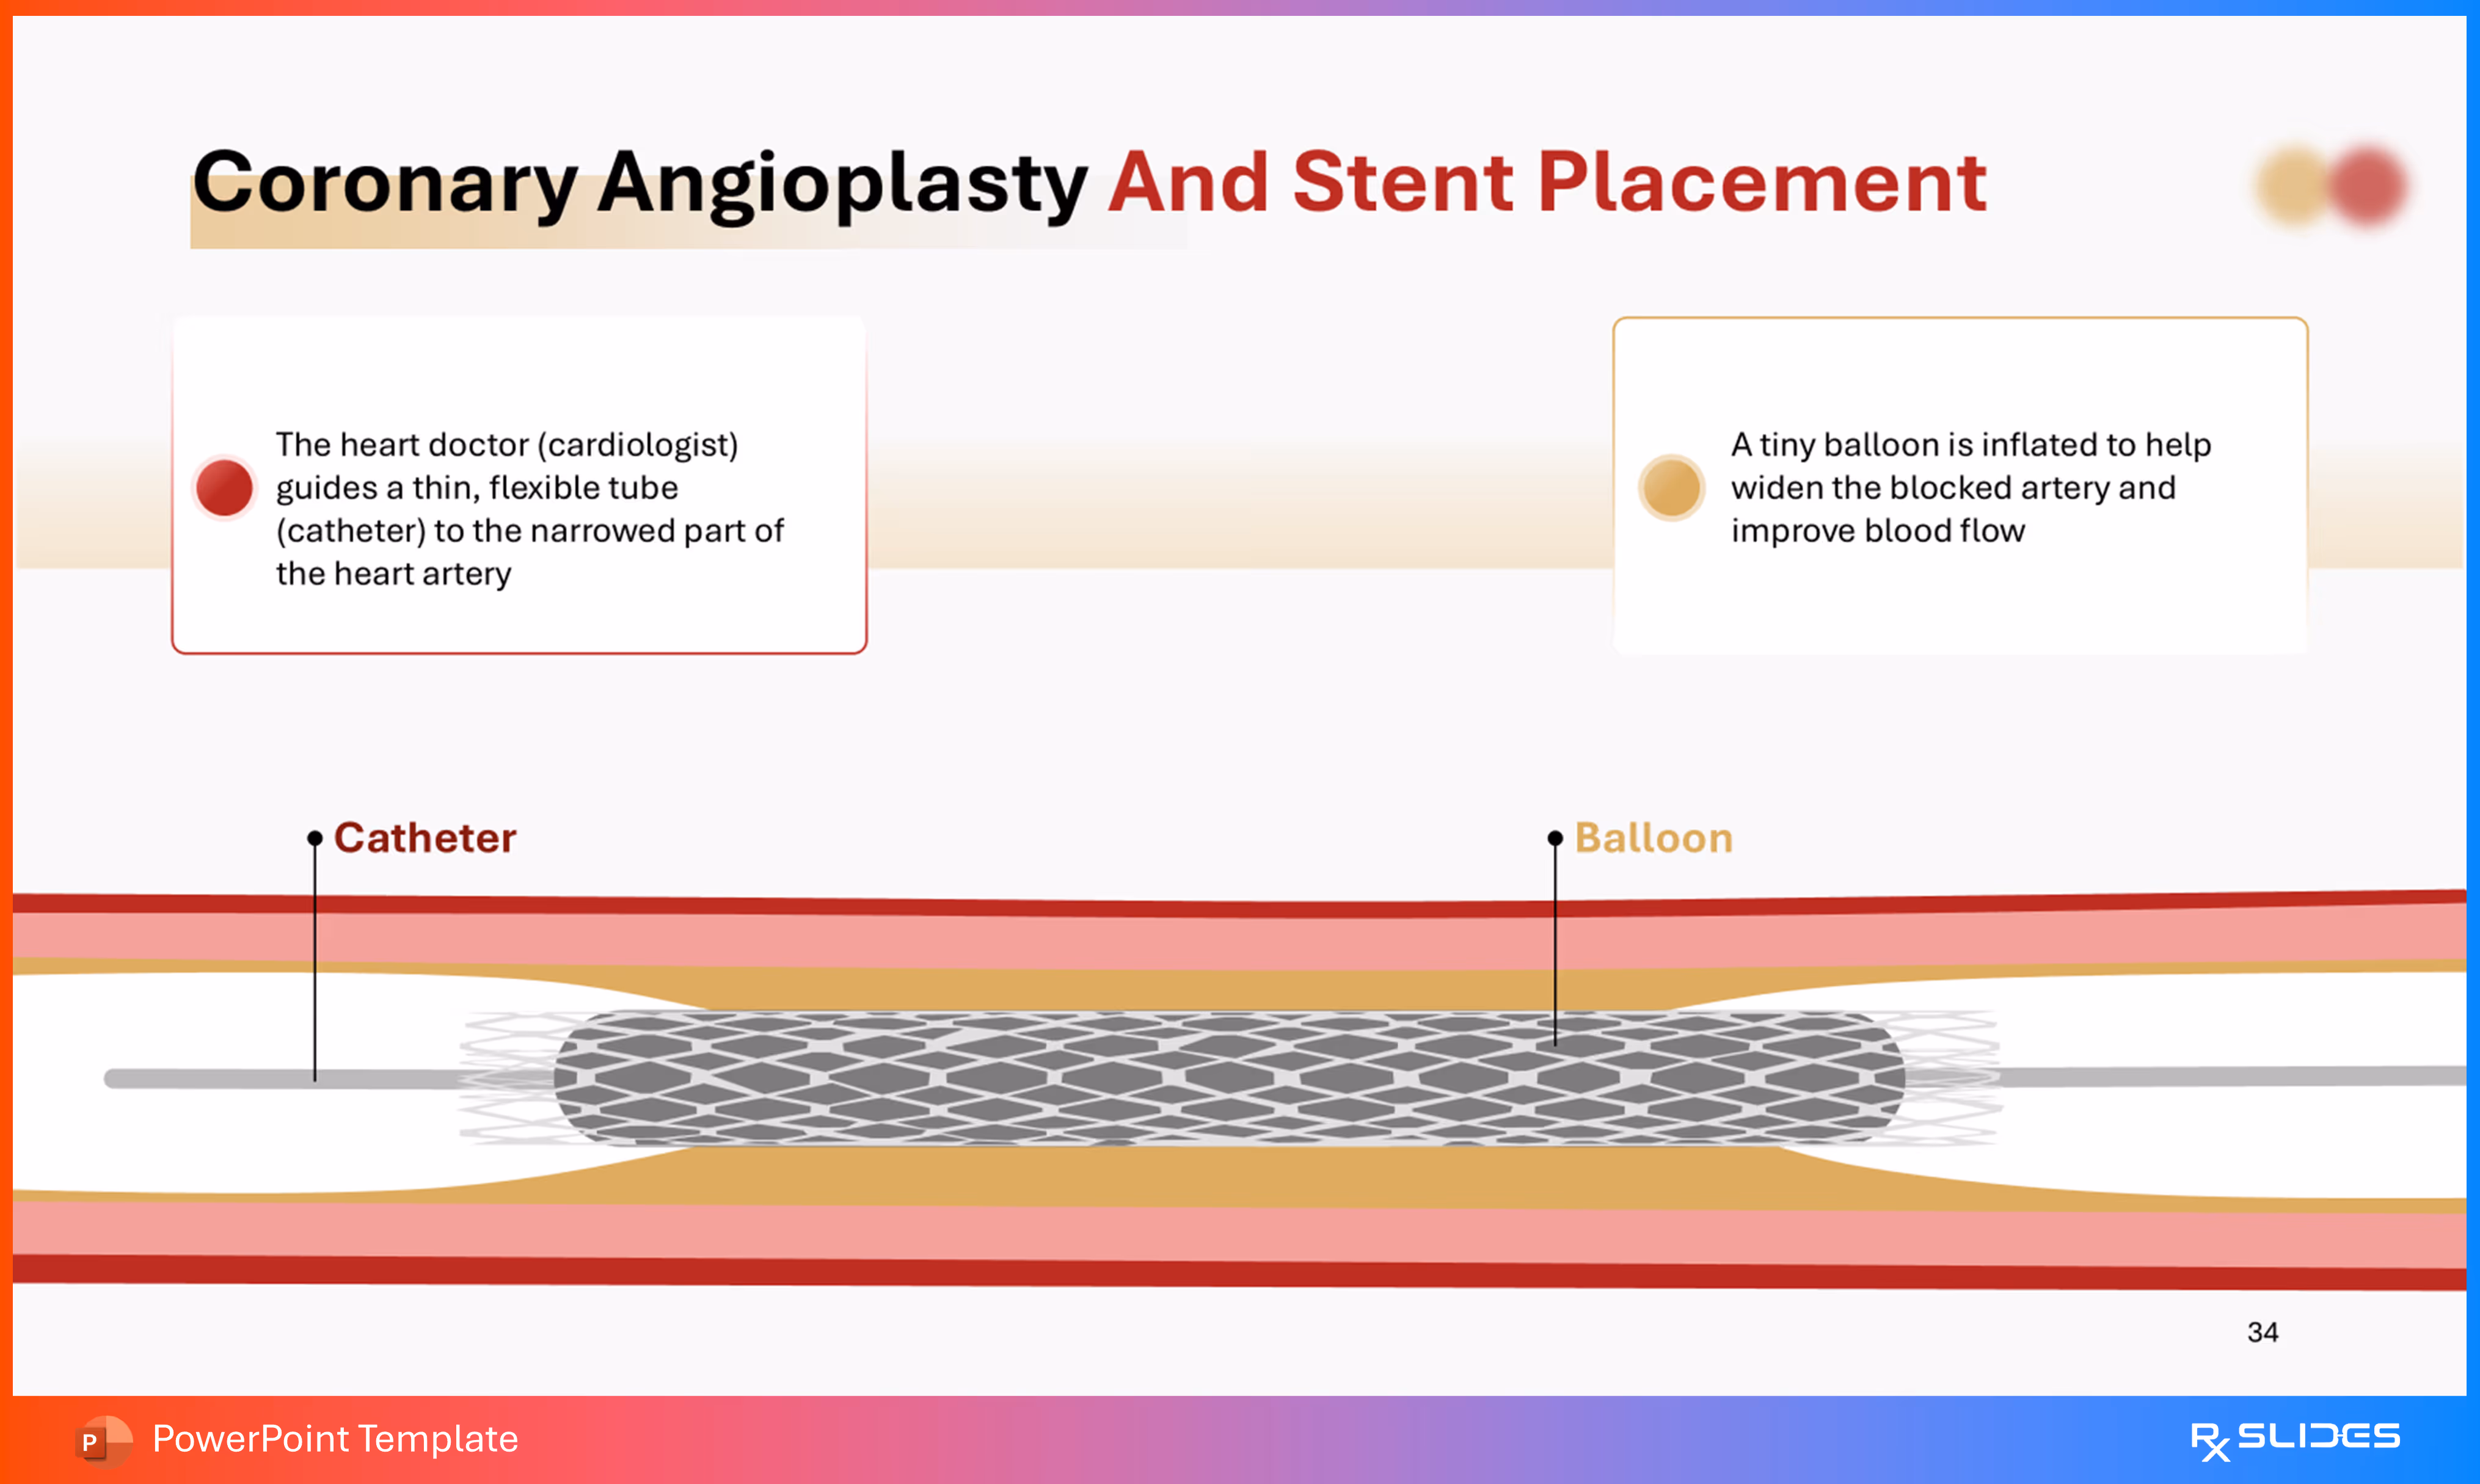
- The slide explains the key steps of the procedure:
- A heart doctor (cardiologist) guides a thin, flexible tube (catheter) to the narrowed part of the heart artery.
- A tiny balloon is inflated to help widen the blocked artery and improve blood flow.
- The main graphic is a cross-section of a coronary artery, illustrating the mechanics of the procedure.
- The illustration clearly labels the Catheter and the Balloon (which is inflated to deploy the stent).
- A stent (a wire mesh tube) is shown expanded against the artery wall to hold it open.
Slide 35 - Coronary Angioplasty And Stent Placement: Stent Detail
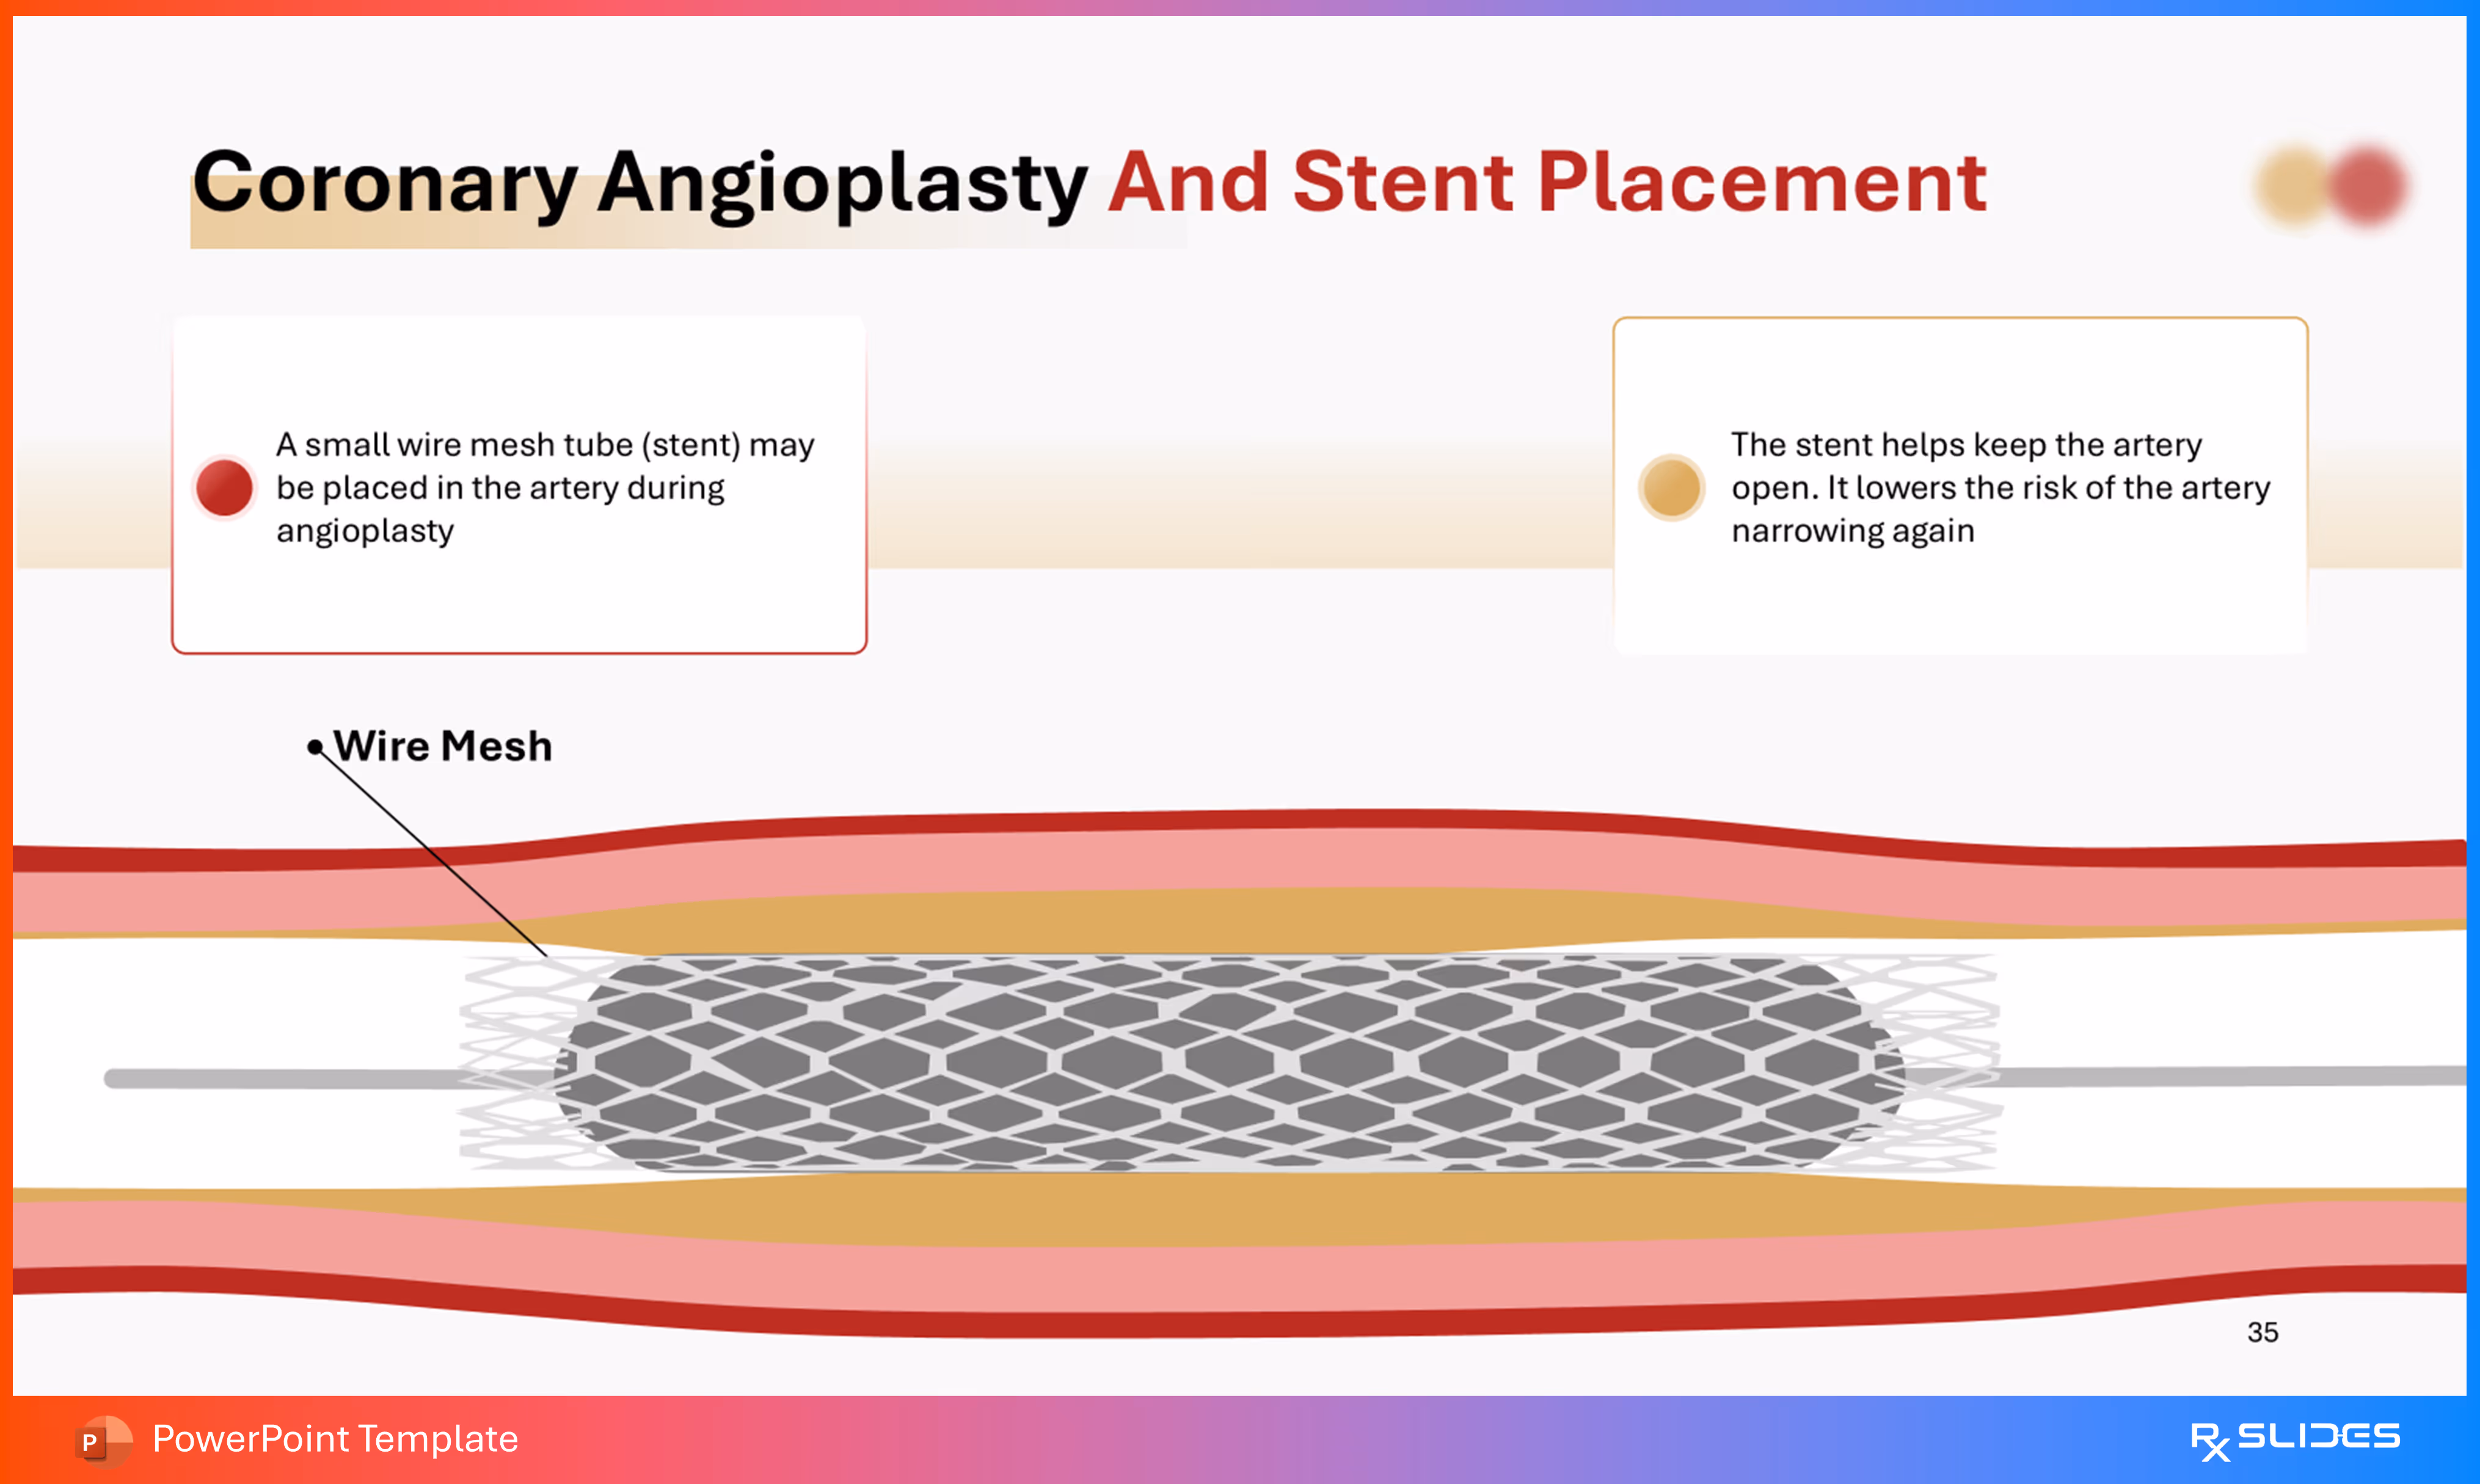
- The slide details the role of the stent:
- "A small wire mesh tube (stent) may be placed in the artery during angioplasty".
- "The stent helps keep the artery open. It lowers the risk of the artery narrowing again".
- The graphic is a detailed cross-section of the artery, focusing on the expanded stent:
- It clearly labels the Wire Mesh of the stent.
- The illustration shows the stent permanently holding the artery open against the plaque buildup.
Slide 36 - Coronary Angioplasty and Stent Placement (Summary Flow)
.avif)
- This slide summarizes the three main steps of the angioplasty and stent procedure using a vertical flow diagram.
- Content Sections (Procedure Steps):
- Catheter Insertion (Red Dot): "The heart doctor guides a catheter to the narrowed part of the heart artery".
- Balloon Inflation (Yellow Dot): "A tiny balloon is inflated to help widen the blocked artery and improve blood flow".
- Stent Placement (Red Dot): "A small wire mesh tube (stent) may be placed in the artery during angioplasty".
- The right side of the slide shows four sequential diagrams of the artery, clearly illustrating: the initial blockage, the stent/balloon being inserted, the vessel being widened, and the stent remaining in place.
Slide 37 - Prevention (Section Divider)
.avif)
- The slide features a prominent, stylized red medical document or clipboard with a cross icon, alongside a red pen.
- This icon suggests medical advice, guidelines, or a prescription for a healthier lifestyle, indicating the shift to preventative measures.
- The design maintains the CAD template's characteristic red, white, and warm beige/yellow blurred circles and colors.
Slide 38 - Coronary Artery Disease Prevention (Detail)
.avif)
- The slide uses four distinct boxes in a 2x2 grid to present the preventative steps.
- Content Sections (Prevention Methods):
- Exercise (Red Box): Represented by a dumbbell icon, emphasizing physical activity.
- Medical follow up (Yellow Box): Represented by a clipboard/medical record icon, stressing the importance of regular check-ups and monitoring.
- No smoking (Yellow Box): Represented by a no-smoking icon, addressing a major risk factor.
- Healthy food (Red Box): Represented by a bowl of fruit/vegetables icon, promoting dietary changes.
Slide 39 - Ischemic Heart Disease Prevention (Alternative Flow Layout)
.avif)
- This slide uses four circles arranged in a flow diagram around a central implied point, summarizing preventative steps.
- The four methods are similar to Slide 38, but one label has changed
Slide 40 - Thank You (Conclusion)
.avif)
- The slide features a large, stylized red human heart with its major vessels visible, positioned next to the title.
- The design uses the template's characteristic red and warm beige/yellow blurred circles and colors as a background accent.
Features of the Template
- 100% editable PowerPoint template.
- Editable colors, you can change according to your presentation style and company branding guidelines.